Original Research Article
A community based study to assess the prevalence and
sociodemographic factors influencing undernutrition among
children aged 6 to 14 years in a rural area of Coimbatore
Xavier C. Rajan
1*, Ravishankar
2INTRODUCTION
Globally, malnutrition among school age children is a major public health concern. More than 200 million school age children are stunted and underweight and if no action is taken and at this rate, about one billion school children will be growing up by 2020 with impaired physical and mental development.1-5
Malnutrition is the underlying cause of one third of the 7.6 million child deaths each year before their fifth birthday. Meeting this challenge is doubly urgent because among children who survive, chronic malnutrition causes devastating and irreversible damage.6 Lack of nutritious food, coupled with infection and illness, means their bodies and brains don’t develop properly and at least 170 million children are affected by stunting.7,8 Conditions of ABSTRACT
Background: Globally, malnutrition among school age children is a major public health concern. The objectives of the study were to determine the prevalence of under nutrition (thinness and stunting) among children aged 6 to 14 years in a rural area of Coimbatore district; to determine the socio-demographic factors influencing under nutrition (thinness and stunting) among these children.
Methods: A community based- cross sectional study was conducted from December 2015 to July 2016 in the field practice area of PSG Rural Health Training Center Vedapatti. Out of the 14 villages in this area, five villages (clusters) were selected by cluster sampling. Data was collected from 702 children aged 6 to 14 years in these five villages using a structured questionnaire. Z score was used to calculate nutritional status. Thinness is defined as the BMI for age (BAZ) <-2SD.Stunting is defined as the Height-for-age (HAZ) <-2SD.The association of Thinness with socio-demographic factors were studied by univariate analysis. The association of Stunting with socio-demographic factors were studied by univariate analysis and logistic regression analysis.
Results: The prevalence of Thinness was 15.5% (95%CI: 12.82% to 18.18%) and that of stunting was 18.8% (95%CI: 15.91% to 21.69%). In univariate analysis there was no statistically significant association between thinness and socio-demographic factors. Stunting showed statistically significant association with educational status (illiteracy) of mothers and working mothers in logistic regression analysis.
Conclusions: The current study revealed that undernutrition as indicated by thinness and stunting was prevalent to some extent among these children. Stunting was significantly higher among those children whose mothers were illiterate and working. Health education and encouraging working mothers will help to solve this.
Keywords: Thinness, Stunting, BAZ, HAZ, Coimbatore
1
Institute of Community Medicine, Madras Medical College, Chennai, Tamil Nadu, India
2
Department of Community Medicine, PSG Institute of Medical Sciences and Research, Coimbatore, Tamil Nadu, India
Received: 22 March 2019
Accepted: 08 May 2019
*Correspondence:
Dr. Xavier C. Rajan,
E-mail: [email protected]
Copyright: © the author(s), publisher and licensee Medip Academy. This is an open-access article distributed under the terms of the Creative Commons Attribution Non-Commercial License, which permits unrestricted non-commercial use, distribution, and reproduction in any medium, provided the original work is properly cited.
early life (from conception to two years) provide the foundations for adult life. Vicious interactions between malnutrition, poor health, and impaired cognitive development set children on lower development paths and lead to irreversible changes.9
The prevalence of malnutrition among children in India is highest in the world. Malnutrition in school going children is responsible for 22% of the country’s burden of disease. Recent reports showed that Tamil Nadu has shown gains in terms of reduction of the problem of malnutrition, but it still has a high percentage of malnourished children.11 However, there are only a few studies regarding under nutrition among children aged 6 to 14 years reported from Coimbatore. Hence this study was undertaken to estimate the prevalence of under-nutrition in the rural field practice area of the Department of Community Medicine of PSG Institute of Medical Sciences and Research, which will help in devising suitable strategies to reduce this problem in this area.
Objectives
The objectives of this study are to estimate the prevalence of under nutrition (Thinness and Stunting) among children aged 6 to 14 years in a rural area of Coimbatore district and to determine the socio-demographic factors influencing under nutrition (Thinness and Stunting) among children aged 6 to 14 years in a rural area of Coimbatore district.
METHODS
Field practice area of PSG Rural Health Training Center, Vedapatti containing 14 villages was selected for this study. Totally 2985 children of 6 to 14 years ( School age children) were living in these 14 villages. The sample size calculated was 702, assuming prevalence of undernutrition as 29%, absolute precision of 5%,design effect of 2, and non response rate of 10%.12,13 Five out of the 14 villages (clusters) were selected by cluster sampling. A community based- cross sectional study was conducted from December 2015 to July 2016 in these five villages, and data was collected using a structured questionnaire.
All the school-age children (aged 6–14 years) who were permanent residents in these five villages were included in this study. School- age children (aged 6–14 years) who were absent for 3 visits within a week were excluded. The number of children included in this study was 702. Ethical clearance was obtained from Institutional Human Ethics Committee, PSGIMSR. Informed consent from parent and assent from the child were obtained.
Age of the child, sex of the child, total number of family members, type of house, educational status of the mother, occupation of the mother, educational status of the father, occupation of the father, socio economic status (modified
Prasad’s classification), were the socio- demographic factors were considered as independent variables. Thinness and stunting were considered as dependent variables.
Standing height was measured (to 0.5 cms) using stadiometer, without shoes, the child standing erect and looking straight so that the inferior orbital margin and the tragus of the ear fall in a horizontal plane parallel to the ground. An electronic weighing scale was used to measure the weight in kilograms. The scale was calibrated. Zero error was checked, children were without shoes, in shirt and trousers or skirt. The weighing machine was placed on a firm and flat ground. Weight was recorded to the nearest 100 grams. The same balance was used throughout the study. Body Mass Index, and Height for age were expressed in standard deviation units (Z scores) from reference median as recommended by 2007 WHO growth reference for (5-19 years). The calculation for Modified Prasad’s classification was done using the multiplication factor as 57.07 and Consumer Price Index for Industrial Workers (November 2015) in Coimbatore area as 250.14 Age of the child was calculated from the date of birth to number of completed years of the child.
Thinness is defined as the BMI for age (BAZ) <-2SD. Stunting is defined as the Height-for-age (HAZ) <-2SD.
The various Interpretation of cut-offs of (BAZ)15 are:
Overweight: >+1SD (equivalent to BMI 25 kg/m2), Obesity: >+2SD (equivalent to BMI 30kg/m2), Thinness: <-2SD, Severe thinness: <-3SD Interpretation of cut-offs for (HAZ) are: Stunting: HAZ <–2 Z score, or <3rd percentile Severe stunting : <-3 Z score
All the data collected was entered with MS Excel and imported to WHO Anthro software. Z score was arrived by Anthro+ package using WHO standards for nutritional status classification. The output of Anthro was analyzed with SPSS version 19. Prevalence was expressed in percentage with 95% confidence intervals (CI). Distribution of Socio-demographic factors of the study participants were expressed in percentage. The association of thinness with socio-demographic factors was studied by univariate analysis. The association of stunting with socio-demographic factors was first studied by univariate analysis and those factors found significant were subjected to logistic regression analysis.
RESULTS
Table 1: Association of thinness with socio-demographic factors by univariate analysis.
Factors Category
Thinness Unadjusted odds
ratio (95%
confidence interval)
P value
Yes No
N (%) N (%)
Age in years Age less than 10 54 (15.6) 292 (86.4) 1.01 (0.67-1.52) 0.52 Age 10 and above 55 (15.4) 301 (84.6) 1
Sex Female 50 (13.5) 321 (86.5) 0.72 (0.48-1.08) 0.07 Male 59 (17.8) 272 (82.2) 1
Total number of family members
>4 47 (14.8) 270 (85.2) 0.91 (0.60-1.37)
0.36 4 or less 62 (16.1) 323 (83.9) 1
Type of house Kutcha 23 (15.9) 122 (84.1) 1.033 (0.63-1.71) 0.49
Others 86 (15.4) 471 (84.6) 1
Mother’s educational status
Illiterate 23 (16.8) 114 (83.2) 1.12 (0.68-1.86)
0.37 Literate 86 (15.2) 479 (84.8) 1
Mother’s occupation Unemployed 39 (15.1) 219 (84.9) 0.95 (0.62-1.46) 0.45 Employed 70 (15.8) 374 (84.2) 1
Father’s education Illiterate 18 (14.5) 106 (85.5) 0.91 (0.53-1.57) 0.43 Literate 91 (15.7) 487 (84.3) 1
Father’s occupation Not working 0 (0) 6 (100) 1.19 (1.15-)1.22 0.36 Working 109 (15.7) 587 (84.3) 1
Socio economic status (modified Prasad Scale)
Lower SES
(Class IV,V) 65 (17.8) 301 (82.2) 1.43 (0.95-2.17)
0.05 High SES
(Class I,II,III) 44 (13.1) 292 (86.9) 1
(*p<0.05 statistically significant).
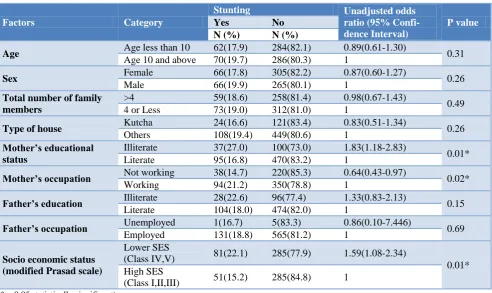
Table 2: Association of stunting with socio-demographic factors by univariate analysis.
Factors Category
Stunting Unadjusted odds
ratio (95% Confi- dence Interval)
P value
Yes No
N (%) N (%)
Age Age less than 10 62(17.9) 284(82.1) 0.89(0.61-1.30) 0.31 Age 10 and above 70(19.7) 286(80.3) 1
Sex Female 66(17.8) 305(82.2) 0.87(0.60-1.27) 0.26 Male 66(19.9) 265(80.1) 1
Total number of family members
>4 59(18.6) 258(81.4) 0.98(0.67-1.43)
0.49 4 or Less 73(19.0) 312(81.0) 1
Type of house Kutcha 24(16.6) 121(83.4) 0.83(0.51-1.34) 0.26
Others 108(19.4) 449(80.6) 1
Mother’s educational status
Illiterate 37(27.0) 100(73.0) 1.83(1.18-2.83)
0.01* Literate 95(16.8) 470(83.2) 1
Mother’s occupation Not working 38(14.7) 220(85.3) 0.64(0.43-0.97) 0.02* Working 94(21.2) 350(78.8) 1
Father’s education Illiterate 28(22.6) 96(77.4) 1.33(0.83-2.13) 0.15 Literate 104(18.0) 474(82.0) 1
Father’s occupation Unemployed 1(16.7) 5(83.3) 0.86(0.10-7.446) 0.69 Employed 131(18.8) 565(81.2) 1
Socio economic status (modified Prasad scale)
Lower SES
(Class IV,V) 81(22.1) 285(77.9) 1.59(1.08-2.34)
0.01* High SES
(Class I,II,III) 51(15.2) 285(84.8) 1
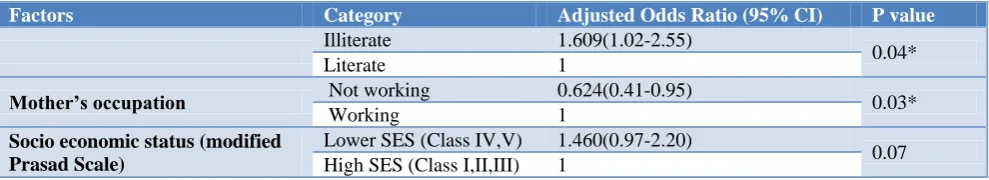
Table 3: Association of stunting with socio-demographic factors by logistic regression analysis.
Factors Category Adjusted Odds Ratio (95% CI) P value
Illiterate 1.609(1.02-2.55)
0.04*
Literate 1
Mother’s occupation Not working 0.624(0.41-0.95) 0.03*
Working 1
Socio economic status (modified Prasad Scale)
Lower SES (Class IV,V) 1.460(0.97-2.20)
0.07 High SES (Class I,II,III) 1
(*p<0.05 statistically significant).
The overall prevalence of Thinness (including severe thinness) and stunting (including severe Stunting) as 15.5% (95%CI: 12.82% to 18.18%), 18.8% (95%CI: 15.91% to 21.69%) respectively.
The nutritional status based on BAZ Score shows that thinness was noted among 11.4% of the children and 4.1% were severely thin. Over weight was noted among 7.3% of the children and obesity was noted among 3.8%. The nutritional status based on HAZ Score showed that. Stunting was noted among 13.8% children and 5% children were severely stunted
There was no statistically significant association between the socio-demographic factors and thinness by univariate analysis as shown in Table 1. Table 2 shows the association of stunting with socio-demographic factors by univariate analysis. Educational status of mother (illiterate), working status of mother (non working) and low socioeconomic status were significantly associated with stunting by univariate analysis. However other demographic factors showed no statistical significance.
The factors which were significantly associated with stunting by univariate analysis were subjected to logistic regression analysis and the results in Table 3 showed that educational status and working status of mothers are significantly associated with stunting. However, low socioeconomic status showed no statistically significant association with stunting in logistic regression analysis.
DISCUSSION
The overall prevalence of thinness in the current study was 15.5%. This finding is similar to that found in a cross sectional study conducted by Vinoth et al during 2013 in Southern part of India among school children of age (9-17 years), based on WHO-BAZ scores in which the prevalence of thinness was reported to be 13%. However, a higher prevalence was reported in few other studies.16 Bose et al did a cross sectional study in 2007 among Bengalee Hindu children aged 6-14 years and showed the prevalence of thinness as 23.1%.17 Anjum et al conducted a cross sectional study in Kashmir in 2008 among 5-14 year old children and reported 29% prevalence for thinness.18 Chakraborty et al conducted a cross sectional study among 5-10 year old school children of Nandigram in 2003 and showed the prevalence of thinness was 62.9%.19 Sameena et al conducted a cross sectional study
in Aligarh in 2010 among 6-12 year old children and found a very high prevalence of thinness of 79.4%.20
The overall prevalence of stunting in our study was 18.8%. This finding is similar to that found in certain other studies conducted in India. The cross sectional study conducted by Vinod et al reported the prevalence of stunting as 19.8%.16 Bose et al showed the prevalence of stunting as 17.2%.17 Ruchika et al conducted a cross sectional study from Allahabad and reported a prevalence of 17.3% for stunting among children of 7-10 years age group.21 Chowdhary et al from West Bengal conducted a cross sectional study among the 442 Santal children of Puruliya district of West Bengal aged 5-12 years and reported the prevalence of stunting as 17.0%.22 Bandopadyay et al conducted a study in Navinagar Mumbai among school children (aged 5 to 17 years), and reported the prevalence of stunting as 16.8%.23 A higher prevalence (40.4%) of stunting was found in a cross sectional study conducted by Hasan et al in Bangalore in 2010 among 6-14 year old children.24 However Anjum et al found a lower prevalence (9.25%) for stunting.18
Regarding the various factors influencing thinness, none of the socio-demographic factors included in our study was found to have a statistically significant association with thinness. However, Vinod et al found that factors like literacy level of the mothers, occupational status of the mothers and socio economic status had a statistically significant association with thinness.16
Our study has certain limitations. This study being a cross sectional study, the existence of a cause-effect relationship cannot be inferred. Regarding the factors influencing thinness and stunting, only socio-demographic factors were looked into in our study.
CONCLUSION
The current study revealed that under-nutrition as indicated by thinness and stunting was prevalent to some extent among the children aged 6 to 14 years in this rural community. It was observed that stunting was significantly higher among those children whose mothers were illiterate and working. Health education is to be given to mothers to create awareness about the problem of under-nutrition including its reduction and working mothers to be encouraged to pay more attention towards the health of their children.
Funding: No funding sources Conflict of interest: None declared
Ethical approval: The study was approved by IEHC PSGIMSR
REFERENCES
1. Srivastava A, Mahmood SE, Srivastava PM, Shrotriya VP, Kumar B. Nutritional status of school-age children :A scenario of urban slums in India. Archives of Public Health. 2012;70(1):8. 2. Ara R, Huque SR, Adhikary M, Uddi MN,
Mahmood AR, et al. Nutritional status among primary school children in a selected rural community. J Dhaka Med Coll 20: 2011:97-101. 3. UNICEF (2011). Levels and Trends in Child
Mortality: Estimates Developed by the UN Inter- agency Group for Child Mortality Estimation. Available at: https://www.unicef.org/media/files/ Child_Mortality_Report_2011_Final.pdf. Accessed 1 February 2019.
4. Save the Children: A Life Free From Hunger: Tackling Child Malnutrition, 2012. Available at: http://www.savethechildren.org.uk/sites/default/files /images/A_Life_Free_From_Hunger.pdf. Accessed on 01 February 2019.
5. Global Monitoring Report 2012: Food Prices, Nutrition, and the Millennium Development Goals. Available at: http://www.imf.org/external/pubs/ ft/gmr/2012/eng/gmr.pdf. Accessed 01 February 2019.
6. Chesire EJ, Orago AS, Oteba LP, Echoka E.Determinants of undernutrition among school age children in a Nairobi peri-urban slum. East Afr Med J. 2008;85:471-9.
7. Amuta E, Olusi T, Houmsou R. Relationship of intestinal parasitic infections and malnutrition among school children in Makurdi, Benue State – Nigeria. Internet J Epidemiol. 2009;7:1540-2614. 8. Garba CM, Mbofung CM. Relationship between
malnutrition and parasitic infection among school
children in the Adamawa region of Cameroon. Pakistan J Nutr. 2010;9:1094-9.
9. Reji P, Belay G, Erko B, Mulugeta M, Belay M. Intestinal parasiticinfections and malnutrition amongst first cycle primary school in Adama, Ethiopia. African J Primary Health Care Family Med. 2011: 3:1-5.
10. National nutrition monitoring bureau report on diet and nutrition status of adolescence, NIN, India 2002. Available at: http://nnmbindia.org/nnm breport2001-web.pdf Accessed 01 February 2019. 11. Navaneethan P, Kalaivani T, Rajasekaran C, Sunil
N. Nutritional status of children in rural India: a case study from Tamil Nadu, first in the world to initiate the Mid Day Meal scheme. Health. 2011;3:647-55.
12. Sundar RJ, Richard J. An Introduction to Biostatistics –A Manual for Students in Health Science, 3rd ed, 2004.
13. Shivaprakash NC, Joseph RB. Nutritional Status of Rural School-Going Children (6-12 Years) of Mandya District, Karnataka. Int J Sci Stud. 2014;2(2):39-43.
14. Mangal A, Kumar V, Panesar S, Talwar R, Raut D, Singh S. Updated BG Prasad socioeconomic classification, 2014: A commentary. IJPH. 2015;59:42-4
15. WHO Working group-Use and interpretation of anthropometric indicators of nutitional status Bulletin of WHO (1986) 64:924-41.
16. Selvaraj V, Sangareddi S, Velmurugan L, Muniyappan U, Anitha FS. Nutritional status of adolescent school children in a semi-urban area based on anthropometry. Int J Contemp Pediatr. 2016;3:468-72.
17. Bose K, Bisai S, Mukherjee S. Anthropometric characteristics and nutritional status of rural school children. Internet J Biological Anthropol. 2007;2:1-6.
18. Fazili A, Mir A, Pandit IM, Bhat IA, Rohul J, Shamila H. Nutritional Status of School Age Children (5 14 years) in a Rural Health Block of North India (Kashmir) Using WHO Z Score System. J Health Allied Sci. 2012;11:1-3.
19. Chakraborty R, Bose K. Very high prevalence of thinness using new international body mass index cut off points among 5-10 year old school children of Nandigram, west Bengal, India. Journal of Research in Medical Sciences: The Official J Isfahan Univ of Med Sci. 2009;14(2):129-33 20. Sultan S. Prevalence of stunting and thinness among
school-age children of working and non-working mothers in rural areas of Aligarh District. Indian J Basic Applied Med Res. 2014;3(3):51-7
21. Ruchika H, Faizan A, Kesari K, Prasad R. Assessment of Nutritional Status of 7 10 Years School Going Children of Allahabad District: A Review. Middle East J Sci Res. 2008;3(3):109-15. 22. Chowdhary SD, Chakraboraty T, Ghosh T.
Puriliya district West Bengal. Indian Pediatrics. 2008;45 (1):43 46.
23. Bandopadhyay D. A Nutrition Survey of school children, Navi Nagar Mumbai. Med J Forum India. 1988;44 (1):31-4.
24. Hasan I, Zulkifle M, Haseeb A. An assessment of nutritional status of the children of government urdu higher primary schools of Azad Nagar and its surrounding areas of Bangalore. Arch Applied Sci Res. 2011;3(3):167-76.
25. Mukherjee M, Chaturvedi LC, Bhalwar C. Determinants of Nutritional Status of School
Children. Med J Armed Forces India. 2008;64:227-231.