electronic Journal of Computer Science and Information Technology (eJCSIT), Vol. 6, No. 1, 2016
Standardized Usability Questionnaires: Features and Quality Focus
Ahlem Assila
1, 2, Káthia Marçal de Oliveira
1, Houcine Ezzedine
11 LAMIH UMR CNRS 8201F-59313, University of Valenciennes, France 2 SETIT, University of Sfax, BP 1175, 3038, Tunisia
{Ahlem.Assila, Kathia.Oliveira, Houcine.Ezzedine}@univ-valenciennes.fr
Abstract – For the last few decades more than twenty standardized usability questionnaires for evaluating software systems have been proposed. These instruments have been widely used in the assessment of usability of user interfaces. They have their own characteristics, can be generic or address specific kinds of systems and can be composed of one or several items. Some comparison or comparative studies were also conducted to identify the best one in different situations. All these issues should be considered while choosing a questionnaire. In this paper, we present an extensive review of these questionnaires considering their key features, some classifications and main comparison studies already performed. Moreover, we present the result of a detailed analysis of all items being evaluated in each questionnaire to indicate those that can identify users’ perceptions about specific usability problems. This analysis was performed by confronting each questionnaire item (around 475 items) with usability criteria proposed by quality standards (ISO 9421-11 and ISO/WD 9241-112) and classical quality ergonomic criteria.
Keywords – Human-Computer Interaction; user interfaces; evaluation; usability; Standardized questionnaire.
I.
I
NTRODUCTIONIt is common sense that usability evaluation has a great
importance on Human-Computer Interaction (HCI). When
talking about the usability evaluation, we address the
proposed methods and models of the evaluation.
Considering the large number of usability evaluation
methods, standardized usability questionnaires are
valuable tools intended for the assessment of perceived
usability [1]. By gathering user perceptions about user
interfaces, questionnaires can help to identify usability
flaws for making improvements and measure user
satisfaction [3]. In the literature, various standardized
usability questionnaires have been proposed (see [3]). To
choose the best one for each situation, it is important to
know information about their key features, composed
items, studies and classifications already performed. We
argue also that despite the fact the questionnaire is usually
defined to address general issues (usability and
usefulness), it is also relevant to identify which specific
issue they can capture about the user interface.
In light of this, we present in this paper a review of 24
standardized usability questionnaires by summarizing their
key features, the classifications and main comparison
studies already performed. We then emphasize a review of
the questionnaires according to specific related usability
criteria. To that end, an analysis of all the items was
performed against each usability criteria proposed from the
best known quality standards (ISO 9241-11 and ISO/WD
9241-112) and classical quality ergonomic criteria. Our
goal is to provide practitioners and HCI researchers useful
information that support them in selecting the appropriate
tool according to their requirements.
The remainder of this paper is structured as follows. In
section 2, we present briefly the fundamental usability
concepts. Then in section 3, we review the most validated
standardized usability questionnaires used for assessing
user interfaces based on the literature. In section 4, we
describe our analysis of the questionnaire items based on
common standard usability criteria. Subsequently, we
present a discussion. Finally, we provide a conclusion and
we draw some perspectives in section 5.
II.
U
SABILITYE
VALUATIONUsability evaluation has been defined and
well-studied. Preece et al. indicated that usability is a basic
concept in HCI and its main purpose is to make systems
easy to use and learn [9]. Over the last few decades,
several usability definitions concerning specific criteria
have been published in the HCI literature [10]. According
to Shackel usability is “
the capability to be used by
humans easily and effectively”
and
associated with five
criteria, i.e. effectiveness, learnability, retention, error and
attitude [12]. Another significant definition is given by
Schneiderman [13] who defined usability as
“a relation of
effectiveness and efficiency of user interface and user’s
reaction to that interface”
[13].
A similar usability definition, which differs only in
terminology, is stated by Nielsen [14] and includes five
criteria, i.e. efficiency, learnability, memorability,
errors/safety and satisfaction [15]. Other than these
definitions, several lists of design principles, heuristics,
ergonomic rules and measures for quality criteria have
been proposed [10]. These studies aimed to provide the
necessary guidelines and measures to be used for
evaluating user interfaces and identifying usability
problems.
Several international standards have also stated
usability definitions [19]. The ISO 9241-11 defined it as
“the extent to which a product can be used by specified
users to achieve specified goals with effectiveness,
efficiency and satisfaction in a specified context of use”
[19]. This definition associated three criteria
(effectiveness, efficiency and satisfaction). More recently,
the ISO/IEC
125010 [21] known as the SQUARE standard
(Systems and Software Quality Requirements and
Evaluation) has included the ISO 9241-11 usability issues
into a model characterized by five criteria, i.e.
effectiveness, efficiency, satisfaction, freedom from risk
and context coverage. In turn, these criteria have
separated into sub-criteria; for example the satisfaction
electronic Journal of Computer Science and Information Technology (eJCSIT), Vol. 6, No. 1, 2016
criterion, which includes usefulness, trust, pleasure and
comfort [21].
Despite these different ways of defining usability, there
is a common understanding that the scope of usability
includes the evaluation of effectiveness, efficiency,
satisfaction or the absence of usability problems [4].
Moreover, the evaluation can be classified as formative or
summative. According to Hartson et al. [22], formative
evaluation focuses on usability problems that need to be
solved during the prototype design stage before a final
design can be accepted for release; and, summative
evaluation is then conducted to evaluate the efficacy of
the final design or to compare competing design
alternatives in terms of usability.
Several research efforts have been undertaken to
perform HCI usability evaluation using subjective or
objective methods [23]. While objective methods are
based on capturing analytic data without direct interaction
with users, subjective evaluation methods are focused on
capturing user attitudes and judgments across the
perceived usability [25]. Some of the subjective methods
are interviews [27], focus groups [28], and questionnaires
(our focus in this paper). This last one is undoubtedly the
largest used subjective method since it is one of the least
expensive evaluation methods that can be used for
collecting data about the perceived usability of user
interfaces [8].
III.
R
EVIEW OFS
TANDARDIZEDU
SABILITYQ
UESTIONNAIRESA.
Panorama of standardized usability questionnaires
used on HCI evaluation
Questionnaires were introduced as a natural way to
discover issues related to users’ satisfaction ([14]).
Generally, standardized usability questionnaires have been
proposed to provide a more reliable measure of the
perceived usability ([1]). In this section, we present a
summary review of the most widely used and validated
standardized questionnaires in the evaluation of usability
of user interfaces.
We found 24 questionnaires based on the main digital
libraries (ACM, IEEE Xplore, Direct science, Elsevier, and
Springer Link), as follows:
Questionnaire for User Interface Satisfaction
(QUIS) [31]
Technology Acceptance Model
questionnaire (TAM) [32].
After-Scenario Questionnaire (ASQ) [33].
Computer System Usability Questionnaire
(CSUQ) [34]
Post-Study System Usability Questionnaire
(PSSUQ) [35].
Software Usability Measurement Inventory
(SUMI)([36])
System Usability Scale (SUS) [37]
Purdue Usability Testing Questionnaire (PUTQ)
[38]
Website Analysis Measurement Inventory
(WAMMI) [39]
Usefulness, Satisfaction and Ease of use (USE)
[40]
Expectation Ratings (ER) [41]
Website Usability Evaluation tool (WEBUSE)
[42]
Usability Magnitude Estimation (UME) [43]
Mobile Phone Usability Questionnaire (MPUQ)
[44]
Single Ease Question (SEQ) ([45])
Website Evaluation Questionnaire (WEQ) [46]
Subjective Mental Effort Question (SMEQ) [47]
Usability Metric for User Experience (UMUX)
[48]
Standardized Universal Percentile Rank
Questionnaire (SUPR-Q) ([5])
Design-oriented Evaluation of Perceived usability
(DEEP) [30]
Turkish-Computer System Usability Questionnaire
(T-CSUQ) [50]
Usability Metric for User Experience-LITE
(UMUX-LITE) [51]
Speech User Interface Service Quality
questionnaire (SUISQ) ([52])
Alternate Usability (AltUsability) [6]
Starting with the first questionnaire which appeared in the
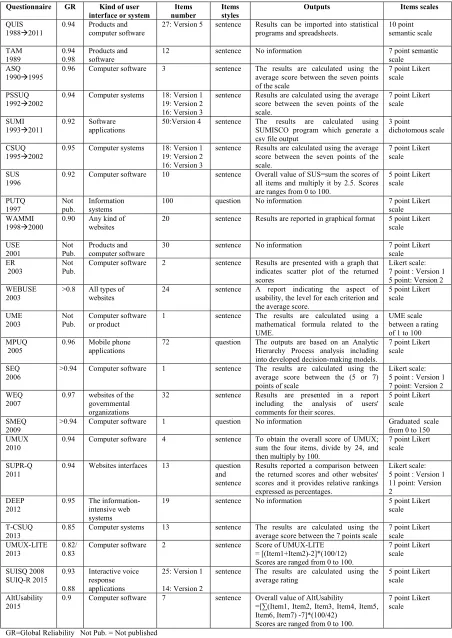
late 1980s, Table 1 shows the main characteristics of
standardized usability questionnaires considering:
(i)
The date of creation from first to last version of
questionnaire;
(ii)
Global reliability degree using coefficient alpha
2;
(iii)
Kind of interface or the software system with
which the questionnaire can be applied;
(iv)
Questionnaire items number;
(v)
The items styles (question and/or sentence);
(vi)
Questionnaire output; and
(vii)
Item scales (either Likert scale [54], Semantic
differential scale [55], etc.).
From this table, some notable conclusions can be made.
We note that 71% (17 from 24) of questionnaires can be
applied to the evaluation of all types of interfaces (e.g.
WIMP, Web, etc.) and they are addressed to computer
software in general. Seven questionnaires support the
evaluation of specific interfaces: five concern the web
applications; one (SUISQ) dedicated to interactive voice
response applications, and the last one (MPUQ) concerns
mobile applications. Regarding the degree of reliability, all
questionnaires have indicated good levels involving
Cronbach alpha scores varying between 0.80 and 0.97.
2 Coefficient alpha or Cronbach alpha: a fundamental element of
electronic Journal of Computer Science and Information Technology (eJCSIT), Vol. 6, No. 1, 2016
Table 1. Key Proprieties of Existing Standardized Usability Questionnaires
Questionnaire GR Kind of user interface or system
Items number
Items styles
Outputs Items scales
QUIS
19882011 0.94 Products computer software and 27: Version 5 sentence Results can be imported into statistical programs and spreadsheets. 10 point semantic scale TAM 1989 0.94 0.98 Products and software
12 sentence No information 7 point semantic scale
ASQ 19901995
0.96 Computer software 3 sentence The results are calculated using the average score between the seven points of the scale
7 point Likert scale PSSUQ
19922002 0.94 Computer systems 18: Version 1 19: Version 2 16: Version 3
sentence Results are calculated using the average score between the seven points of the scale.
7 point Likert scale SUMI
19932011
0.92 Software applications
50:Version 4 sentence The results are calculated using SUMISCO program which generate a csv file output
3 point
dichotomous scale CSUQ
19952002
0.95 Computer systems 18: Version 1 19: Version 2 16: Version 3
sentence Results are calculated using the average score between the seven points of the scale.
7 point Likert scale SUS
1996 0.92 Computer software 10 sentence Overall value of SUS=sum the scores of all items and multiply it by 2.5. Scores are ranges from 0 to 100.
5 point Likert scale PUTQ 1997 Not pub. Information systems
100 question No information 7 point Likert scale WAMMI
19982000
0.90 Any kind of websites
20 sentence Results are reported in graphical format 5 point Likert scale USE 2001 Not Pub. Products and computer software
30 sentence No information 7 point Likert scale ER
2003
Not Pub.
Computer software 2 sentence Results are presented with a graph that indicates scatter plot of the returned scores
Likert scale: 7 point : Version 1 5 point: Version 2 WEBUSE
2003
>0.8 All types of websites
24 sentence A report indicating the aspect of usability, the level for each criterion and the average score.
5 point Likert scale UME 2003 Not Pub. Computer software or product
1 sentence The results are calculated using a mathematical formula related to the UME.
UME scale between a rating of 1 to 100 MPUQ
2005
0.96 Mobile phone applications
72 question The outputs are based on an Analytic Hierarchy Process analysis including into developed decision-making models.
7 point Likert scale SEQ
2006
>0.94 Computer software 1 sentence The results are calculated using the average score between the (5 or 7) points of scale
Likert scale: 5 point : Version 1 7 point: Version 2 WEQ
2007
0.97 websites of the governmental organizations
32 sentence Results are presented in a report including the analysis of users' comments for their scores.
5 point Likert scale SMEQ
2009
>0.94 Computer software 1 question No information Graduated scale from 0 to 150 UMUX
2010
0.94 Computer software 4 sentence To obtain the overall score of UMUX; sum the four items, divide by 24, and then multiply by 100.
7 point Likert scale SUPR-Q
2011
0.94 Websites interfaces 13 question and sentence
Results reported a comparison between the returned scores and other websites' scores and it provides relative rankings expressed as percentages.
Likert scale: 5 point : Version 1 11 point: Version 2
DEEP 2012
0.95 The information-intensive web systems
19 sentence No information 5 point Likert scale T-CSUQ
2013
0.85 Computer systems 13 sentence The results are calculated using the average score between the 7 points scale
7 point Likert scale UMUX-LITE
2013
0.82/ 0.83
Computer software 2 sentence Score of UMUX-LITE = [(Item1+Item2)-2]*(100/12) Scores are ranged from 0 to 100.
7 point Likert scale SUISQ 2008 SUIQ-R 2015 0.93 0.88 Interactive voice response applications
25: Version 1 14: Version 2
sentence The results are calculated using the average rating
5 point Likert scale AltUsability
2015
0.9 Computer software 7 sentence Overall value of AltUsability
=[∑(Item1, Item2, Item3, Item4, Item5, Item6, Item7) -7]*(100/42)
Scores are ranged from 0 to 100.
7 point Likert scale
electronic Journal of Computer Science and Information Technology (eJCSIT), Vol. 6, No. 1, 2016
The majority of questionnaires (17 from 24) have very
high levels of reliability ranging between 0.9 and 0.97,
while three questionnaires have levels less than 0.90 and
four other (PUTQ, USE, ER and UME) are validated
without their precise Cronbach alpha values. WEQ has the
highest level equal to 0.97. However, this questionnaire is
dedicated only to the evaluation of web interfaces. The
second highest level of reliability concerns MPUQ (0.96).
It also represents the only specific standardized
questionnaire for mobile applications. Nevertheless, it has
a large number of items (i.e. 72). In fact, we note also that
the two questionnaires ASQ and CSUQ have high levels
of reliability equal to 0.96 and 0.95, respectively. These
questionnaires are characterized by a reduced number of
items compared to others equal to 3 and 19, respectively.
Furthermore, SUMI and QUIS indicated high reliability
levels equal to 0.94 and 0.92, respectively.
Regarding the outputs of the questionnaires, different
presentations of results have been proposed (e.g. graphic
form, number, spreadsheets, and CSV files). Furthermore,
there are various ways for calculating the results that
depend on questionnaire scales such as the averaging
method used by questionnaires which adopted Likert
scales, the SUMISCO analysis program used by SUMI
questionnaire, etc. Regarding scales used by
questionnaires, the Likert scale represents the most
common method that characterizes the majority of
questionnaires. This scale was adopted by 80% of
questionnaires using a variety of points (3, 5, 7, 10 or 11),
whereas 20% of questionnaires are focused on other types
of scales, such as dichotomous scale (e.g. SUMI) and
semantic scale (e.g. QUIS).
Moreover, some other questionnaires have also been
proposed. Those are used under different evaluation
contexts for the evaluation of software systems and
products. For instance, AttrackDiff [57] is an instrument
to evaluate numerous aspects of the user experience such
as the attraction to a product through the technique of
word pairs. The Service User experience is another
questionnaire used to assess the capabilities of modern
web services in promoting and supporting a positive and
engaging user experience [58]. As proposed by
McNamara and Kirakowski [59], the Consumer Products
Questionnaire allows measuring user-satisfaction with
electronic consumer products.
More recently, Lewis and Mayes [60] have introduced
the Emotional Metric Outcomes (EMO) questionnaire as a
standardized instrument for assessing the emotional
outcomes. It aims specifically to measure the effect of
customer interaction, either with human or digital
services. Nevertheless, it concerns a more specific
measurement context (large sample unmoderated usability
study). New research has recommended the use of EMO
questionnaire under the user experience as a measurement
that can complement the existing standardized usability
questionnaires ([7]).
B.
Existing classifications of standardized usability
questionnaires
A recent survey [3] about the widely used standardized
usability questionnaires in the HCI literature divided them
into three categories: the post-study questionnaires, the
post-task questionnaires, and website usability
questionnaires.
The post-study questionnaires (first
category) are used at the end of a study especially after
completing a set of test scenarios. The post-task
questionnaires (second category) are for a more contextual
evaluation used immediately at the end of each task or
scenario in a usability study. The last category included
specific questionnaires dedicated to evaluating web
applications such as WAMMI, SUPR-Q [3]. Among the
best known post-study questionnaires, we found QUIS,
SUMI, PSSUQ and SUS [3]. With regard to the post-task
questionnaires, we found ASQ, SEQ, SMEQ, ER and
UME [3].
Another significant work that includes a review of
standardized usability questionnaires was presented by
Yang et al. [30]. They identified three types of
questionnaires depending on the kind of the evaluated
system. It concerns universal perceived usability
questionnaires, perceived usability questionnaires for
websites, and perceived usability questionnaires for mobile
applications. Universal questionnaires have included those
applicable to assess any type of electronic products (e.g.
USE, CSUQ, TAM, QUIS, SUS, and PUTQ). However,
the two other types are specific to questionnaires for
assessing websites (e.g. WAMMI) and mobile applications
(e.g. MPUQ), respectively. We have classified the 24
standardized questionnaires found in the literature
according to both categories as presented in Table 2.
Henceforth, we use the term “specific standardized
usability questionnaires” to refer to the questionnaires
specific for mobile, website or other specific kinds of
applications (as the case of SUISQ/ SUIQ-R questionnaire
which concerns interactive voice response applications)
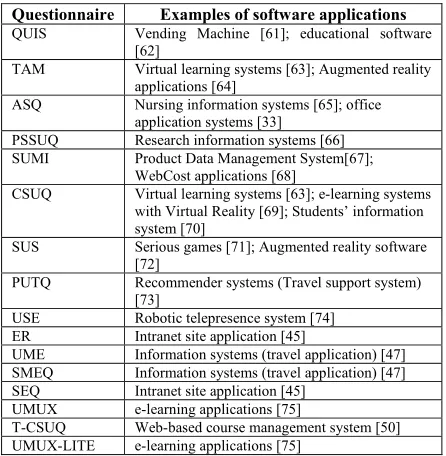
presented in Table 2. As shown in the table, we found in
total 17 universal questionnaires which have been applied
in the usability evaluation of several kinds of software
applications. Some examples of those are presented in
Table 3.
C.
Comparing standardized usability questionnaires
When reviewing the HCI literature, we found some
studies that have conducted direct comparisons between
various standardized usability questionnaires [3]. These
studies have concerned only nine universal
questionnaires, which are SUS, QUIS, CSUQ, UMUX,
UMUX-Lite, AltUsability, SEQ, UME and SMEQ.
electronic Journal of Computer Science and Information Technology (eJCSIT), Vol. 6, No. 1, 2016
Table 2. Classifications of Questionnaires
Questionnaire Questionnaires based on Yang et al. classification [30]
Questionnaires based on Sauro and Lewis classification [3]
Universal For Website For Mobile Post-study Post-task For Website
QUIS X X
TAM X X
ASQ X X
PSSUQ X X
SUMI X X
CSUQ X X
SUS X X
PUTQ X X
WAMMI X X
USE X X
ER X X
WEBUSE X X
UME X X
MPUQ X X
WEQ X X
SMEQ X X
SEQ X X
UMUX X X
SUPR-Q X X
DEEP X X
T-CSUQ X X
UMUX-LITE X X
SUISQ/ SUIQ-R X
AltUsability X X
Total number 17 (from 24) 5 (from 24) 1 (from 24) 14 (from 24) 5 (from 24) 5 (from 24)
Table 3. Examples of Software Applications that have Applied Universal Questionnaires
Questionnaire Examples of software applications QUIS Vending Machine [61]; educational software
[62]
TAM Virtual learning systems [63]; Augmented reality applications [64]
ASQ Nursing information systems [65]; office application systems [33]
PSSUQ Research information systems [66] SUMI Product Data Management System[67];
WebCost applications [68]
CSUQ Virtual learning systems [63]; e-learning systems with Virtual Reality [69]; Students’ information system [70]
SUS Serious games [71]; Augmented reality software [72]
PUTQ Recommender systems (Travel support system) [73]
USE Robotic telepresence system [74] ER Intranet site application [45]
UME Information systems (travel application) [47] SMEQ Information systems (travel application) [47] SEQ Intranet site application [45]
UMUX e-learning applications [75]
T-CSUQ Web-based course management system [50] UMUX-LITE e-learning applications [75]
In the study conducted by Tullis and Stetson [76] for
assessing the usability of websites, SUS was compared
with four questionnaires (QUIS, CSUQ,
Words
3, and Ours
4). The reported analysis results have
shown that SUS was the fastest questionnaire to converge
on the correct conclusion and also, it has reliable results
across all used sample sizes. Furthermore, two recent
studies ([6]) have investigated the correlation between
SUS and other
questionnaires. The first compared SUS
with UMUX-LITE and AltUsability, and the second
compared SUS with UMUX and UMUX-LITE.
As a consequence, the results of the two studies
reported high correlation and correspondences between
them (for more details see ([6]). Two other significant
comparative studies are reported by Tedesco and Tullis
[45] and Sauro and Dumas [47]. Those studies have
concerned the five post-task standardized usability
questionnaires [3]. In these studies, authors have focused
on determining the most sensitive questionnaire by
measuring their sensitivities.
5In the study conducted by Tedesco and Tullis [45], five
questionnaires (V1, V2, ASQ, ER and
SEQ-V3) were compared. Analysis has shown good results for
all questionnaires with the larger sample size. However, it
showed that SEQ-V1 was more sensitive using the smaller
samples sizes [45]. In the second study, Sauro and Dumas
compared SEQ with the two questionnaires SMEQ and
UME. Using small samples sizes (< 5), analyses indicated
3 Adapted from Microsoft’s Product Reaction Cards [77] 4 Questionnaire for assessing website usability [76]
5 The capability of a standardized usability questionnaire to indicate
electronic Journal of Computer Science and Information Technology (eJCSIT), Vol. 6, No. 1, 2016
that questionnaires were insensitive with a very little
difference between them. For sample sizes greater than
five, results revealed that SMEQ had the best percentage
of significant t-tests but was nevertheless insufficient
([3]). These two studies used both SMEQ and SEQ ([47]).
We may conclude that the two studies [6] and [76]
consolidated the use of UMUX, UMUX-LITE, and Alt
Usability in addition to SUS. We could also say that both
SEQ and SMEQ may be more useful than the other post–
task questionnaires since they are more sensitive
compared to ASQ, ER and UME ([47]).
However, we note that the other questionnaires listed in
Table 1 have not been addressed in comparison studies.
We argue that more comparisons between questionnaires
are needed, considering not only direct comparisons or
sensitivity measures but also quality issues treated by the
questionnaires for supporting the choice of the most
adequate one.
D.
Existing quality issues of standardized usability
questionnaires
By analyzing the standardized usability questionnaires,
we identified that they explicitly identify different quality
issues. In some papers, these issues mean quality criteria
(such as satisfaction, usability, efficiency). In others, they
correspond to features of the user interface (such as screen
factors, links, layout, etc.). We identify each of these
issues as summarized in Tables 4 and 5. The first table
concerns universal questionnaires and the second includes
the specific questionnaires.
As shown in Table 4, we found in total 30 existing
quality issues of universal usability questionnaires. We
note also from this table that the following quality issues
(system usefulness, usability, overall ease of task
completion and overall system) are the most frequent
criteria considered by the questionnaires. Those criteria
concern general issues of quality. For example, the CSUQ
questionnaire deals with four general criteria: overall
system, system usefulness, information quality, and
interface quality.
Furthermore, we note that some questionnaires have
focused on measuring more specific issues including
PUTQ, SUMI and AltUsability. PUTQ covered eight
issues (compatibility, learnability, consistency, flexibility,
minimal action, minimal memory load, perceptual
limitation and user guidance), but has 100 items, being the
longest instrument we found. SUMI is the second longest
instrument with 50 items. It covers five issues of quality
(learnability, efficiency, affect, helpfulness, control).
Practitioners and researchers should pay attention if the
big number of items in a questionnaire can affect user
opinions before performing evaluation [30]. AltUsability
[6] is a recent instrument focus on more specific issues of
usability (EasyNav, AbleFind, familiar, need, efficient,
control and appeal).
We observe also that ER, SMEQ and SEQ are the
shortest questionnaires (with only 1 item) that only cover
a general issue concerns overall ease of task completion.
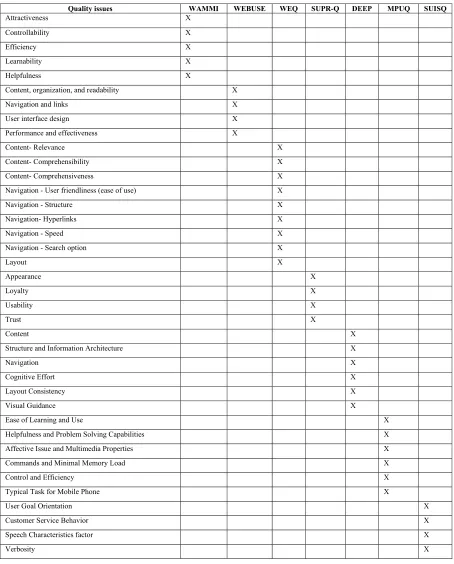
Concerning specific usability questionnaires, we can see
from Table 5 that they cover 38 quality issues. However,
we found that not all of them are different; in fact, these
issues can vary in terms of the terminologies used (e.g.
learnability (WAMMI) and ease of learning (MPUQ)).
We distinguished that some questionnaires concern
general quality issues, for example we quote SUPR-Q,
which covers four issues including usability and
appearance. Some others are addressed more specifically.
As an example, we note that Navigation related to DEEP
questionnaire is restrained by WEQ questionnaire as a
function of five sub-criteria (user friendliness, structure,
hyperlinks, speed and search option). Some other
questionnaires have combined sub-criteria into a single
criterion as is the cases of WEBUSE (content,
organization and readability), DEEP (Structure and
Information Architecture), and MPUQ (Control and
Efficiency, Ease of Learning and Use).
We can conclude that, although the literature indicates
several quality issues that are addressed by the
questionnaires, the majority of them are related to general
issues and do not explicitly state which item covers the
quoted quality issues to better support decision-making.
Moreover, it should be interesting to make these quality
issues uniform by traditional quality criteria defined by
standards and known guidelines. Believing that a detailed
analysis of items of questionnaires is essential to better
support the choice of a questionnaire that addresses better
the quality requirements of the specific system being
evaluated, we analyzed the 24 usability questionnaires
against known quality criteria as presented in next section.
IV.
A
NALYSIS OF STANDARDIZED USABILITY QUESTIONNAIRES BASED ON COMMON STANDARDUSABILITY CRITERIA
A. Assila, K. de Oliveira and H. Ezzedine, Standardized Usability Questionnaires: Features and Quality Focus
21
Table 4. Quality Issues of Universal Standardized Usability Questionnaires
Quality issues QUIS TAM PSSUQ / CSUQ
AltUsa bility
T-CSUQ
SUMI SUS PUTQ USE UMUX UMUX-LITE
ASQ ER UME SMEQ SEQ
Satisfaction X X
Overall reaction to the software / Overall system
X X X X
Screen factors X
Terminology and system information
X
(Ease of) Learning factors / (Learnability )
X X X X X
System capabilities X
Ease of use / Usability X X X X
System usefulness X X X X X X
Information quality X X X
Interface quality X X X
Efficiency/ Efficient X X X
Affect X
Helpfulness X
Control X X
Compatibility X
Consistency X
Flexibility X
Minimal action X
Minimal memory load X
Perceptual limitation X
User guidance X
Effectiveness X
Overall ease of task completion
X X X X X
Satisfaction with completion time
X
Satisfaction with support information
X
Easy Navigation X
Able Find X
Familiar X
Need X
Table 5. Quality Issues of Specific Standardized Usability Questionnaires
Quality issues WAMMI WEBUSE WEQ SUPR-Q DEEP MPUQ SUISQ
Attractiveness X
Controllability X
Efficiency X
Learnability X
Helpfulness X
Content, organization, and readability X
Navigation and links X
User interface design X
Performance and effectiveness X
Content- Relevance X
Content- Comprehensibility X
Content- Comprehensiveness X
Navigation - User friendliness (ease of use) X
Navigation - Structure X
Navigation- Hyperlinks X
Navigation - Speed X
Navigation - Search option X
Layout X
Appearance X
Loyalty X
Usability X
Trust X
Content X
Structure and Information Architecture X
Navigation X
Cognitive Effort X
Layout Consistency X
Visual Guidance X
Ease of Learning and Use X
Helpfulness and Problem Solving Capabilities X
Affective Issue and Multimedia Properties X
Commands and Minimal Memory Load X
Control and Efficiency X
Typical Task for Mobile Phone X
User Goal Orientation X
Customer Service Behavior X
Speech Characteristics factor X
electronic Journal of Computer Science and Information Technology (eJCSIT), Vol. 6, No. 1, 2016
Table 6. Existing Standardized Usability Criteria for Assessing User Interfaces
ISO 9241-11 [19]
Scapin and Bastien / AFNOR ergonomic criteria [17]
ISO/WD 9241-112 [78]
Effectiveness Efficiency Satisfaction
Guidance (prompting , grouping and distinguishing items, immediate feedback, legibility)
Workload (brevity, information density) Explicit control (explicit user actions, user control) Adaptability (flexibility, users’ experience) Error management (error protection, quality of error messages, error correction)
Consistency Significance of codes Compatibility
Detectability Discriminability Appropriateness Consistency Comprehensibility
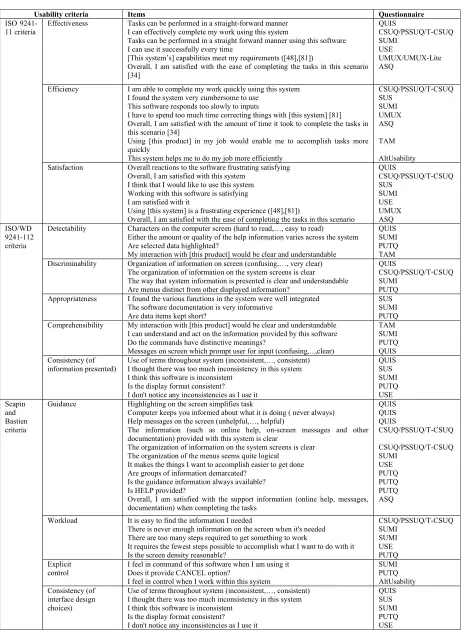
Based on these criteria we performed an analysis of all
questionnaires with the goal to specify clearly which
usability criteria of the three groups are covered and are
not covered by the standardized questionnaires. About
475 questionnaires items have been analyzed according to
the selected lists of usability criteria.
A.
Analysis results for universal standardized usability
questionnaires
For each questionnaire, we have followed a detailed
analysis per item against criteria list for the three groups.
We have mainly relied on the meaning of the item to
associate to each usability criterion it is more related to.
For example, the following item
“I can effectively
complete my work using this system”
(extracted from
CSUQ questionnaire) is more related to the effectiveness
criterion. We used this process to analyze all items of the
questionnaires. Therefore, we present the results in Table
7 that show the analysis results performed for the
universal questionnaires. Nevertheless, we have excluded
four questionnaires (SEQ, SMEQ, ER, and UME) since
they contain only one item that concerns the criterion of
overall ease of task completion. Table 8 presents some
examples of items of our analysis per criterion.
We are aware that some criteria are usually interrelated
and that some items are related to several criteria. For
example, we assigned the following item:
“The
organization of information on the system screens is
clear”
(extracted from CSUQ, PSSUQ, and T-CSUQ) to
both criteria: discriminability and guidance (see Table 8).
A second item example,
“Do the commands have
distinctive meanings?”
(extracted from PUTQ) is related
to both criteria of comprehensibility of information
presented and the significance of codes.
B.
Analysis results for specific standardized usability
questionnaires
Following the same analysis process per item as described
previously, we have analyzed all items of specific
standardized usability questionnaires. For example, we
assigned the following item from the MPUQ
questionnaire:
“Are the error messages effective in
assisting you to fix problems?”
to the error management
criterion.
As an exception, we have excluded the SUISQ
of our analysis, due to its more specific criteria for
interactive voice response applications. It concerns more
the usability of service quality and addressed several
criteria (friendliness, politeness of the system, speaking
pace, use of familiar terms, naturalness, enthusiasm of the
system voice, talkativeness and repetitiveness of the
system). As a conclusion, analysis results are synthesized
in Table 9. Further, we have presented in Table 10 some
examples of items per criterion.
C.
Discusssion
The majority of the most used standardized usability
questionnaires (e.g. SUMI, SUS, QUIS, CSUQ, etc.)
covered general quality issues. The goal of this analysis
was to provide practitioners some support about the
specific usability criteria covered by the items of these
questionnaires. This identification can be useful to select
the appropriate questionnaire according to the quality
requirements of the system. As shown in Tables 7 and 9,
these analyses have identified specific usability criteria
covered by universal and specific usability questionnaires.
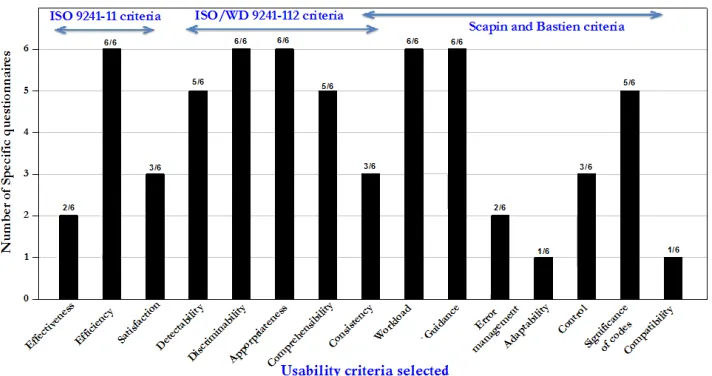
We note that the majority of universal questionnaires
cover more than 6 of 15 usability criteria (see Figure 1).
For example, we found that the five issues addressed by
SUMI cover all mentioned usability criteria.
electronic Journal of Computer Science and Information Technology (eJCSIT), Vol. 6, No. 1, 2016
A. Assila, K. de Oliveira and H. Ezzedine, Standardized Usability Questionnaires: Features and Quality Focus
Table 7. Analysis Results for Universal Standardized Usability Questionnaires
Usability criteria QUIS TAM PSSUQ CSUQ AltUsability T-CSUQ SUMI SUS PUTQ USE UMUX UMUX-Lite ASQ
ISO 9421-11
criteria
Effectiveness X X X X X X X X X
Efficiency X X X X X X X X X
Satisfaction X X X X X X X X X
ISO/WD 9241-112 criteria
Detectability X X X X
Discriminability X X X X X X
Appropriateness X X X X
Consistency X X X X X
Comprehensibility X X X X
Scapin and Bastien criteria
Guidance X X X X X X X X
Workload X X X X X X
Explicit control X X X
Adaptability X X X X X X
Error management X X X X X X X
Consistency X X X X X
Significance of codes X X X
electronic Journal of Computer Science and Information Technology (eJCSIT), Vol. 6, No. 1, 2016
Table 8. Item Examples of Universal Usability Questionnaires as a Function of Standard Usability Criteria
Usability criteria Items Questionnaire
ISO 9241-11 criteria
Effectiveness Tasks can be performed in a straight-forward manner I can effectively complete my work using this system
Tasks can be performed in a straight forward manner using this software I can use it successfully every time
[This system’s] capabilities meet my requirements ([48],[81])
Overall, I am satisfied with the ease of completing the tasks in this scenario [34] QUIS CSUQ/PSSUQ/T-CSUQ SUMI USE UMUX/UMUX-Lite ASQ
Efficiency I am able to complete my work quickly using this system I found the system very cumbersome to use
This software responds too slowly to inputs
I have to spend too much time correcting things with [this system] [81] Overall, I am satisfied with the amount of time it took to complete the tasks in this scenario [34]
Using [this product] in my job would enable me to accomplish tasks more quickly
This system helps me to do my job more efficiently
CSUQ/PSSUQ/T-CSUQ SUS SUMI UMUX ASQ TAM AltUsability Satisfaction Overall reactions to the software frustrating satisfying
Overall, I am satisfied with this system I think that I would like to use this system Working with this software is satisfying I am satisfied with it
Using [this system] is a frustrating experience ([48],[81])
Overall, I am satisfied with the ease of completing the tasks in this scenario
QUIS CSUQ/PSSUQ/T-CSUQ SUS SUMI USE UMUX ASQ ISO/WD 9241-112 criteria
Detectability Characters on the computer screen (hard to read,…, easy to read) Either the amount or quality of the help information varies across the system Are selected data highlighted?
My interaction with [this product] would be clear and understandable
QUIS SUMI PUTQ TAM Discriminability Organization of information on screen (confusing,…, very clear)
The organization of information on the system screens is clear The way that system information is presented is clear and understandable Are menus distinct from other displayed information?
QUIS
CSUQ/PSSUQ/T-CSUQ SUMI
PUTQ Appropriateness I found the various functions in the system were well integrated
The software documentation is very informative Are data items kept short?
SUS SUMI PUTQ Comprehensibility My interaction with [this product] would be clear and understandable
I can understand and act on the information provided by this software Do the commands have distinctive meanings?
Messages on screen which prompt user for input (confusing,...,clear)
TAM SUMI PUTQ QUIS Consistency (of information presented)
Use of terms throughout system (inconsistent,…, consistent) I thought there was too much inconsistency in this system I think this software is inconsistent
Is the display format consistent? I don't notice any inconsistencies as I use it
QUIS SUS SUMI PUTQ USE Scapin and Bastien criteria
Guidance Highlighting on the screen simplifies task
Computer keeps you informed about what it is doing ( never always) Help messages on the screen (unhelpful,…, helpful)
The information (such as online help, on-screen messages and other documentation) provided with this system is clear
The organization of information on the system screens is clear The organization of the menus seems quite logical
It makes the things I want to accomplish easier to get done Are groups of information demarcated?
Is the guidance information always available? Is HELP provided?
Overall, I am satisfied with the support information (online help, messages, documentation) when completing the tasks
QUIS QUIS QUIS CSUQ/PSSUQ/T-CSUQ CSUQ/PSSUQ/T-CSUQ SUMI USE PUTQ PUTQ PUTQ ASQ Workload It is easy to find the information I needed
There is never enough information on the screen when it's needed There are too many steps required to get something to work
It requires the fewest steps possible to accomplish what I want to do with it Is the screen density reasonable?
CSUQ/PSSUQ/T-CSUQ SUMI SUMI USE PUTQ Explicit control
I feel in command of this software when I am using it Does it provide CANCEL option?
I feel in control when I work within this system
SUMI PUTQ AltUsability Consistency (of interface design choices)
Use of terms throughout system (inconsistent,…, consistent) I thought there was too much inconsistency in this system I think this software is inconsistent
Is the display format consistent? I don't notice any inconsistencies as I use it
electronic Journal of Computer Science and Information Technology (eJCSIT), Vol. 6, No. 1, 2016
Table 8 (cont.). Item Examples of Universal Usability Questionnaires as a Function of Standard Usability Criteria
Usability criteria Items Questionnaire
Adaptability Experienced and inexperienced users' needs are taken into consideration It is obvious that user needs have been fully taken into consideration It is easy to make the software do exactly what you want
I would find it easy to get [this product] to do what I want it to do. I would find [this product] to be flexible to interact with It is flexible
Both occasional and regular users would like it Does system provide good training for different users? Can user name displays and elements according to their needs? This system offers capabilities familiar to me
QUIS SUMI SUMI TAM TAM USE USE PUTQ PUTQ AltUsability Error
management
Error messages (unhelpful,…, helpful) /Correcting your mistakes difficult The system gives error messages that clearly tell me how to fix problems Whenever I make a mistake using the system, I recover easily and quickly Error messages are not adequate
I can recover from mistakes quickly and easily Are erroneous entries displayed?
Are error messages non-disruptive/informative?
QUIS
CSUQ/PSSUQ/T-CSUQ CSUQ/PSSUQ/T-CSUQ SUMI
USE PUTQ PUTQ Significance of codes Computer terminology is related to the task you are doing
I sometimes wonder if I am using the right function Are the command names meaningful?
Do the commands have distinctive meanings?
QUIS SUMI PUTQ PUTQ Compatibility The software hasn't always done what I was expecting
Is the control of cursor compatible with movement?
Are the results of control entry compatible with user expectations?
SUMI PUTQ PUTQ
Table 9. Analysis Results for the Specific Standardized Usability Questionnaires
Usability criteria WAMMI WEBUSE WEQ SUPR-Q DEEP MPUQ
ISO 9421-11 criteria
Effectiveness X X
Efficiency X X X X X X
Satisfaction X X X
ISO/WD 9241-112 criteria
Detectability X X X X X
Discriminability X X X X X X
Appropriateness X X X X X X
Consistency X X X
Comprehensibility X X X X X
Scapin and Bastien criteria
Guidance X X X X X X
Workload X X X X X X
Consistency X X X
Explicit control X X X
Adaptability X
Error management X X
Significance of codes X X X X X
electronic Journal of Computer Science and Information Technology (eJCSIT), Vol. 6, No. 1, 2016
Table 10. Item Examples of Specific Usability Questionnaires as a Function of Standard Usability Criteria
Usability criteria Items Questionnaire
ISO 9241-11 criteria
Effectiveness It is efficient to use this website.
Does the product support the operation of all the tasks in a way that you find useful?
WEBUSE MPUQ Efficiency I need not wait too long to download a file or open a page
I think it takes a long time to download a new web page from this site. I am able to find what I need quickly on this website
I could quickly get to know the structure of the website by skimming its home page. Does this product enable the quick, effective, and economical performance of tasks?
WEBUSE WEQ SUPR-Q DEEP MPUQ Satisfaction I don't like using this website
I enjoy using the website
Do you feel excited when using this product?
WAMMI SUPR-Q MPUQ ISO/WD 9241-112 criteria
Detectability This website helps me find what I am looking for Reading content at this website is easy
Placement of links or menu is standard throughout the website and I can easily recognize them
It is clear which hyperlink will lead to the information I am looking for. The wording of the text was clear.
The highlighted areas of a page helped me locate the information I needed Are the characters on the screen easy to read?
WAMMI WEBUSE WEBUSE WEQ DEEP DEEP MPUQ Discriminability This website seems logical to me.
The content of this website is well organized I find the structure of this website clear The website has a clean and simple presentation
Under each section of the website, the web pages were well organized. Is the organization of information on the product screen clear?
WAMMI WEBUSE WEQ SUPR-Q DEEP MPUQ Appropriateness I can quickly find what I want on this website.
I can easily find what I want at this website I find the information in this website precise The information on this website is valuable
It was easy to find the information I needed on the website Is the amount of information displayed on the screen adequate?
WAMMI WEBUSE WEQ SUPR-Q DEEP MPUQ Comprehensibility Everything on this website is easy to understand
I am comfortable and familiar with the language used I find the information in this website easy to understand
The content (including text, pictures, audios, and videos etc.) was easy to understand Is the interface with this product clear and understandable?
WAMMI WEBUSE WEQ DEEP MPUQ Consistency (of information presented)
This website has a consistent feel and look
The layout under each section of the website was consistent Is the data display sufficiently consistent?
WEBUSE DEEP MPUQ Scapin and Bastien criteria
Guidance This website helps me find what I am looking for.
This website always provides clear and useful messages when I don’t know how to proceed
I can easily know where I am at this website I always know where I am on this website The website has a clean and simple presentation This website helped me find what I was looking for
Is the backlighting feature for the keyboard and screen helpful?
WAMMI WEBUSE WEBUSE WEQ SUPR-Q DEEP MPUQ Workload I can quickly find what I want on this website
I can easily find what I want at this website I find the information in this website precise The information on this website is valuable
It was easy to find the information I needed on the website Are data items kept short?
WAMMI WEBUSE WEQ SUPR-Q DEEP MPUQ Explicit control I feel in control when I'm using this website.
It is easy to move around at this website by using the links or back button of the browser
Can you regulate, control, and operate the product easily?
WAMMI WEBUSE MPUQ Consistency (of interface design choices)
This website has a consistent feel and look
The layout under each section of the website was consistent Is the data display sufficiently consistent?
WEBUSE DEEP MPUQ Adaptability Have the user needs regarding this product been sufficiently taken into
consideration?
MPUQ
Error management This website does not contain too many web advertisements
Are the messages aimed at prevent you from making mistakes adequate? Are the error messages effective in assisting you to fix problems?
WEBUSE MPUQ MPUQ Significance of codes I get what I expect when I click on things on this website
I am comfortable and familiar with the language used I find many words in this website difficult to understand I got what I expected when I clicked on things on this website Are the command names meaningful?
electronic Journal of Computer Science and Information Technology (eJCSIT), Vol. 6, No. 1, 2016
Figure 1. Universal standardized Usability Questionnaire: Quality issues and Usability Criteria
electronic Journal of Computer Science and Information Technology (eJCSIT), Vol. 6, No. 1, 2016
Figure 3. Number of Universal Questionnaires by Usability Criteria
Figure 4. Number of Specific Questionnaires by Usability Criteria
V.
C
ONCLUSION AND NEW PERSPECTIVESIn this paper, our purpose was to review existing
standardized usability questionnaires to give more support
to practitioners and researchers when choosing
appropriate usability questionnaires. These questionnaires
have been standardized as a function of their reliability
and validity measures and compared on the basis of their
sensitivity degrees. The similarity of these measures
cannot provide the support required to select
questionnaires. Furthermore, general quality issues
characterizing these questionnaires make difficult their
use for detecting users’ perceptions about specific
usability problems. In this review, we have focused on
studying questionnaires’ items based on the main known
usability criteria in literature. We emphasize some
perspectives for further research about usability
questionnaires.
To improve these instruments and make them more useful
in the detection of usability problems, it is essential to
provide more support in the interpretation of their results.
With the advancement of technology, intelligent support
proved to be very interesting. Technologies such as expert
systems, knowledge-based systems or agents should be
explored in this direction.
The use of questionnaires can be complemented by
several usability methods (such as, inspection methods,
simulation) to perform a complete usability evaluation.
Several research works also share our perspective. They
have largely recommended and investigated the
combination of several usability evaluation methods. We
are currently working on the integration of questionnaires
with objective usability measures extracted from different
evaluation methods such as task completion, overall
density of a user interface, etc.
electronic Journal of Computer Science and Information Technology (eJCSIT), Vol. 6, No. 1, 2016
adaptable for evaluating new kinds of interactive systems
(e.g. ubiquitous systems, tangible systems).
R
EFERENCES[1] K. Hornbæk, “Current practice in measuring usability: Challenges to usability studies and research,” International Journal of Human-Computer Studies, vol. 64, no. 2, 2006, pp.79–102.
[2] J.R. Lewis, and J.Sauro, “The factor structure of the System Usability Scale,” in: M. Kurosu,(Ed.), Human Centered Design, HCII 2009 Springer-Verlag, Heidelberg, Germany, 2009,pp. 94-103.
[3] J. Sauro, and J. R. Lewis, “Quantifying the User Experience Practical Statistics for User Research,”Elsevier, 2012, ISBN: 978-0-12-384968-7.
[4] J. R. Lewis, “Usability: Lessons Learned . . . and Yet to Be Learned,” International Journal of Human-Computer Interaction, vol. 30, no. 9, 2014, pp. 663–684.
[5] J. Sauro, “SUPR-Q: A Comprehensive Measure of the Quality of the Website User Experience,” Journal of usability studies, vol.10 , no. 2, 2015, pp. 68-86.
[6] J. R. Lewis, B.S. Utesch, and D.E. Maher, “Measuring Perceived Usability: The SUS, UMUX-LITE, and AltUsability,” International Journal of Human-Computer Interaction, vol.31, no.8, 2015, pp.496-505.
[7] J. R. Lewis, J. Brown, and D.K. Mayes, “Psychometric Evaluation of the EMO and the SUS in the context of a Large-Sample Unmoderated Usability study,” International Journal of Human-Computer Interaction, vol.31, no.8, 2015, pp. 445-553.
[8] K. Hamborg, B. Vehse, and H. Bludau, “Questionnaire based usability evaluation of hospital information systems,” Electronic journal of Information Systems Evaluation,vol. 7, no.1, 2004, pp.21–30.
[9] J. Preece, Y. Rogers, H. Sharp, D. Benyon, S. Holland, and T.Carey, “Human-Computer Interaction,” Essex, England: Addison-Wesley Longman Limited, 1994.
[10] A.Seffah, M.Donyaee, R. Kline, and H. Padda, “Usability measurement and metrics : A consolidated model,”Software Quality Journal, vol.14, no.2, 2006,pp. 159-178.
[11] D.Alonso-Rios, A. Vazquez-Garcia,E. Mosqueira-Rey, and V.Moret-Bonillo, “Usability: A critical analysis and taxonomy,” International Journal of Human-Computer Interaction, vol.26,2010, pp.53-74
[12] B.Shackel,“Usability–context,framework,design and evaluation,”in B.Shackel, and S. Richardson,(eds.): Human Factors for Informatics Usability, Cambridge University Press, Cambridge, 1991, pp. 21-38.
[13] B. Shneiderman, “Designing the user interface (2nd edition): strategies for effective human computer interaction,”Addison-Wesley Longman Publishing Corporation, Inc., Boston, MA, USA, 1992.
[14] J. Nielsen, “Usability engineering,”Academic Press, Boston, 1993. [15] M. van Welie, G. van der Veer, and A. Eliens, “Breaking down
Usability,” in M. Sasse and C. Johnson, eds: Proceedings of INTERACT 99’, Edinburgh, Scotland, 1999, pp. 613–620. [16] J. Nielsen, “Usability laboratories [Special issue],” Behavior and
Information Technology, vol. 13, 1994.
[17] D. L. Scapin, and J. M.C.Bastien, “Ergonomic criteria for evaluating the ergonomic quality of interactive systems,” Behaviour and Information Technology, vol.16, 1997, pp. 220-231. [18] B.Shneiderman, “Tree maps for space-constrained visualization of hierarchies,”Human Computer Interaction Lab, University of Maryland,1998.
[19] ISO 9241-11, “Ergonomic requirements for office work with visual display terminals (VDT)s- Part 11 Guidance on usability,” 1998. [20] ISO/IEC 9126-1, “Software engineering -- Product quality -- Part
1: Quality model,”2001.
[21] ISO/IEC 25010, “Systems and software engineering — Systems and software Quality Requirements and Evaluation (SQuaRE) — System and software quality models,” International Organization for Standardization, Geneva, Switzerland, 2011.
[22] H.R. Hartson, T.S. Andre, and R.C. Will, “Criteria for evaluating usability evaluation methods,n” International Journal of Human-Computer Interaction, vol.15, no. 1, 2003,pp.145-181.
[23] H. Thoma, “A system for subjective evaluation of audio, video and audio visual quality using mushra and samviq methods,” Consumer Communications and Networking Conference (CCNC),Las Vegas, 2012, pp. 337–341.
[24] K. Kunze, and D. Strohmeier, “Examining subjective evaluation methods used in multimedia quality of experience research,” Quality of Multimedia Experience (QoMEX), Fourth International Workshop on Yarra Valley, VIC, 2012, pp. 51-56.
[25] A. Assila, H. Ezzedine, and M.S. Bouhlel, “A Web questionnaire generating tool to aid for interactive systems quality subjective assessment,” IEEE International Conference on Control, Decision and Information Technologies, Hammamet, Tunisia, pp. 1-7. [26] N. Nishiuchi, Y. Takahashi, “Objective Evaluation Method of
Usability Using Parameters of User’s Fingertip Movement,” Transactions on Computational Science XXV, Lecture Notes in Computer Science, vol.9030,2015,pp 77-89.
[27] H. Olsen, “An evaluation of danish qualitative interview investigations,” Nordisk Psykologi, vol.54, no.2, 2002, pp. 145-172.
[28] J. Nielsen, “The use and misuse of focus groups,”Software IEEE, vol. 14, no.1, 1997, pp.94-95.
[29] R. Hartson, and P.S. Pyla, “The UX Book: Process and guidelines for ensuring a quality user experience,”Amesterdam, the Netherlands: Morgan Kaufmann, Elsevier,2012, ISBN: 978-0-12-385241-0.
[30] T. Yang, J. Linder, and D.Bolchini, “DEEP: Design-Oriented Evaluation of Perceived Usability,” International Journal of Human Computer Interaction, vol.28, no.5, 2012, pp. 308-346.
[31] J.P.Chin, V.A. Diehl, K.L. Norman, “Development of an instrument measuring user satisfaction of the human–computer interface,”in Proceedings of CHI 1988, ACM, Washington, DC, 1988, pp. 213-218.
[32] F.D. Davis, “Perceived Usefulness, Percevied Ease of Use, and User Acceptance of Information Technology,” MIS Quarterly, vol.13, 1989, pp.319-340.
[33] J.R. Lewis, J.R, “Psychometric evaluation of an after-scenario questionnaire for computer usability studies: The ASQ,” ACM SIGCHI Bulletin, vol.23, no.1, 1991, pp.78–81.
[34] J.R. Lewis, “IBM computer usability satisfaction questionnaires: Psychometric evaluation and instructions for use,” International Journal of Human Computer Interaction, vol. 7, 1995, pp.57–78. [35] J.R. Lewis, “Psychometric evaluation of the Post-Study system
usability questionnaire: The PSSUQ,”in Proceedings of the Human Factors Society 36th Annual Meeting, Human Factors Society, Santa Monica, CA, 1992,pp. 1259-1263.
[36] J. Kirakowski, and M. Corbett, “SUMI: The software usability measurement inventory,” British Journal of Educational Technology, vol.24, 1993, pp.210–212.
[37] J. Brooke, “SUS: A “quick and dirty” usability scale,” in P. Jordan,B.Thomas, and B. Weerdmeester,(Eds.):Usability Evaluation in Industry, Taylor & Francis, London, 1996, pp. 189-194.
[38] H.X Lin, Y.Y. Choong, and G.Salvendy, “A Proposed Index of Usability: A Method for Comparing the Relative Usability of Different Software Systems Usability Evaluation Methods,” Behavior and Information Technology, vol.16, no.4/5, 1997, pp.267-278.
[39] J.Kirakowski, and B. Cierlik, “Measuring the usability of websites,” in Proceedings of the Human Factors and Ergonomics Society 42nd Annual Meeting HFES, Santa Monica, CA, 1998, pp. 424–428.
[40] A. Lund, “Measuring usability with the USE questionnaire,” Usability and User Experience Newsletter, STC Usability SIG, vol.8, no.2, 2001, pp.1–4.
electronic Journal of Computer Science and Information Technology (eJCSIT), Vol. 6, No. 1, 2016
[42] K.T. Chiew, S.S. Salim, “WEBUSE: Website usability evaluation tools,” Malaysian Journal of Computer Science, vol.16, no.1, 2003, pp.47-57.
[43] M. McGee, “Usability magnitude estimation,” in Proceedings of the Human Factors and Ergonomics Society 47th Annual Meeting, HFES, Santa Monica, CA, 2003, pp. 691-695.
[44] Y.S. Ryu, and T.L. Smith-Jackson, “Usability Questionnaire Items for Mobile Products and Content Validity,” in Proceedings of HCI International, Las Vegas, 2005, pp. 22-27.
[45] D.P. Tedesco, and T.S Tullis, “A comparison of methods for eliciting post-task subjective ratings in usability testing,” Proceedings of the Usability Professionals Association Conference, Broomfield, CO, 2006.
[46] S. Elling, L. Lentz, and M. Jong, “Website Evaluation Questionnaire: Development of a Research-Based Tool for Evaluating Informational Websites,” in M.A. Wimmer, H.J. Scholl and A. Grönlund (Eds.) Lecture Notes in Computer Science, vol.4656 ,Springer-Verlag, Berlin Heidelberg, 2007,pp. 293-304. [47] J.Sauro, and J.S. Dumas, “Comparison of three one-question,
post-task usability questionnaires,” in Proceedings of CHI 2009, ACM, Boston. 2009, pp. 1599-1608.
[48] K. Finstad, “The usability metric for user experience,” Interacting with Computers, vol.22, no.5, 2010, pp.323–327.
[49] J. Sauro, “The Standardized Universal Percentile Rank Questionnaire (SUPR-Q),” 2011, Available at www.suprq.com/. [50] O. Erdinç, and J.R. Lewis, “Psychometric Evaluation of the
T-CSUQ : The Turkish Version of the Computer System Usability Questionnaire” International Journal of Human and Computer Interaction, vol.29, no.5, 2013,pp. 319-326.
[51] J.R. Lewis, B.S. Utesch, and D.E. Maher, D.E, “UMUX-LITE – When There’s No Time for the SUS,” Proceedings of the SIGCHI Conference on Human Factors in Computing Systems, 2013, pp. 2099-2102.
[52] M.D.Polkosky, “Machines as mediators: The challenge of technology for interpersonal communication theory and research,” in E.Kojin (Ed.):Mediated interpersonal communication,New York: Routledge, 2008, pp.34-57.
[53] J.R. Lewis, and M.L.Hardzinski, “Investigating the psychometric properties of the Speech User Interface Service Quality questionnaire” International Journal of Speech Technology, vol. 18, no.3,2015, pp.479-487.
[54] R. Likert, “A Technique for the Measurement of Attitudes,” Archives of Psychology, vol.140, 1932, pp.1–55.
[55] J. G.Snider, and C.E. Osgood. “Semantic Differential Technique,” A Sourcebook. Chicago: Aldine, 1969.
[56] J.C Nunnally, “Psychometric theory,” (3rd Revied edition), New
York: McGraw-Hill, 1993, ISBN: 978-0070478497.
[57] M. Hassenzahl, M. Burmester, and F. Koller, “AttrakDiff: questionnaire to measure perceived hedonic and pragmatic quality,”in: J.Ziegler and G. Szwillus (Hrsg.), Mensch and Computer Interaktion, Bewegung, 2003, pp. 187-196.
[58] K.Väänänen-Vainio-Mattila, and K.Segerståhl, “A Tool for Evaluating Service User eXperience (ServUX): Development of a Modular Questionnaire,” in User Experience Evaluation Methods in Product Development (UXEM'09),Workshop in Interact'09 conference, Uppsala, Sweden, 2009.
[59] N. McNamara, J. Kirakowski, “Measuring user-satisfaction with electronic consumer products: The consumer products questionnaire,” International Journal of Human-Computer Studies, vol. 69, no.6, 2011, pp.375 -386.
[60] J.R. Lewis, and D.K.Mayes,“Development and psychometric evaluation of the Emotional Metric Outcomes (EMO) questionnaire,” International Journal of Human-Computer Interaction,vol.30, 2014,pp. 685-702.
[61] H. S. Naeini and S. Mostowfi, “Using QUIS as Measurement Tool for User Satisfaction Evaluation (Case study: Vending Machine),” International Journal of Information Science, vol. 5, no.1, 2015, pp. 14-23.
[62] G.K.Akilli, “User satisfaction evaluation of an educational website,” The Turkish Online Journal of Educational Technology, vol.4, no.1, 2005, pp.85-92.
[63] K. Milis, P. Wessa, S. Poelmans, C. Doom, and E. Bloemen, “The Impact Of Gender On The Acceptance Of Virtual Learning Environments,” KU Leuven Association, Belgian, 2008.
[64] T. Chandrasekera, “Using Augmented Reality Prototypes in Design Education,” Design and Technology Education: an international Journal, vol.19, no.3, 2014, pp.33-42.
[65] J. Liaskos, J. Mantas, “Measuring the user Acceptance of a Web-Based Nursing Documentation System,” Methods Informatics Medical, vol. 45, no.1, 2006, pp.116-120
[66] C. Debruyne and P.De Leenheer, “Using a Method and Tool for Hybrid Ontology Engineering: an Evaluation in the Flemish Research Information Space,” Journal of Theoretical and Applied Electronic Commerce Research, vol.9.no.2, 2014, pp.48-63. [67] E. Van Veenendaal, “Questionnaire based usability testing,” in
Conference Proceedings European Software Quality Week, Brussels, November 1998.
[68] Z.Mansor, Z.M.Kasirun, S.Yahya, N.H.Arshad, “The Evaluation of WebCost Using Software Usability Measurement Inventory (SUMI),” International Journal of Digital Information and Wireless Communications, vol.2, no.2, 2012, pp.197-201.
[69] G. McArdle, “Exploring the Use of 3D Collaborative Interfaces for E-Learning,” Horia-Nicolai Teodorescu, Junzo Watada, and Lakhmi C. Jain (Eds.): Intelligent Systems and Technologies, Spring-Verlag Berlin Heidelberg, 2009, pp.249-270.
[70] N.M. Rusli, S. Hassan, and N.E.Liau, “Usability Analysis of Students Information System in a Public University,” Journal of Emerging Trends in Engineering and Applied Sciences, vol.4, no.6, 2013, pp.806-810
[71] R.De Asmundis, “An evaluation model to measure impact and usability of a serious game,” Master’s thesis, University of Bari Aldo Moro, 2014.
[72] M.E.C. Santos, J.Polvi, T. Taketomi, G. Yamamoto, C.Sandor, and H. Kato, “Toward Standard Usability Questionnaires for Handheld Augmented Reality,” IEEE Computer Graphics and Applications, vol.35, no.5, 2015, pp.50-59.
[73] A.H. Zins, U.Bauernfeind, F.D.Missier, N.Mitsche, F.Ricci, H.Rumetshofer, and E. Schaumlechner, “Prototype Testing for a Destination Recommender System: Steps, Procedures and Implications,” in Proceedings of Enter 2004, Cairo, Springer Verlag, 2004, pp. 249-258.
[74] A.Kiselev and A.Loutfi, “Using a Mental Workload Index as a Measure of Usability of a User Interface for Social Robotic Telepresence,” in Proceedings of the Ro-Man Workshop on Social Robotic Telepresence, 2012, pp. 3-6.
[75] S.Borsci, S.Federici, M.Gnaldi, S.Bacci, and F.Bartolucci, “Assessing user Satisfaction in the era of User Experience: Comparaison of the SUS, UMUX, and UMUX-LITE as a function of Product Experience,” International Journal of Human-Computer Interaction, vol.31, no.8,2015, pp.484-495.
[76] T.S. Tullis, and J.N.Stetson, “A comparison of questionnaires for assessing website usability,” Proceedings of the Usability Professionals Association Conference, 1-12, Minneapolis,Minn, USA, June 2004.
[77] J.Benedek, and T. Miner, “Measuring desirability: New methods for evaluating desirability in a usability lab setting,” Usability Professionals Association Conference, Orlando, July 2002. [78] ISO/WD 9241-112, “Ergonomics of human-system interaction —
— Part 112:Principles for the presentation of information,”2013. [79] ISO 9241-110, “Dialogue principles: Ergonomics of human-system
interaction -- Part 110,”2006.
[80] J.M.C. Bastien, and L. Scapin, “Evaluation des systèmes d'information et critères ergonomiques,” in C.Kolski(Ed.), Environnement évolués et évaluation de l’IHM, vol.2, Paris: Hermès, 2001, pp. 53-80.