Wireless Sensor Network based Accident Avoidance
Architecture for the Fleet of Long Route vehicles
Ms. Jyoti.R.Dubey1, Dr. Ankit R. Bhavsar2, Dr. Harshal A. Arolkar3
1 Assistant Professor FCAIT, GLS University 2 Assistant Professor FCAIT, GLS University
3Associate Professor, FCAIT, GLS University, Ahmedabad, Gujarat, India
[email protected], 2 [email protected], [email protected] Abstract.Transportation is basic service required by all citizens. Long route
transportation is norm today for transporting goods and persons. Road transport has remained one of the important means of transportation. Increase in popula-tion and motorizapopula-tion in the country along with expansion of road network con-tributes to the number of road accidents, injuries and mortalities, as well as loss of productivity. Safety of the passengers, drivers and property is very important issue when we talk about long route travelling. There are many issues that en-danger the safety of people and vehicle during long route transportation. Some of them are driver’s negligence while driving, overtaking by the vehicles, over speeding of vehicles on the highways, health and mental state of the driver while driving, mechanical issues of the vehicle, sudden arrival of animals on highways, unfamiliar road conditions, negotiating with difficult winding roads, road traffic, overloading of the vehicles and many more. To ensure safety of vehicle and people it is very important to be more cautious and take proper safety measures while driving for long routes. In this research paper we have proposed wireless sensor network based architecture that monitors various pa-rameters that needs to be considered effectively for avoidance of accidents on long routes.
Keywords: WSN, Sensor, Transceiver, ADC, Motes
1
Wireless Sensor Network (WSN)
A Wireless Sensor Network is one kind of network that includes a large number of mobile, self-directed, low powered sensor nodes called motes. These networks con-sists of a huge number of spatially distributed, little, battery-operated, embedded de-vices. These devices are networked to caringly collect, process, and transfer data to the operators. The nodes are tiny computers, which work jointly to form the net-works.[16]
Received on 06September 2017, accepted on 13November 2017, published on 28 December 2017
Copyright © 2017Jyoti.R.Dubeyet al., licensed to EAI. This is an open access article distributed under the termsof the Creative Commons Attribution licence (http://creativecommons.org/licenses/by/3.0/), which permits unlimited use, distribution and reproduction in any medium so long as the original work is properly cited.
doi: 10.4108/eai.28-12-2017.153521
EAI Endorsed Transactions on
A Wireless Sensor Network (WSN) includes hundreds of large number of low power multifunctional sensor nodes, operating within the unattended environment, and hav-ing senshav-ing, computation and communication capabilities. The essential parts of a node undoubtedly are a sensor unit, an ADC (Analog to Digital Converter), a CPU, an electrical unit as well as a communication unit.[17]
WSN can be used in variety of fields which may include military, healthcare, envi-ronmental, biological, home and other commercial applications.[16]
A collection of sensor nodes collect the data from the surroundings to achieve specific application objectives.Sensor nodes are used for constant sensing, event detection and local control of actuators.[16]
2
Accident Scenario in India
Road safety is a matter of serious concern, its magnitude, gravity and the kind of neg-ative impact it puts on economy, public health and welfare of people is catastrophic. Road accidents are one of the foremost causes of injuries, deaths, disabilities and loss of properties.
As per the annual report on “Road accidents India-2015” by JPRI (JP Research India Pvt Ltd.) the highest accident severity, that is road accidents deaths per 100 accidents is highest in Mizoram that is 102.9. The state wise severity of accidents is being rep-resented in the Fig. 1. [18]
Fig. 2.is the comparison of the percentage shares of road accidents across the 13 states as per year (2014-15). Tamil Nadu has highest percentage of road accidents across the 13 major states of India.[18]
Fig. 2.Percentage number of road accidents in year 2015[18]
JPRI (JP Research India Pvt Ltd.) has analyzed 88 fatal or serious accidental cases. On the basis of this analysis JPRI has found the factors contributing to fatal or serious accidents. Various influensive factors are abnormal driver behavior, poor vehicle maintenance and road infrastructure. From Table 1. it was found that poor vehicle maintenance has highest influence of all, it contributes (49%), followed by combina-tion of driver behavior (Human) and infrastructure i.e. (35%), while infrastructure related problems are only 6%.[18]Fig. 3 is representing the graphical view of Table 1.
Table 1.Figure.3 Influence of each factor in the occurrence of accidents [18]
Factor
Alone
All Combinations
Driver Behavior (Human) 49% 91%
Poor Vehicle Maintenance (Vehicle) 3% 10%
Fig. 3. Distribution of 211 Accidents by Contributing Factors influencing the Occurrence of
Accidents
3
Related Work
WSN is being used in monitoring applications such as health monitoring, driver be-havior monitoring in order to ensure safety and security. [6], [7], [8], [9], [10], [11], [12], [13], [14], [15], [16], [17].
A. Mounika et.al.[1] has proposed a non-intrusive bio-potential measurement system for driver’s health monitoring and fatigue detection. The entire system composed of ARM7TDMI microcontroller, LCD display, alcohol sensor, eye blink sensor, ECG sensors, GPS system, GSM, Motor drive. The researcher proposes bio- potential measurement system that will cause less mental and physical load to the drivers. The system proposes how to measure bio-potential signals without the requirement of electrodes which otherwise needs to be in contact with human body which in turn causes hindrance to driver’s while driving. The eye blink sensor continuously measures blinking of eye and sends the data to a microcontroller. GSM modem is used to trace the vehicle and also to inform to control room. ECG sensors generate electrical potentials on the basis of muscle cell contraction and relaxation. In case the pulse width of the driver is high then the vehicle is stopped and position of the vehicle is traced by GPS system and intimation is given instantly to the concerned doctor to reach the location of the vehicle to provide medical help to the driver.
proposed by the researcher is a prototype it’s not implemented yet. The research is focusing on detecting mechanical issues with the vehicle rather than identifying or monitoring driver’s behavior and environment. However this research could be ex-tended to merge with monitoring driver’s behavioral parameters while driving in real time.
D. Sowmya et.al.[3] has proposed a vital system for detecting and monitoring driver’s behavior on the basis of information obtained from various sensors to ensure road safety by alerting the driver and other vehicles on the road in case of abnormal driver behavior. The behaviour here can be classified as normal behavior, drunk behavior, fatigue and reckless behavior. The researcher were able to capture various static and dynamic aspects of behavior which helped to understand decision making capability of the driver in different situations.
Joel C.McCall et.al.[4] has proposed Driver Attention Monitoring System. Aggregat-ed outcomes from LISA-Q test bAggregat-ed that capture video, audio and vehicle information, Laser Radar information and information gathered from GPS system were considered as input to the system for evaluating driver’s behavioral state. This system involves capturing and synchronizing data from many different types of sensors and generating relevant metrics from this information. By combining a wide variety of different sen-sors and metrics, a robust estimate of the driver’s physical and mental state is created. Luis M. Bergasa et.al.[5] has proposed a non-intrusive prototype computer vision system for determining driver’s level of vigilance. The prototype has focused on cal-culating six parameters like PERCLOS (percentage of eye closure), eye closure dura-tion, blink frequency, nodding frequency, face position and fixed gaze. The architec-ture of the proposed system consists of modules such as image acquisition, pupil de-tection and tracking, visual behaviors and driver vigilance. Data obtained by evaluat-ing all the parameters is fed into a fuzzy classifier to evaluate the level of driver’s inattentiveness. Alarm is activated to intimate the driver if level of inattentiveness is found above a predetermined threshold.
4
Proposed architecture for accident avoidance
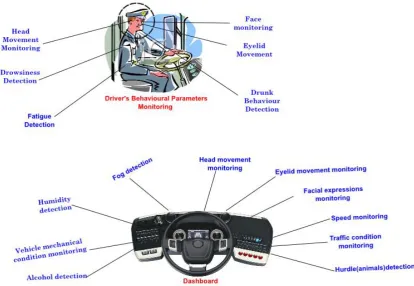
Fig. 4 Pictorial representation of the driver behavior and dashboard of the vehicle
Further we intend to observe over speeding of the vehicles. A nonintrusive system capable of monitoring the said parameters will be deployed. In case of any abnormal occurrence of events, the designated sensor will sense the event and informs its occur-rence to the nearest toll plaza (Control room). The possible controlling actions like setting of an alarm within a vehicle, controlling speed of vehicle, intimating nearby vehicles etc can then be taken.
Fig.4. represents various parameters of driver that could be monitored by the pro-posed accident avoidance architecture. The parameters monitored here are, head movement, face monitoring, eyelid movement, drunken behavior detection, drowsi-ness detection and fatigue detection.
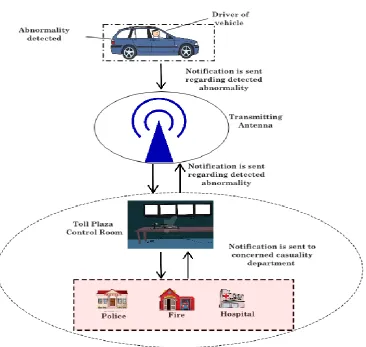
Fig. 5. Basic communication architecture for accident avoidance
4.1 Basic architectural flow
Fig.5. shows basic communication flow of our architecture. The communication flow in this architecture is based on three entities mainly vehicle, transmission media and control system. Vehicles that need to be monitored must be equipped with the smart system, which is capable of transmitting the required information pertaining to vehi-cle and driver’s behavior. Antenna acts as a junction for transmitting required infor-mation. Toll plaza/control room is a place from where the corresponding actions can be initiated after receiving and analyzing the information obtained from vehicle.
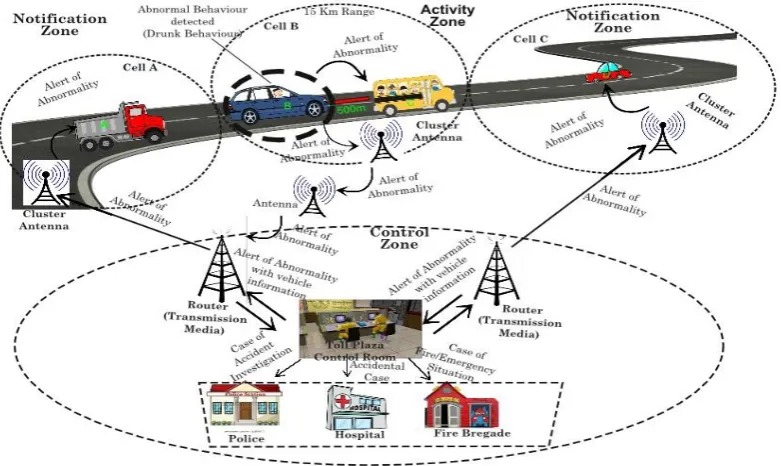
4.2 Detailed architecture
sys-tem. Architecture has been divided into three main zones. The three zones can be categorized as: Activity zone, Notification zone and Control zone.
Activity zone: It is the area where the abnormality would be detected either in driver behavior or vehicle system. The components of the activity zone can be vehicle in which abnormality is being detected, cluster antenna and surrounding/neighbouring vehicles. Every antenna has probable range of 15 km which will create a virtual cell to send and receive any data within a diameter of 15 km around it. The vehicle equipped with smart system which is passing through the cell can transmit driver behavior or vehicle system data to the corresponding cell cluster antenna and to the nearby vehicle which are at the probable distance of 1km from it. Provided both vehi-cles should be in the same virtual cell of antenna as mentioned above.
Activity zone activities can be categorized as: Probable accident condition and Actual accident condition.
Fig. 6. Pictorial representation of Communication regarding Abnormalities on the highway
con-trol room. The concon-trol room of the toll plaza can take possible actions like, setting off an alarm within the vehicle, controlling speed of the vehicle etc.
Actual accident condition: occurs when the fatality or accident has occurred. In this case the alert system of the vehicle can get activated and sent alert of the accident to the vehicles surrounding it up to range of 1 km. This alert is intended to make sure that other vehicles don’t get trapped in the zone. The information will be sent to near-est toll plaza which is acting as control room. The toll plaza will sent immediate noti-fication to the concerned casualty department like, hospital, police and fire brigade to reach to accident site.
Notification zone: In notification zone, after detecting the abnormality in activity zone the cluster antenna of that zone will receive the information and shower that information to the cluster antenna’s of the nearby cells, which will further transmit it to the other vehicles and nearest toll plaza.
Control Zone: In control zone, control room plays an important role, it receives data from nearby cluster antenna, analyse it and can initialize an alert action such as inti-mating fire brigade in case of fire, hospital in case of trauma care and police.
5
Conclusion
In this paper we have proposed an architecture based on wireless sensor network, that can help in monitoring various aspects like vehicle condition, driver behavior in real time if this will be implemented in future can be helpful and effective in reducing the occurrences of accidents up to great extent.
References
1. A. Mounika, D. Srikar and P.Rajendra Chaitanya “Driver Behaviour Monitoring and Alert-ing System for Safer Navigation” International Journal Of Research In Advanced Engineer-ing Technologies, Volume 4, Issue 4 Aug (2015)
2. Adnan K. Shaout and Adam E. Bodenmiller “A Mobile Application for Monitoring Ineffi-cient and Unsafe Driving Behaviour”The Electrical and Computer Engineering Depart-ment,The University of Michigan-Dearborn Dearborn, Michigan 48128, 2011-12-11 3. D. Sowmya, I.Suneetha and N.Pushpalatha “Driver Behaviour Monitoring Through Sensors
And Tracking The Accident Using Wireless Technology” International Journal Of Comput-er Applications, Vol. 102-No.2, SeptembComput-er (2014).
4. JoelC.McCall and Mohan M. Trivedi “Visual Context Capture and Analysis for Driver At-tention Monitoring” Computer Vision and Robotics Research Laboratory University of Cali-fornia, San Diego, 7th IEEE Conference on Intelligent Transportation Systems
5. Luis M. Bergasa, Jesus Nuevo, Miguel A. Sotelo and Manuel Vhzquez “Real-Time System For Monitoring Driver’s Vigilance” IEEE Transaction of intelligent Transportation Systems, Vol. 7, IEEE Transactions …, 2006 - ieeexplore.ieee.org
7. I.G Daza, N. Hernandez, L. M. Bergasa, I. Parra, J. J. Yebes, M. Gavilan, R. Quintero, D. F. Llorca and M. A. Sotelo“Drowsiness Monitoring Based on Driver and Driving Data Fusion” Department of Electronics, University of Alcala Madrid Spain, 2011, 14th International IEEE Conference on Intelligent Transportation Systems, Washington DC, USA.
8. Gys Albertus Marthinus Meiring and Hermanus Carel Myburgh “A Review of Intelligent Driving Style Analysis Systems and Related Artificial Intelligence Algorithms” Received: 14 July (2015); Accepted: 16 November (2015); Published: 4 December 2015, Academic Editor: Felipe Jimenez Department of Electrical, Electronic and Computer Engineering 9. J.Wu, M. McDonald and K. Chatterjee “A Detailed Evaluation of Ramp Metering Impacts
on Driver Behavior” Transportation Research Part F 10 (2007) 61-75, Elsevier Ltd.
10. Kelvin C. Baldwin, Donald D. Duncan and Sheila K. West “The Driver Monitor System: A Means Of Assessing Driver Performance” Johns Hopkins Technical Digest, Volume 25, Number 3
11. K.Navya and Dr. M.B.R Murthy “A Zigbee Based Patient Health Monitoring System” Int. Journal of Engineering Research and Applications www.ijera.com Vol. 3, Issue 5, Sep-Oct 2013, pp.483-486
12. Kazem Sohraby, DaniealMinoli and TaiebZnati“ Wireless Sensor Networks- Technology, Protocols, and applications”, 2nd Edition by Willey India
13.Prashant Roy, Ankit Khetrapal and Sandeep Rathore “Driver Assistance System” School Of Electronic Engineering, VIT University, Vellore Tamilnadu, India, Volume 2, Issue 4, ISSN:2321-9939
14. QiangJi and Xiaoji Yang “Real-Time Eye, Gaze, and Face Pose Tracking For Monitoring Driver’s Vigilance”(2002) Elsevier Science Ltd., Real time imaging 8,357-377(2002) 15.Singh Himani Parmar, Mehul Jajal and Yadav Priyanka Brijbhan “Drowsy Driver Warning
System Using Image Processing” INTERNATIONAL JOURNAL OF ENGINEERING DEVELOPMENT AND RESEARCH IJEDR,ISSN: 2321-9939
16.T. Brandt, R. Stemmer, B. Mertsching and A. Rakotonirainy “Affordable Visual Driver Monitoring System for Fatigue and Monotony” 0-7803-8566-7/04/2004 IEEE.
Web References
17. http://ijtir.hctl.org/vol14/IJTIR_Article_201504011.pdf
18. http://pibphoto.nic.in/documents/rlink/2016/jun/p20166905.pdf, Road Accidents in India 2015
![Fig. 1.Severities of road accidents across States during 2015[18]](https://thumb-us.123doks.com/thumbv2/123dok_us/8427559.1696538/2.595.136.493.419.661/fig-severities-road-accidents-states.webp)
![Fig. 2.Percentage number of road accidents in year 2015[18]](https://thumb-us.123doks.com/thumbv2/123dok_us/8427559.1696538/3.595.136.487.205.444/fig-percentage-number-road-accidents-year.webp)