Does the Foreign Exchange Market
Overreact?
Shangkari V. Anusakumar and Nur Adiana Hiau Abdullah*
ABSTRACT
This study uses a sample of 21 currencies to investigate exchange rate behaviour following extreme 1-day exchange rate movements during the period January 2000 to December 2007. Deriving evidence from a post-event cumulative average abnormal return of winners and associated losers, the results lend support to the overreaction hypothesis, underreaction hypothesis, and uncertain information hypothesis. Moreover, there is substantial evidence of investor over-optimism to negative and positive events. The efficient market hypothesis is rejected for all currencies. Contrary to prior studies, currencies of emerging markets do not overreact more than those of the developed markets. The magnitude effect is also not supported. On an aggregate basis, the currency market tends to overreact which implies that the market is not efficient.
Keyword: Currency, Efficient Market Hypothesis, Exchange Rate, Overreaction, Underreaction,
JEL Classification: G14, F31
1. Introduction
A long standing topic of interest in behavioural finance is investor
overreaction. The effects of overreaction are observed and noted by various authors as far back as Keynes (1964). The overreaction hypothesis, as it is known now, is formally postulated by DeBondt and Thaler (1985). The hypothesis states that investors tend to overreact to both positive news and negative news (i.e. investors overreact in the Bayesian sense). DeBondt and Thaler’s explanation of the overreaction
* Corresponding author: Nur Adiana Hiau Abdullah is a Professor at the School of Economics,
Finance and Banking, College of Business, Universiti Utara Malaysia, 06010 UUM Sintok, Kedah, Malaysia. Email: [email protected].
effect is inspired by Kahneman and Tversky (1982)’s experimental studies, which discovered that people tend to overreact to unexpected and dramatic news events. The article stirs up controversy because it gives “evidence to support the hypothesis that a cognitive bias could produce predictable mispricing of stocks” (Thaler, 1999). This notion
opposes the concept of stock market efficiency. Since the paper by
DeBondt and Thaler, there has been a plethora of work on return predictability in the stock market (e.g. Ajayi & Mehdian, 1994; Atkins & Dyl, 1990; Fabozzi, Fung, Lam, & Wong, 2013; Himmelmann, Schiereck, Simpson, & Zschoche, 2012; Klößner, Becker, & Friedman, 2012;
Rezvanian, Turk, & Mehdian, 2011; Savor, 2012). The studies on stock
market overreaction are widely known, but there are limited studies on the overreaction of currencies.
Hence, this study focuses on the foreign exchange market, which is largely unexplored in terms of the overreaction hypothesis (OH).
The foreign exchange market is the largest and most active financial
market in the world (Du, 2013; Liu & Witte, 2013; Manzan & Westerhoff, 2005). Based on the large number and variety of participants and market activity, the foreign exchange market is expected to be at least
weak form efficient. Findings of overreaction or underreaction in the
foreign exchange market will certainly provide strong evidence against
the efficient market hypothesis (EMH). Despite this, the overreaction
literature on this particular market is drastically lacking. There are only a few overreaction studies done in the foreign exchange market (Larson
& Madura, 2001; Parikakis & Syriopoulos, 2008). A flaw inherent in these
previous studies is the lack of consideration for the exchange rate regime of the currencies under review. The effects of government intervention
are difficult to identify and isolate from overreaction. Thus, the observed
reversals may in fact be caused by government intervention.
To the best of the authors’ knowledge, there are only two papers
specifically addressing overreaction hypothesis with regard to the foreign
exchange market, namely Larson and Madura (2001) and Parikakis and Syriopoulos (2008). This study contributes to the existing literature in several ways. This study takes into consideration the possibility of government intervention by limiting the sample set to currencies with
pure floating exchange rate regimes to avoid any biases in the results. In
Thaler, 1985). Thus, these short windows may not sufficiently capture
the return reversals. Moreover, past studies have examined a relatively restricted sample. Parikakis and Syriopoulos (2008) tested only four currencies: US dollar, British pound, Turkish lira, and Brazilian real. Overreaction was documented for three of the four currencies that were examined. Larson and Madura (2001) examined 15 currencies and documented the presence of overreaction for emerging markets and underreaction for developed markets. However, the overreaction of the individual currencies was not tested. The sample was divided into two groups (‘emerging currency’ and ‘industrial currency’) and only these two groups were examined as a whole instead of assessing the overreaction of each of the individual currencies. In contrast, this study offers a broader and more comprehensive look at the topic by testing a sample of 21 individual currencies.
The aim of this study is to fill the gap identified in the literature
pertaining to the overreaction hypothesis. This study seeks to determine whether the foreign exchange market overreacts. The overreaction hypothesis also posits that the greater the magnitude of initial exchange rate movement, the more extreme will be the subsequent reversals. As such, the impact, if any, of initial exchange rate movement on subsequent reversals is investigated. Moreover, subsamples of emerging and developed countries are determined, to ascertain if the currency of an emerging country overreacts more than that of a developed country. A matter of further interest is the effect of pre-event exchange rate
movement on the extent of overreaction. Significant exchange rate
movement prior to an event indicates information leakage, and this leakage may affect the degree of overreaction.
The remainder of this paper is divided into five sections. Section 2
and Section 3 offer a review of the relevant literature and formulation of hypotheses respectively. Section 4 provides a description of the data and
research design while the analysis of the findings is reported in Section 5. The final section summarises and concludes the paper.
2. Related Literature
Larson and Madura (2001) undertook the first study of overreaction
and underreaction in the context of the currency market. Using daily exchange rate data for 15 currencies from January 1988 to December 1995, they studied the exchange rate changes following extreme 1-day
is a modified version of Brown and Warner (1980)’s mean-adjusted
returns model was used to analyse the market reaction to exchange
rate changes. Extreme 1-day fluctuations are defined as those exceeding
two standard deviations from the mean. Larson and Madura found overreaction for emerging market currencies, whereas underreaction
prevails in developed market currencies. They conclude that efficient
market hypothesis (EMH) can be rejected for the currency market.
Cross-sectional regressions reveal that the findings are robust against initial
exchange rate change, leakage, and day of the week effect. The results also provide evidence of a higher degree of overreaction in the emerging markets than that experienced in industrial markets. This may be
attributed to a more efficient market or increased liquidity in developed
markets. However, Larson and Madura’s use of the standardisation procedure is questionable as it may have compromised the results of the study. Kwok and Brooks (1990) suggest that Brown and Warner (1980)’s standardisation procedure is not well suited for application in the foreign currency markets. While standardisation reduces Type II error, it also increases Type I error.
Parikakis and Syriopoulos (2008) tested currencies for two developed markets (i.e. British pound and US dollars) and two emerging markets (i.e. Turkish lira and Brazilian real) using data from January 1999 till February 2007. They identifed 904 positive events and 532
negative events. Unlike Larson and Madura’s study, they set the filter at
a level equal to or exceeding ± 0.6 per cent. They found underreaction for the British pound, while for the Turkish lira, the Brazilian real and the US dollar, they found overreaction. Contrarian investment strategy holds for all exchange rates as the currencies follow a different movement for
at least two days after the event day. The findings of overreaction for
US dollars contradict Larson and Madura’s study wherein developed currencies are found to underreact rather than overreact. However, Parikakis and Syriopoulos’s study is based on a limited sample of four currencies. Therefore, it is not possible to conclude on an overall basis, whether developed markets overreact or underreact. The use of log
cumulative abnormal returns (LCAR) may have distorted the results. Flaws and dangers inherent in the CAR log method were highlighted
by Barber and Lyon (1997), Kothari and Warner (1997) and Dissanaike
and Le Fur (2003). Specifically, Kothari and Warner and Barber and Lyon
show that log returns are negatively skewed, such that test-statistics are
measures the instantaneous return on a strategy involving continuous rebalancing which is unrealistic, given that it cannot be implemented
literally and involves high transaction costs. Moreover, LCAR creates a
bias wherein it underestimates the value of the continuously rebalanced portfolio.
A further limitation of Dissanaike and Le Fur (2003) is that the
specific exchange rate regimes of these currencies are not considered. This may jeopardise the findings of the study. Turkey only floated its
currency in February 2001 and yet the data on Turkish lira is from January 1999. There is a high possibility that the overreaction observed prior to February 2001 may have been the result of Government intervention. Moreover the economic crisis in 2001 may have exaggerated the level of overreaction, thereby tilting the results in favour of the overreaction hypothesis.
3. Research Hypotheses Development
3.1. Hypothesis on Exchange Rate Movement
The overreaction hypothesis as proposed by DeBondt and Thaler (1985) contends that investors overreact in the Bayesian sense.
Investors overestimate the significance of positive and negative news.
According to the overreaction hypothesis, extreme price movements will subsequently be followed by reversals (directional effect). The overreaction hypothesis also postulates that the more extreme the initial price change, the more extreme the subsequent price reversals. This proposition, termed as the “magnitude effect” by Brown, Harlow, and
Tinic (1988), has not been frequently tested and verified in overreaction
studies. In this study, both the directional effect and magnitude effect are tested to ascertain whether overreaction hypothesis holds in the foreign exchange market. From the propositions of overreaction hypotheses, two main hypotheses may be derived.
H1a: There is reversal following extreme positive and negative exchange rate movement.
H1b: The higher the initial exchange rate movement, the higher the subsequent reversal.
Aside from overreaction, empirical findings have also revealed the
are related concepts that deal with investor psychology. However, the concepts put forth opposite implications for price movement. In the case of overreaction, positive change in prices will be subsequently followed by a decrease in prices and negative events will trigger positive returns in the subsequent periods. This means that there is a reversal following price changes. On the other hand, underreaction is characterised by
an insufficient reaction to the event, thus prompting a continuation of
the movement of prices in the same direction as the initial event. An extreme negative (positive) price movement will be followed by negative (positive) price movements to correct the underreaction. In other words, there is continuation. Therefore, the second hypothesis is as follows:
H2: There is continuation following extreme positive and negative exchange rate movement.
The third hypothesis is the uncertain information hypothesis (UIH) as proposed by Brown et al. (1988). It offers an alternative explanation for investors’ reaction to unexpected news. UIH contends that investors react more strongly to unfavourable news than favourable news. The implications of UIH and overreaction hypothesis are essentially the same for negative news, but differ with respect to positive news. Whereas overreaction hypothesis suggests a reversal in prices following positive news, UIH predicts that prices continue to increase after the initial positive news. Thus, the third hypothesis is formulated as the following:
H3: There is reversal following extreme negative exchange rate movement and there is continuation following extreme positive exchange rate movement.
The fourth hypothesis is the efficient market hypothesis
(EMH) which states that there should be no significant abnormal
return following the initial reaction. The unexpected information is instantaneously disseminated and incorporated into prices. Therefore,
prices fully reflect all available information at any given point in time. Correspondingly, there should be no significant price changes after the
event. Thus, the fourth hypothesis is stated as follows:
H4: There is no significant price change following the initial extreme
3.2. Hypothesis on Liquidity
The fifth hypothesis is the currency liquidity hypothesis. The findings
of Cox and Peterson (1994) suggest that overreaction of stock prices is stronger in less liquid markets. Larson and Madura (2001) extend this concept of liquidity to the foreign exchange market. They argue that markets for emerging currency should have less activity (less liquid) than the markets for currency of developed countries. Therefore, the degree of overreaction should be more pronounced for currencies of emerging markets than currencies of developed markets. The hypothesis on the effect of liquidity on overreaction is stated as follows.
H5: Currencies of emerging markets exhibit a higher degree of overreaction than currencies of developed markets.
3.3. Hypothesis on Information Leakage
Finally, the last hypothesis deals with information leakage. A puzzling
pattern of significant abnormal returns is reported to occur before
the event day (Larson & Madura, 2001). Information leakage has been forwarded as a possible explanation. In this case, there are two differing hypotheses with regard to the impact of leakage on the subsequent reversal (Larson & Madura, 2001). The leakage certainty hypothesis implies that the market wide leakage will reduce the level of uncertainty of investors regarding the event. In essence, the lower
level of uncertainty increases investor confidence and correspondingly,
investors will be less inclined to overreact. On the other hand, the private information leakage hypothesis states that pre-event leakage is caused by investors trading based on uncertain private information. These investors tend to overweigh the private information source resulting in an increase in overreaction. The higher the leakage, the higher will be the overreaction. Thus, hypothesis 6 is stated as follows:
H6: Higher levels of information leakage affect the level of overreaction.
4. Data and Methodology
4.1. Data
noted by Calvo and Reinhart (2002) and Levy-Yeyati and Strurzenegger (2005), countries that proclaim themselves as having flexible exchange
rates in fact effectively operate soft pegs (closet peggers). As such, this study relied on the de facto classification rather than the de jure
classification. For this purpose, reference was made to the International
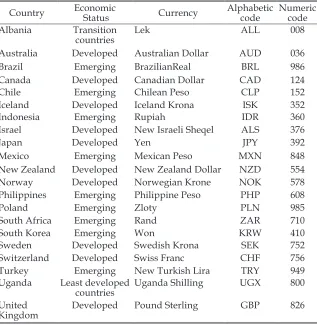
Monetary Fund (IMF) De Facto Classification of Exchange Rate Regimes. All 26 currencies listed under independent float were selected. Due to unavailability of data, the final data set consisted of 21 currencies as
enumerated alphabetically in Table 1.
Table 1: Final Sample Set of 21 Currencies and Economic Status Classification
Note: Classifications are based on United Nations Standard Country and Area Code Classification, IMF Country Composition and FTSE Country Classification.
Country Economic Status Currency Alphabetic code Numeric code
Albania Transition
countries Lek ALL 008
Australia Developed Australian Dollar AUD 036
Brazil Emerging BrazilianReal BRL 986
Canada Developed Canadian Dollar CAD 124
Chile Emerging Chilean Peso CLP 152
Iceland Developed Iceland Krona ISK 352
Indonesia Emerging Rupiah IDR 360
Israel Developed New Israeli Sheqel ALS 376
Japan Developed Yen JPY 392
Mexico Emerging Mexican Peso MXN 848
New Zealand Developed New Zealand Dollar NZD 554
Norway Developed Norwegian Krone NOK 578
Philippines Emerging Philippine Peso PHP 608
Poland Emerging Zloty PLN 985
South Africa Emerging Rand ZAR 710
South Korea Emerging Won KRW 410
Sweden Developed Swedish Krona SEK 752
Switzerland Developed Swiss Franc CHF 756
Turkey Emerging New Turkish Lira TRY 949
Uganda Least developed
countries Uganda Shilling UGX 800
United
The exchange rate data were obtained from Thomson DataStream. In this study, exchange rates are stated in terms of Sample Currency/ US dollar (USD). The USD was selected as the numeraire currency because it is a commonly used currency for the purpose of international trade. The availability of currencies quoted in terms of USD facilitates the collection of data. After examining several currencies, Kwok and Brooks (1990) found that USD is a reasonable and generally satisfactory numeraire to be selected for event study.
Data were collected for an 8-year period, from 2000 to 2007. The years 2000 through 2007 were relatively devoid of major crises and were chosen for this factor. By selecting the year 2000 as the beginning
of the sample, this study effectively avoided the 1997 Asian financial crisis and provided a time period that reflected current conditions. The period after 2007 marked the advent of the global financial crisis.
Thus, the period chosen avoided two major crises that could have potentially contaminated the results of this study. The only exceptions are Philippine peso and New Turkish lira where the data were collected for the period from January 2002 to December 2007. This was due to the Philippine political crisis that occurred from early 2000 until end of 2001, which effects mirrored that of the 1998 Asian crisis. Whereas
Turkey floated the lira only in February 2001 and hence including data
from years prior to this might compromise the data.
4.2. Methodology
The arrival of unexpected news are signaled by extreme movements in exchange rates. Hence, they are used as a proxy for arrival of news. Examination of the returns that followed these “extreme” movements will reveal any patterns of reversals or momentum. In particular, this study investigates extreme 1-day exchange rate movements where positive (negative) extreme movements are termed winners (losers).
There is no precise definition of what constitutes an “extreme”
exchange rate movement. Past studies have arbitrarily assigned
percentage filters ranging anywhere from 0.5 per cent to 50 per cent (Atkins & Dyl, 1990; Cox & Peterson, 1994; Lobe & Rieks, 2011; Mazouz,
Joseph, & Palliere, 2009). Each currency has differing volatility levels;
thus, setting a common filter level for each currency may yield a small
sample for one currency and a large sample for another. Hence, rather
than assigning a percentage filter, exchange rate changes exceeding
movement (Larson & Madura, 2001; Maher & Parikh, 2011; Spyrou,
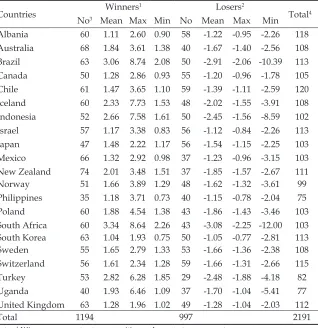
Kassimatis, & Galariotis, 2007). Using this filter, this study found 2191
extreme exchange rate movements as detailed in Table 2.
Notes: 1 Winners represent extreme positive exchange rate movement. 2 Losers represent extreme negative exchange rate movement.
3 Number of days with extreme exchange rate movement (i.e. event day). 4 Total number of days with extreme exchange rate movement for each currency. Table 2: Descriptive Statistics of Extreme Exchange Rate Movement
Countries Winners1 Losers2 Total4
No3 Mean Max Min No Mean Max Min Albania 60 1.11 2.60 0.90 58 -1.22 -0.95 -2.26 118 Australia 68 1.84 3.61 1.38 40 -1.67 -1.40 -2.56 108 Brazil 63 3.06 8.74 2.08 50 -2.91 -2.06 -10.39 113 Canada 50 1.28 2.86 0.93 55 -1.20 -0.96 -1.78 105 Chile 61 1.47 3.65 1.10 59 -1.39 -1.11 -2.59 120 Iceland 60 2.33 7.73 1.53 48 -2.02 -1.55 -3.91 108 Indonesia 52 2.66 7.58 1.61 50 -2.45 -1.56 -8.59 102 Israel 57 1.17 3.38 0.83 56 -1.12 -0.84 -2.26 113 Japan 47 1.48 2.22 1.17 56 -1.54 -1.15 -2.25 103 Mexico 66 1.32 2.92 0.98 37 -1.23 -0.96 -3.15 103 New Zealand 74 2.01 3.48 1.51 37 -1.85 -1.57 -2.67 111 Norway 51 1.66 3.89 1.29 48 -1.62 -1.32 -3.61 99 Philippines 35 1.18 3.71 0.73 40 -1.15 -0.78 -2.04 75 Poland 60 1.88 4.54 1.38 43 -1.86 -1.43 -3.46 103 South Africa 60 3.34 8.64 2.26 43 -3.08 -2.25 -12.00 103 South Korea 63 1.04 1.93 0.75 50 -1.05 -0.77 -2.81 113 Sweden 55 1.65 2.79 1.33 53 -1.66 -1.36 -2.38 108 Switzerland 56 1.61 2.34 1.28 59 -1.66 -1.31 -2.66 115 Turkey 53 2.82 6.28 1.85 29 -2.48 -1.88 -4.18 82 Uganda 40 1.93 6.46 1.09 37 -1.70 -1.04 -5.41 77 United Kingdom 63 1.28 1.96 1.02 49 -1.28 -1.04 -2.03 112
Total 1194 997 2191
4.2.1 Event Study
is efficient, then there should be no significant return after the event
day. For the overreaction hypothesis to be supported, currencies should experience reversals for both winners and losers. However, for the underreaction hypothesis to be supported, currencies should experience continuations for both winners and losers. For the uncertain information hypothesis, there should be reversals for losers and continuation for winners. Using the standard event study method, abnormal return was computed as follows:
ARit = Rit – E(R)it (1)
where AR is the abnormal return, R represents actual return and E(R)
represents expected return. Given that the current spot rate is the best predictor for the spot rate for the next period, the expected return
should be zero (Cheung, Chinn, & Pascual, 2005; Pierdzioch, Rülke, &
Stadtmann, 2012).
Cumulative abnormal return (CAR) was computed for each individual currency as the summation of AR over t days. Following
the initial event, CAR was calculated for t days to examine the pattern of reversals (if any).
CARit = t=1
S
t ARit (2)where CAR is the cumulative abnormal return over t days and AR is
the abnormal return. For each individual currency, cumulative average
abnormal returns (CAAR) were computed as the cross-sectional average of CAR.
CAARit = (3)
N
i=1
S
CARitN
where CAR is the cumulative abnormal return and N is the number of
observations.
A 15-day event window (t is 15 days) was used to capture any
overreactions. In other words, returns are specifically cumulated for each
and four days (Parikakis & Syriopoulos, 2008). However, the corrections of mispricing are a gradual process and consequently the reversals may continue to occur after four days. Usage of such a short event window may possibly underestimate the level of overreaction. Therefore, this study extended the window to a period of 15 days to effectively capture any reversals. A standard t-test was used to determine whether the
post-event returns are statistically significant.
4.2.2 Multiple Regression
Multiple regression was used to test H1b, H5, and H6. Similar to Cox
and Peterson’s (1994) approach, cumulative abnormal returns (CAR)
were cross-sectionally regressed on the day 0 abnormal return to test for the existence of “magnitude effect” (H1b). Moreover, the relationship between overreaction and the level of economic development of countries was assessed (H5). As in Larson and Madura (2001), the sample data were segregated into developed and emerging market currencies and a dummy variable was included in the regression model.
In addition, regression was also used to establish the effect, if any,
of pre-event abnormal return on post-event CAR (H6). The regression model is described in Equation 4. All currencies were included in the regression sample except for the currencies of Albania (transition country) and Uganda (least developed country) to avoid any distortion of the results. Two separate regressions were carried out for winners and losers respectively using Equation 4.
CARi = β0 + β1 PREi + β2 INITIALi + β3 EMERGEi + ε (4)
where CARi is the post-event 15 day cumulative abnormal return for currency i. PREi is the 15 day pre-event cumulative abnormal return. INITIALi represents the abnormal return on the initial event day (Day
0). EMERGEi is a dummy variable which is equal to “1” if emerging country and equal to “0” if otherwise.
CAR was used as the dependent variable rather than CAAR.
According to Tabachnick and Fidell (2001), a rule of thumb is to have N equal to or more than 104 + m, where m = number of independent
variables. The use of CAAR would have yielded only 21 observations. By substituting CAAR with CAR, N was dramatically increased.
Larson and Madura (2001) included variables to control for calendar anomalies. However, calendar anomalies may no longer be
found significant day of the week effect in the 1980’s but these effects disappeared in 1990’s. Their findings concur with other studies reporting
disappearance of calendar anomalies in many of the equity markets
around the world (see Chang, Pinegar, & Ravichandran, 1993; Dubois
& Louvet, 1996; Kohers, Kohers, Pandey, & Kohers, 2004). Arguably, it is no longer necessary to adjust for calendar anomalies and as such these variables were not included in the regression.
5. Analysis of Findings
5.1. Results of Event Study
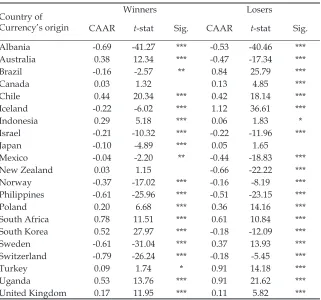
Table 3 presents the cumulative average abnormal return (CAAR) results
for the 21 currencies. The currencies of Brazil, Iceland, and Sweden
experience significant negative CAAR for winners and significant
positive returns for losers. As there are reversals for both losers and winners, the evidence concurs with the overreaction hypothesis. As such, H1a is supported for these currencies. On the other hand, CAAR for winners (losers) are significantly positive (negative) for currencies of
Australia and South Korea. In other words, these currencies experience
continuations for winners and losers. Therefore, this confirms the
existence of underreaction hypothesis (i.e. H2 is supported). Currencies of Chile, Indonesia, Poland, South Africa, Turkey, Uganda, and United Kingdom appear to experience reversals for losers, but tend to have continuations for winners. This falls within the dictates of uncertain information hypothesis (H3).
For the currencies of Albania, Israel, Mexico, Norway, Philippines,
and Switzerland, the post-event return is negative and significant for
both negative and positive events. In other words, the currencies are found to overreact for winners and underreact for losers. While this observation does not comply with any of the hypotheses set out in this study, it might arise from over-optimism (optimism bias) of investors in assessing the impact of positive or negative news. Optimism bias occurs when individuals believe that their own probability of facing a bad outcome is lower than the actual probability. Due to over-optimism, investors may have a tendency to overweigh positive events and underweigh the impact of negative events.
As can be observed in Table 3, the New Zealand dollar does not have any reversals or continuations subsequent to positive events (winners)
the New Zealand dollar displays reversals for negative events as
evidenced by the significant CAAR of -0.66 per cent. This asymmetrical underreaction is puzzling. For the Canadian dollar, post-event CAAR for winners is not significant in both economic and statistical terms. Nevertheless, there are significant reversals for losers. Taken together,
the non-negative post-event returns for winners and positive returns for losers may lend support to the uncertain information hypothesis (H3). On the other hand, the Japanese yen experiences reversals for
winners, but there is no significant post-event CAAR for losers. Arguably,
this may be construed as evidence in support of optimism bias with Country of
Currency’s origin
Winners Losers
CAAR t-stat Sig. CAAR t-stat Sig.
Albania -0.69 -41.27 *** -0.53 -40.46 ***
Australia 0.38 12.34 *** -0.47 -17.34 ***
Brazil -0.16 -2.57 ** 0.84 25.79 ***
Canada 0.03 1.32 0.13 4.85 ***
Chile 0.44 20.34 *** 0.42 18.14 ***
Iceland -0.22 -6.02 *** 1.12 36.61 ***
Indonesia 0.29 5.18 *** 0.06 1.83 *
Israel -0.21 -10.32 *** -0.22 -11.96 ***
Japan -0.10 -4.89 *** 0.05 1.65
Mexico -0.04 -2.20 ** -0.44 -18.83 ***
New Zealand 0.03 1.15 -0.66 -22.22 ***
Norway -0.37 -17.02 *** -0.16 -8.19 ***
Philippines -0.61 -25.96 *** -0.51 -23.15 ***
Poland 0.20 6.68 *** 0.36 14.16 ***
South Africa 0.78 11.51 *** 0.61 10.84 ***
South Korea 0.52 27.97 *** -0.18 -12.09 ***
Sweden -0.61 -31.04 *** 0.37 13.93 ***
Switzerland -0.79 -26.24 *** -0.18 -5.45 ***
Turkey 0.09 1.74 * 0.91 14.18 ***
Uganda 0.53 13.76 *** 0.91 21.62 ***
United Kingdom 0.17 11.95 *** 0.11 5.82 ***
Table 3: Post-Event 15-day CAAR (%) for Each Currency
investors overweighing the impact of positive events. However, the
insignificant post-event returns for losers indicate that investors correctly
gauged the impact of negative events. Given the ambiguity, the Japanese yen does not provide any conclusive evidence.
Table 4 (Panel A) reports the CAAR for the overall currency market. On an aggregate basis, there is significant negative CAAR at the 5 per cent level on Days 2, 3 and 6 for winners. The negative CAAR of 0.11 per cent for Day 4 is significant at the 10 per cent level. The trend of negative returns begins on Day 1, though it is not significant, and lasts until Day 15. For negative events, the reversals are much more pronounced. Significant CAAR is noted for the first eight days immediately after the event. This indicates a violation of the weak form efficient market hypothesis, thus
rejecting H4. CAAR for Days 1, 2, 3 and 4 are significant at the 1 per cent level. Days 6 and 7 experience significant positive CAAR based on a 5 per cent level of significance whereas Days 5 and 8 are marginally significant
at the 10 per cent level. In addition to the standard t-test, the Wilcoxon signed rank test1 generally affirms the significance of the returns. The positive returns persist for the entire 15 days post-event period, but are
not significant after Day 8.
Although the results seemingly vary from country to country, on an aggregate basis there are persistent reversals for both winners and losers for the 21 currencies. Assuming the 21 currencies provide an adequate representation of the currency market, this provides evidence that the currency market as a whole overreacts to unexpected information. On average, there is substantial evidence in support of the overreaction hypothesis (H1a).
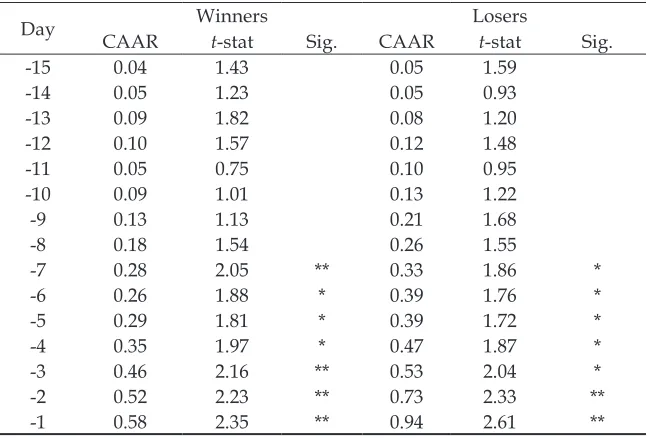
Pre-event returns are also reported in Panel B of Table 4. This study
finds that winners tend to exhibit significant positive CAAR from Days
-7 to -1. In particular, the return on the day immediately preceding the
event is statistically and economically significant with CAAR of 0.58 per
cent. The positive returns prior to the event day suggest information
leakage. As in winners, losers also experience significant CAAR from
Days -7 to -1. In terms of losers, pre-event returns are surprisingly positive. The direction of the pre-event returns is different from that of event day
return. As such, the pre-event CAAR cannot be attributed to information leakage. The cause of the significant pre-event CAAR is a puzzle and
requires further examination.
Table 4: Aggregate CAAR for Winners and Losers
Panel A: Post-Event
Panel B: Pre-Event
*, ** and *** indicate significance at the levels of 10%, 5% and 1% respectively.
Day Winners Losers
CAAR t-stat Sig. CAAR t-stat Sig.
1 -0.03 -0.85 0.15 3.43 ***
2 -0.14 -2.64 ** 0.18 3.52 ***
3 -0.11 -2.07 ** 0.15 2.72 ***
4 -0.11 -1.75 * 0.14 2.72 ***
5 -0.11 -1.49 0.11 2.02 *
6 -0.14 -2.04 ** 0.15 2.07 **
7 -0.11 -1.64 0.20 2.60 **
8 -0.06 -0.83 0.16 1.85 *
9 -0.05 -0.62 0.15 1.63
10 -0.01 -0.07 0.16 1.66
11 -0.03 -0.31 0.16 1.51
12 -0.07 -0.78 0.15 1.40
13 -0.07 -0.81 0.14 1.26
14 -0.05 -0.53 0.13 1.06
15 -0.02 -0.17 0.12 1.04
Day CAAR Winnerst-stat Sig. CAAR Loserst-stat Sig.
-15 0.04 1.43 0.05 1.59
-14 0.05 1.23 0.05 0.93
-13 0.09 1.82 0.08 1.20
-12 0.10 1.57 0.12 1.48
-11 0.05 0.75 0.10 0.95
-10 0.09 1.01 0.13 1.22
-9 0.13 1.13 0.21 1.68
-8 0.18 1.54 0.26 1.55
-7 0.28 2.05 ** 0.33 1.86 *
-6 0.26 1.88 * 0.39 1.76 *
-5 0.29 1.81 * 0.39 1.72 *
-4 0.35 1.97 * 0.47 1.87 *
-3 0.46 2.16 ** 0.53 2.04 *
-2 0.52 2.23 ** 0.73 2.33 **
Overall, this study finds support for the overreaction hypothesis,
underreaction hypothesis, and also uncertain information hypothesis. In addition, the evidence also seems to suggest the existence of investor over-optimism. The presence of reversals and continuations in
post-event CAAR seems to be dependent on the currency. However, this study finds that, on average, the foreign exchange market overreacts.
This suggests that investors tend to overestimate the impact of positive and negative news, thereby causing overreaction and subsequently
reversals to occur. The findings provide evidence against the efficient
market hypothesis (EMH) and adds to the existing evidence on overreaction.
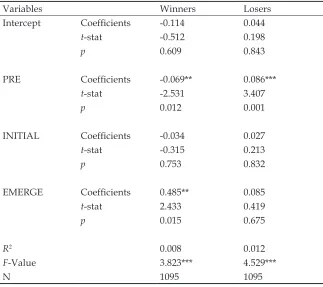
5.2. Results of Multiple Regression
Table 5 provides the results of multiple regression using equation 4 for the total sample of winners (excluding Albania and Uganda). The adjusted R2 value indicates that the model can only account for about
0.8 per cent of the variation in post-event CAR. The significant F value
of 3.823 indicates that the model is significant, at 1 per cent level. The F value and R2 value taken together provide indications of a weak, albeit
statistically significant regression model.
The coefficients of PRE and EMERGE are both statistically significant. The coefficient of PRE is negative which indicates that higher
levels of leakage lead to a higher level of overreaction. Hence, there is support for the private information leakage hypothesis. Contrary to
expectations, the EMERGE dummy variable has a positive coefficient. The coefficient of 0.485 is statistically significant at the 5 per cent
level. This suggests that currencies of emerging countries experience a lower post-event reversal than that of developed countries. As such, H5 (currency liquidity hypothesis) is not supported for winners. The
coefficient of INITIAL is negative, but is not statistically significant.
Therefore it can be concluded that initial price change does not affect
post-event CAR. The magnitude effect (H1b) is rejected for winners. Table 5 also provides the results of multiple regression on the total sample of losers (excluding Albania and Uganda). The adjusted R2 value indicates that the model explains 1.2 per cent of the variations in dependent variable. Analysis of variance (ANOVA) reveals that
H6, that is, a higher level of leakage affects the level of overreaction.
The coefficient of PRE, 0.086, is statistically significant at the 1 per cent level of significance. The findings corroborate those of Larson and
Madura (2001). However, the pre-event returns are not in the same
direction as the event (as indicated in Table 4). The significant pre-event
returns cannot be attributed to information leakage. Hence, the leakage certainty hypothesis and private information leakage hypothesis are not supported. Nevertheless, the impact of pre-event returns on overreaction
is undeniable given the statistical significance of the coefficient of PRE. The sign of the coefficient of INITIAL and EMERGE are both positive. The sign of EMERGE is as expected, but not for INITIAL. However, neither variable has any significant impact on the dependent variable. *, ** and *** indicate significance at the 10%, 5% and 1% levels respectively.
Variables Winners Losers
Intercept Coefficients -0.114 0.044
t-stat -0.512 0.198
p 0.609 0.843
PRE Coefficients -0.069** 0.086***
t-stat -2.531 3.407
p 0.012 0.001
INITIAL Coefficients -0.034 0.027
t-stat -0.315 0.213
p 0.753 0.832
EMERGE Coefficients 0.485** 0.085
t-stat 2.433 0.419
p 0.015 0.675
R2 0.008 0.012
F-Value 3.823*** 4.529***
N 1095 1095
Given that INITIAL and EMERGE variables are statistically insignificant,
H1b and H5 are rejected for losers.
Overall, this study finds no evidence of magnitude effect; initial return does not influence the degree of overreaction. Moreover, currency
liquidity hypothesis (H5) is also rejected for winners and losers. Not only is H5 not supported for winners, surprisingly, evidence to the contrary is found. Emerging market currencies tend to overreact to a lesser extent to positive events than developed market currencies. Similar to Larson
and Madura (2001), this study finds that pre-event returns do dictate the
level of overreaction. For losers, pre-event returns lead to lower level of overreaction. On the other hand, pre-event leakage leads to a higher level of overreaction for winners.
6. Conclusion
With reference to the 15-day CAAR of individual currencies, this study finds a preponderance of support for uncertain information hypothesis
and to a lesser extent underreaction hypothesis and overreaction
hypothesis. There is no support for the efficient market hypothesis. This study finds that seven currencies exhibit overreaction for winners
and underreaction or non-negative returns for losers. This indicates over-optimism of investors when assessing favourable (positive) and unfavourable (negative) events.
The aggregate foreign exchange market data provides evidence in support of the overreaction hypothesis. However, results of cross-sectional regression negate the magnitude effect which contends that higher levels of initial price change results in higher levels of overreaction. In terms of overreaction hypothesis, directional effect is supported, but the magnitude effect is rejected.
An interesting and perhaps disturbing revelation, as in previous
studies such as Larson and Madura (2001), is the presence of significant
abnormal returns on days antecedent to the initial event. Information leakages prior to the event have been suggested as a cause of the
observed abnormal returns. However, this study finds that pre-event returns are surprisingly positive for losers. As such, the pre-event CAAR
is not attributed to information leakage. Further investigation reveals
a significant relationship between pre-event returns and post-event
lower degree of overreaction for losers. However, this does not offer support for the leakage certainty hypothesis as the pre-event returns
are not in the same direction as the event. This study also finds that
emerging markets do not overreact more than developed markets. Thus, the liquidity hypothesis is not supported. Less liquid currencies do not exhibit a greater degree of overreaction.
Implications of this study are immense. They provide evidence that overreaction occurs not only in the stock market but also in the currency market. Investors dealing in the currency market are equally susceptible to behavioural biases. Evidence of overreaction refutes
even the weak form of efficient market hypothesis (EMH). Evidence
presented in this and other studies such as Cox and Peterson (1994) and Parikakis and Syriopoulos (20008), suggests that prices have
significant information content, making it worth examining past price data. Return predictability may be profitably exploited by forming
a trading strategy that incorporates both momentum and contrarian strategies. Though short-term predictability is established, it is pertinent
to note that transaction costs may erode any abnormal profit and thus
making it uneconomical to arbitrage. Further studies may need to
be conducted to examine whether profits of the trading strategy will
diminish substantially after incorporating transaction costs. Although
calendar anomalies may not have much influence, researchers may
need to ascertain whether these variables truly do not have a bearing on the returns.
References
Ajayi, R.A., & Mehdian, S. (1994). Rational investors’ reaction to uncertainty: Evidence from the world’s major markets. Journal of Business Finance and Accounting, 21(4), 533-545.
Atkins, A.B., & Dyl, E.A. (1990). Price reversals, bid-ask spreads, and market efficiency. Journal of Financial and Quantitative Analysis, 25, 535-547. Barber, B.M., & Lyon, J.D. (1997). Detecting long-run abnormal returns: The
empirical power and specification of test statistics. Journal of Financial Economics, 43(3), 341–72.
Brown, K.C., Harlow, W.V., & Tinic, S.M. (1988). Risk aversion, uncertain information, and market efficiency. Journal of Financial Economics,
22(2), 355-385.
Brown, S.J., & Warner, J.B. (1980). Measuring security price performance. Journal of Financial Economics, 8, 205-258.
Calvo, G., & Reinhart, C. (2002). Fear of floating. Quarterly Journal of Economics,
Chang, E., Pinegar, M., & Ravichandran, R. (1993). International evidence on the robustness of the day-of-the-week effect. Journal of Financial and Quantitative Analysis, 28(4), 497-513.
Cheung, Y-W., Chinn, M. & Pascual, A. (2005). Empirical exchange rate models of the nineties: Are any fitt to survive? Journal of International Money and Finance, 24, 1150-1175.
Cox, D.R., & Peterson, D.R. (1994). Stock-returns following large one-day declines: Evidence on short-term reversals and longer-term performance. Journal of Finance, 49, 255-267.
DeBondt, W.F.M., & Thaler, R. (1985). Does the stock market overreact? Journal of Finance, 40, 793-805.
Dissanaike, G., & Le Fur, A. (2003). On the use of the log CAR measure in event studies. Journal of Business Finance & Accounting, 30(7-8), 1165-1170. Du, D. (2013). General equilibrium pricing of currency and currency options.
Journal of Financial Economics, 110(3), 730–751.
Dubois, M., & Louvet, R. (1996). The day-of-the-week effect: The international evidence. Journal of Banking and Finance, 20, 1463-1484.
Fabozzi, F.J., Fung, C-Y., Lam, K., & Wong, W-K. (2013). Market overreaction and underreaction: Tests of the directional and magnitude effects. Applied Financial Economics, 23(18), 1469-1482.
Himmelmann, A., Schiereck, D., Simpson, M.W., & Zschoche, M. (2012). Long-term reactions to large stock price declines and increases in the European stock market: A note on market efficiency. Journal of Economics and Finance,
36(2), 400-423.
Kahneman, D., & Tversky, A. (1982). Intuitive prediction: Biases and corrective procedures. In D. Kahneman, P. Slovic, & A. Tversky (Eds.), Judgement under Uncertainty: Heuristics and Biases (pp. 414-421). Cambridge: Cambridge University Press.
Keynes, J.M. (1964). The General Theory of Employment, Interest and Money. New York: Harcourt, Brace and World.
Kohers, G., Kohers, N., Pandey, V., & Kohers, T. (2004). The disappearing day-of-the-week effect in the world’s largest equity markets. Applied Economics Letters, 11, 167-171.
Klößner, S., Becker, M., & Friedmann, R. (2012). Modeling and measuring intraday overreaction of stock prices. Journal of Banking and Finance,36(4), 1152–1163. Kothari, S.P., & Warner, J. (1997). Measuring long-horizon security price
performance. Journal of Financial Economics, 43(3), 301–39.
Kwok, C.C.Y., & Brooks, L.D. (1990). Examining event study methodologies in foreign exchange markets. Journal of International Business Studies,
21, 189-225.
Larson, S.J., & Madura, J. (2001). Overreaction and underreaction in the foreign exchange market. Global Finance Journal, 12, 153–177.
Liu, H-C., & Witte, M.D. (2013). Price clustering in the U.S. Dollar/Taiwan Dollar swap market. Financial Review, 48(1), 77–96.
Lobe, S., & Rieks, J. (2011). Short-term market overreaction on the Frankfurt Stock Exchange. The Quarterly Review of Economics and Finance, 51(2), 113–123. Maher, D., & Parikh, A. (2011). Short-term under/overreaction, anticipation or
uncertainty avoidance? Evidence from India. Journal of International Financial Markets, Institutions & Money, 21(4), 560–584.
Manzan, S., & Westerhoff, P. (2005). Representativeness of news and exchange rate dynamics. Journal of Economic Dynamics and Control, 29(4), 677–689. Mazouz, K., Joseph, N.L., & Palliere, C. (2009). Stock index reaction to large price
changes: Evidence from major Asian stock indexes. Pacific-Basin Finance
Journal, 17, 444–459.
Parikakis, G.S., & Syriopoulos, T. (2008). Contrarian strategy and overreaction in foreign exchange markets. Research in International Business and Finance,
22(3), 319-324.
Pierdzioch, C., Rülke, J.C., & Stadtmann, G. (2012). A note on forecasting emerging market exchange rates: Evidence of anti-herding. Review of International Economics, 20(5), 974–984.
Rezvanian, R., Turk, R.A., & Mehdian, S.M. (2011). Investors’ reactions to sharp price changes: Evidence from equity markets of the People’s Republic of China. Global Finance Journal, 22(1), 1–18.
Savor, P.G. (2012). Stock returns after major price shocks: The impact of information. Journal of Financial Economics, 106, 635–659.
Spyrou, S., Kassimatis, K., & Galariotis, E. (2007). Short-term overreaction, underreaction and efficient reaction: Evidence from the London Stock Exchange. Applied Financial Economics, 17, 221–235.
Tabachnick, B.G., & Fidell, L.S. (2001). Using Multivariate Statistics. Needham Heights, MA: Allyn & Bacon.
Thaler, R.H. (1999). The end of behavioral finance. Financial Analysts Journal,
55(6), 12-17.
Yamori, N., & Kurihara, Y. (2004). The day-of-the-week effect in foreign exchange markets: multi-currency evidence. Research in International Business Finance,