2)University of Electronic Science and Technology of China, Chengdu 610054, China
(Received 19 November 2013/Accepted 30 April 2014)
Microwave imaging reflectometry (MIR) and electron cyclotron emission imaging (ECEI) systems have been developed on the HL-2A tokamak to visualize the density and temperature fluctuations. The MIR system is comprised of a quasi-optical system, a four frequency microwave source and receiver system that generate 8(poloidal)×4(radial)×2(toroidal)=64 channel images of density fluctuations. The ECEI system is comprised of a quasi-optical system, a front-end 24 channel heterodyne imaging array with a tunable RF from 75 to 110 GHz, and a set of back-end ECEI electronics that together generate 24(poloidal)×8(radial)=192 channel images of the 2D temperature fluctuations. Characteristics of both systems are presented. Simulations and laboratory tests of both optical systems have been conducted. The test results are in good agreement with simulations.
c
2014 The Japan Society of Plasma Science and Nuclear Fusion Research
Keywords: microwave imaging, MIR, ECEI DOI: 10.1585/pfr.9.3402123
1. Introduction
Measurements of the instabilities in magnetically con-fined fusion plasmas have challenged scientists for many years. Various diagnostics have been developed to measure the plasma fluctuation in different ways and detect infor-mation on the instabilities [1–3]. Among them, magnetic pick-up coils, soft x-ray (SXR) detector arrays, probes, reflectometer, and electron cyclotron emission (ECE) ra-diometers are the most widely used diagnostics to mea-sure magneto-hydro-dynamic (MHD) instabilities and tur-bulence. To view the two/three-dimensional (2D/3D) spa-tial distribution and temporal evolution of the fluctua-tions, many diagnostics have extended their capabilities to 2D/3D measurement, such as the x-ray imaging camera, phase contrast imaging (PCI) and different probe arrays. Recently, microwave imaging diagnostics, i.e. electron cy-clotron emission imaging (ECEI) and microwave imaging reflectometry (MIR), with the advantages of local measure-ments of the plasma temperature and density fluctuations, and lack of plasma perturbations, have attracted intensive interest by physicists [4, 5]. Both MIR and ECE systems have been proven to be powerful tools for plasma fluctua-tion measurements in several machines, including DIII-D, KSTAR, EAST, AUG, and LHD [3, 6–8].
author’s e-mail: [email protected]
∗)This article is based on the presentation at the 23rd International Toki Conference (ITC23).
Based on the experience with the previous ECEI/MIR systems, an 8(poloidal)×4(radial)×2(toroidal)=64 MIR system and a 24(poloidal)×8(radial)=192 ECEI system have been designed and tested for the HL-2A tokamak [9]. The ECEI instrument is the third generation system with improvements in dual dipole antennas, mini-lenses, zoom optics, and electronics [5,10,11]. The MIR system is com-prised of a U-shaped 2D horn mixer array at the focal plane and each mixer is driven directly by the local oscillator (LO). Both systems will separately utilize the same port window with a height of 600 mm and width of 100 mm, lo-cated 662 mm from the plasma center. Two H-plane lenses are designed in the optical system to ensure a good focus in the H-plane direction. This paper is organized as follows: The system design and preliminary test results of the MIR and ECEI instruments are presented in Sections 2 and 3, respectively. The summary and future plans are given in Section 4.
2. Microwave Imaging Reflectometry
The MIR system is comprised of a quasi-optical sys-tem which is based on Gaussian beam optics, a four fre-quency microwave transmitter source and receiver system that generate 8(poloidal) × 4(radial) ×2(toroidal) =64 channel images of the density fluctuations in the HL-2A plasma.
The MIR optics system is used to launch the probe
c
2014 The Japan Society of Plasma
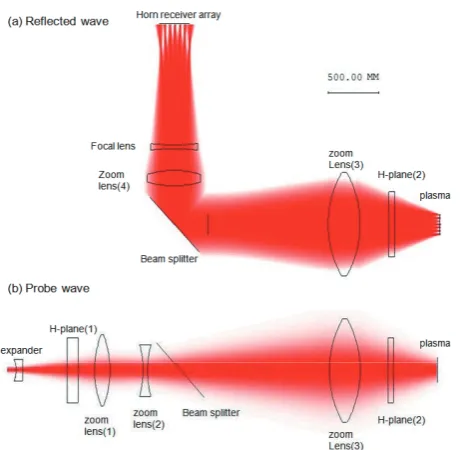
Fig. 1 Simulation of MIR optics, (a) the reflected wave and (b) the probe wave.
wave to the cutoff surface and focus the reflected wave from the cutoffsurface onto the receiver array. Figure 1 shows simulation of the probe wave and the reflected wave for MIR on HL-2A. The MIR optics consists of eight lenses and one beam splitter. They are E and H expanders, two H-plane lenses, four zoom lenses, and one focusing lens, marked in Fig. 1. The microwave signal launched from the antenna is expanded by the E and H expanders, and subsequently illuminates the target plasma through the zoom system, which is composed of three E-plane lenses denoted as zoom lens (1,2,3). Two H-plane lenses are de-signed in the optical system to ensure a good focus in the H-plane direction. The reflected wave from the plasma is separated from the probe wave by the beam splitter. The reflected wave is then focused onto the receiver ar-ray by the focal lens. The image surfaces are designed at
R =195 - 205 cm, which corresponds to a normalized ra-dius ofr/a = 0.75 - 1 at the low field side (LFS) of the tokamak. Figure 1 (a) shows the Gaussian beam tracing of the reflected wave. A U-shaped focal surface is observed near the horn receiver array. This is caused by the aberra-tion effect of the optical system. We can adjust the width and shape of the focal plane to match the receiver surface by using the focusing lens.
Figure 2 shows schematic diagram of the four fre-quency MIR microwave transmitter and receiver system. The four frequencies at 8, 8.5, 9, and 9.5 GHz are gen-erated from low noise crystal oscillators utilizing phase-locked loop technology. The four frequencies are sep-arately quadrupled and amplified up to+23 dBm. High frequency-stable microwave signals with frequencies of 32, 34, 36, and 38 GHz are obtained. Then the four mi-crowave signals are combined in a low insertion loss (IL)
Fig. 2 Four frequency microwave transmitter and receiver sys-tem.
multiplexer (IL< 2.5 dB). Finally, the microwave signal with power>+20 dBm is launched into the target plasma via the optical system as an illuminating probe wave.
The four microwave signals are also separately cou-pled to four 16-way power dividers by using four direc-tional couplers. These coupled signals are used as the ref-erence signals, which are amplified to+17 dBm to drive the quadrature mixers. Each detector is driven by the ref-erence signal directly. As a result, only one beam splitter is required in the optical system shown in Fig. 1.
The reflected waves from the cutoff surfaces in the plasma are focused via the same optical system onto the horn receiver array (HRA). The HRA is composed of 8 (poloidal)×2 (toroidal) horn antennas. As shown in Fig. 1, the focal plane is a U-shaped surface obtained from simula-tion and modified by laboratory test. The antennas should be installed on the U-shaped focal surface. To match the focal surface, each antenna is designed to be adjusted in the vertical and horizontal directions. The received wave is amplified and then divided into four channels in a wide-band 4-way power divider. Four wide-band-pass filters with pass frequencies of 32, 34, 36, and 38 GHz are used to separate the reflected waves from the different cutoff sur-faces. Then, the four reflected frequencies are separately demodulated with the reference signals in the quadrature detectors. The reflected wave can be written asAeiφeiωt, whereω is the launching frequency, andA andφ repre-sent the amplitude and the phase caused by density fluctu-ation, respectively. In the quadrature detector, the in-phase (I ∝ Acos(φ)) and the quadrature (Q ∝ Asin(φ)) signals are finally obtained. The IQ signals are low pass filtered with a bandwidth of 1 MHz and video amplified. Finally, the IQ signals are converted to digital signals by 16 bit dig-itizers, capable of storing 1.25 Msamples per channel at a maximum sampling rate of 1.25 Msamples/s.
assess-ment of the imaging performance. Figure 3 shows the power profiles of the MIR reflected wave at the focal sur-face by using a metal rod moving in the poloidal direc-tion and in the toroidal direcdirec-tion at the target edge plasma (R = 195 cm). The peak profile is clearly observed and the width of the beam is about 2 cm. This means that the poloidal resolution is about 2 cm. The radial resolution is determined by the density profile. For the density profile
ne=3.5×10¹⁹(1−r2) m−3on HL-2A, the radial resolution
is about 1.5 cm. At the focal position, the power profile is a Gaussian distribution. As shown in Fig. 1, the focal surface is not on a flat plane. In this test, the antenna is arranged in a flat plane. As a result, the side lobes of the power profile become stronger for the channels away from the optical axis. By scanning the 2D power distribution around the focal surface, the focal position of each channel can be obtained, and a clear image of the cutoffsurface can be detected at the focal position.
3. Electron Cyclotron Emission
Imag-ing
The ECEI system is comprised of three sub-systems: a quasi-optical system which is based on Gaussian beam optics, a front-end 24 channel heterodyne imaging ar-ray, and a set of back-end ECEI electronics that together generate 24× 8 =192 channel images of the temperature fluctuations in the HL2A plasma. A Wband (75 -110 GHz) backward wave oscillator (BWO) with a power of+20 dBm is used as the LO source to drive the imag-ing array. As a result, the system can measure temperature fluctuations over a wide variation in toroidal field ranging from 1.2 to 2.2 Tesla.
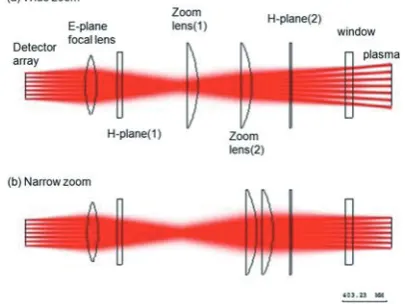
The quasi-optical ECEI system is composed of LO op-tics and RF opop-tics. The LO opop-tics are used to illuminate the microwave local oscillator (LO) signal on the mixer ray. The LO beam is adjusted to cover the entire mixer ar-ray, and the power should be sufficiently high to appropri-ately drive all the mixers. The RF optics are used to focus the RF signals emanating from the plasma onto the mini-lenses in front of the mixer array. It consists of 5 mini-lenses, namely E-plane focus (E1), two H-plane lenses, and two zoom lenses. The RF optics can work at both wide zoom
Fig. 4 Simulation of the ECEI optics. (a) wide zoom, (b) narrow zoom.
Fig. 5 Schematic of the ECEI receiver system on HL-2A.
and narrow zoom, with the 5 lenses located at different po-sitions. The wide zoom has a vertical resolution of 2.3 cm. It is designed to provide a large viewing coverage of the plasma with a vertical height of 55 cm. The narrow zoom has a vertical resolution of 1.7 cm. It is designed to view small fluctuation structures in the plasma with a vertical height of 40 cm. Figure 4 shows an example of the RF op-tics in the case of (a) wide zoom and (b) narrow zoom. In this simulation, the image surfaces located atR=198 cm, are at the low field side (LFS). It is observed that the wide zoom has larger vertical coverage compared with the nar-row zoom.
Fig. 6 Profiles of the measured signal under (a) in-focus and (b) out-of-focus in the case of narrow zoom, (c) the in-focus region of narrow zoom when RF to H2 is 93 cm. (d) the in-focus region of wide zoom when RF to H2 is 110 cm.
or fLO =3.32, 4.0, 4.6, 5.2, 5.8, 6.4, 7.0, and 7.7 GHz,
with almost equal frequency spacing switching between 900 MHz and 600 MHz. The IF frequency spacingΔfIF
de-termines the radial resolution (Δr∼ΔfIF/Bt), which
corre-sponds to 2 or 1.3 cm for frequency spacings of 900 MHz and 600 MHz, respectively, atBt = 1.3 Tesla. The
sec-ond down-converted signals are band-pass filtered with a pass band of 5 - 350 MHz. Then, the signals are amplified, detected, and then low noise amplified, low-pass filtered and video amplified. The video band width is controlled by a tenth order low-pass switched capacitor filter whose cutofffrequency can be selected among 50, 100, 200, and 400 kHz. Finally, the signals are converted to digital sig-nals by the 16 bit digitizers, which are the same system of MIR.
The focal plane of the ECEI optical system has been tested by varying the positions of the focal lens E1. In the test, we use an RF source with a power on the order of a nW as a surrogate for the plasma radiation. Figures 6 (a) and (b) show profiles of the measured signals under narrow zoom condition in the case of in-focus and out-of-focus, respectively. The LO frequency is 94.9 GHz and the RF frequency is 101.8 GHz. The RF source is located at 93 cm from the H2 lens, corresponding to the LFS (r = 30 cm) of the HL-2A plasma. When the optical system is adjusted to the optimum focal position, the measured signal at the focal plane has maximum amplitude with a narrow profile. The width of the measured signal becomes wider as the focal lens E1 is moved to the out-of-focus position. Fig-ures 6 (c) and (d) show the width of the reflected wave sig-nal as a function of the E1 position in the case of narrow zoom and wide zoom, respectively. The best focus can be obtained at the minimum width of the reflected wave.
The optical system can be calibrated by varying the RF position and the focal lens E1 position. Tests at
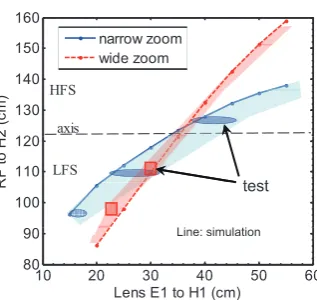
dif-Fig. 7 Calibration of the RF optics at narrow zoom and wide zoom by varying the positions of the focal lens E1 and the RF source.
ferent RF positions have been carried out in the case of narrow zoom and wide zoom. Figure 7 shows the focal position under narrow zoom and wide zoom by moving the positions of the focal lens E1 and the RF source. The lines represent the simulation and the shaded area denotes the laboratory test. The blue solid line denotes the narrow zoom condition and the red dashed line denotes the wide zoom condition. The measured values are in good agree-ment with the simulations. Compared with the wide zoom, the narrow zoom is not sensitive to E1 position. This is be-cause the beam width in the wide zoom case is wider than that in the narrow zoom (see Figs. 6 (c), (d)). The size of the ECEI detector array is fixed. This adds a better flexibil-ity to the E1 position in narrow zoom. Tests with different RF frequencies have also been conducted. We found that the position of the focal lens E1 is not sensitive to the RF frequency in the range from 90 GHz to 102 GHz.
4. Summary and Future Plans
In this work, an 8(poloidal)×4(radial)×2(toroidal) =64 channel MIR system and a 24(poloidal)×8(radial)= 192 channel ECEI system have been designed and tested for the HL-2A tokamak. The MIR antenna system is a 2D horn mixer array which is installed on the U-shaped focal surface obtained by simulation and laboratory test. The mixers are driven directly by the local oscillator. As a result, only one beam splitter is used in the optical system. This system can provide 64-channel (8 vertical by 4 radial and by 2 toroidal) images of the density fluctuations. The spatial resolution is vertically∼2 cm and radially∼2 cm.
optical systems will be carried out on the next generation of microwave imaging systems in SWIP.
This work is supported by Chinese National Fu-sion Project for ITER under Grant No. 2013GB107000, 2013GB104000, and 2014GB107001, the National Nat-ural Science Foundation of China under Grant No. 11005037 and 11261140326, and the US DOE Grant DE-FG-02-99ER54531
[8] T. Munsat, E. Mazzucato, H. Parket al., Rev. Sci. Instrum.
74, 1426 (2003).
[9] X.R. Duan, J.Q. Dong, L.W. Yan et al., Nucl. Fusion 50,
095011 (2010).
[10] M. Jiang, Z.B. Shi, N.C. Luhmann, Jr.,et al., Rev. Sci.
In-strum.84, 113501 (2013).
[11] P. Zhang, C.W. Domier, T. Lianget al., Rev. Sci. Instrum.