Analysis of Machine Learning Algorithms for
Breast Cancer Data
P. Susmitha1, B. Prajna2
M.Tech Scholar, Department of Computer Science & Systems Engineering, Andhra University College of Engineering
(A), Visakhapatnam, India1
Professor, Department of Computer Science & Systems Engineering, Andhra University College of Engineering (A),
Visakhapatnam, India2
ABSTRACT: Breast cancer is the main disease which is leading the cause of deaths worldwide. The aim of this research is to present a report on breast cancer by using advanced methodologies to predict the breast cancer. We have developed and compared two machine learning techniques to classify the dataset WBCD (Wisconsin Breast Cancer Diagnosis) as either malignant or benign breast lumps. This dataset is widely used for research work because it is noise free and have less missing values. In this paper we have performed preprocessing to remove the noise and for optimized classification.The results are generated and stored in a table. The table contains precision, recall, f1-score and accuracy. Confusion matrix is also plotted for both the algorithms. The best accuracy achieved by logistic regression algorithm is 94.73% and by decision tree classification algorithm is 92.39%.
KEYWORDS: Machine Learning, Breast cancer, Logistic regression, Decision tree, WDBC Dataset
I.INTRODUCTION
Though there are various treatments for cancer yet it is a dangerous threat to human being, even detection of it is becoming difficult. In women mostly occurring cancer is breast cancer. Prior discovery of breast cancer can save many lives. Unconditional growth of cells in the breasts forms as lumps or tumor leading to breast cancer. It can be examined using an X-ray. Breast cancer mainly occurs in women whereas occurs rarely in men. Not all tumors lead to cancer. Around 7, 84, 821 died due to breast to cancer in which 3, 71,302 are women and 4, 13,519 are men. Over 25% of the cancers that occur in women are breast and oral cavity. There is a 30 % chance for curing of cancer at its early stage, where as it gets complicated for the further stages. Dr. William H. Wolb erg, physician at the University of Wisconsin Hospital at Madison, Wisconsin, USA created a dataset regarding breast cancer which is publicly available.Dr. Wolb erg used fluid samples that are collected from around 701 patients to create a dataset.
Machine learning can be widely categorized into three types namely Supervised Learning, Unsupervised Learning and Reinforcement Learning. Supervised learning can be performed based on the target variable from a given list of predictors. Unsupervised learning can be performed for clustering population in various groups. It doesn’t need any target variable. Reinforcement learning can be performed based on trial and error method. In this paper we have used supervised learning methods, one is logistic regression and other one is decision Tree. Logistic regression can be performed based on prior observations to predict data values. Decision tree classification can be performed based on the independent variable to make distinct groups. Using these two algorithms classification problems can be analyzed.
investigated that there are two distinct machine learning techniques for breast cancer diagnosis, those are the first one is Bayesian Networks and other algorithm is J48. Among two algorithms high accuracy was recorded in Bayesian Networks when compared to J48 algorithm [2]. Savita Kumari explored an innovative approach of Big Data has by using Hybrid SVM - RVM model by using dataset of WBCD. Disease specific results were better by application of SVM-RVM model with Big Data to Real time Data. SVM-RVM model is used for exploration of other types of cancer as well. [3]. Animesh Hazra et.al used modern machine learning techniques for cancer prediction and revealed that Naïve Bayes classifer gives the maximum accuracy of 97.3978% with only five dominant features [4]. Vivek Chaurasia et.al implemented a model using three distinct algorithms namely RBF Network, J48 and Naïve Bayes for breast cancer survivability by using UCI Machine learning repository [5].
III.THE DATASET
This publication uses the dataset that Dr. William H. Wolb erg, who was a physician at the University of Wisconsin Hospital at Madison, USA created, which is publicly available. The chronological grouping of the data was possible by the samples that were taken from his clinical cases that reflect the period. The data in the dataset taken is considered as noise free having 16 missing values which belongs to 16 different instances, from group 1 to 6.
The first step of the project is Pre-Processing of the data which mainly focuses on missing attributes management, unbalanced data and the number of attributes used for classifier training. To manage these missing 16 values two methods are used. The first method is “Replacement of missing values” which is used to replace the missing values for the attributes present in the dataset. The second method is removal of instances with missing values which results in the dataset having 683 instances.
The main purpose of visualization is to present the features of the data to predict the cancer is either malignant or benign and also to find out the general trends that was useful in model selection and Parameter selection. If we are to guess if a tumor is benign or malignant we must analyze the features and understand which feature has larger predictive value and which does not have predictive value.
IV.METHODOLOGY
Fig.2. Data flow diagram
4.1. Classification by Logistic regression
Logistic Regression and Decision Tree algorithms were performed in this work. The main evaluated attribute class is clump thickness and a total of 10 attributes of the data set were exercised during this experiment. To check the suitability of various variables in the Logistic regression several tests has been performed in the Logistic regression analysis i.e.,The tests are model fitting test, parameter estimation and classification. Model fitting test is to check whether all the variables are suitable to be used in the logistic regression.
Likelihood ratio statistic is used for analysis of Model fitting test. Likelihood ratio is defined as
Where LL (a) is the initial model for log-likelihood
LL (a, B) is the ending model for log-likelihood. Likelihood ratio is distributed chi-square with i degree of freedom.
Where m = 1,2,…,n.
To calculate the log-odd ratio, each event probability can be analyzed. Odds ratio measure the incidence when the independent variable increases by one unit. The ratio of odds can be defined as
Classification is to predict the patients breast cancer. From the calculated coefficients, the probability of each sample is calculated. The probability is defined as
P=(Y=m) = exp(𝑔(𝑥) 1+∑ exp(𝑔(𝑥))
While for the reference category
P=(Y=0) = 1
1+∑ exp(𝑔(𝑥))
4.2. Classification by Decision Tree
The decision tree classification is a supervised machine learning model which is used for inductive inference. The classification of the categorical data is based on various attributes represented in a decision tree. The huge number of data is processed in Decision tree learning method for further use in data mining techniques. Thus decision trees are easy to understand and analyze. Decision tree is constructed using both entropy and information gain. Top-down approach is used in decision tree construction in which contains the root node and the data which is divided into subsets contains the small instances of similar values.
For the construction of decision tree two types of entropies using frequency are calculated. The formulae for calculation of one attribute entropy is
The formulae for calculation of two attributes entropy is
The information gain is based on the decrease in entropy after a dataset is split on an attribute. Decision tree can be constructed based on the highest attribute information gain. It can be formulated as
𝑃(𝑌=𝑚)
𝑃(𝑌=0)= exp (β0 + ∑ = 1βpχp
𝑛
V.EXPERIMENTAL RESULTS
For performing the quantitative analysis of the methods taken, the performance metric value needed to be computed and they are to be compared with the other. Hence, for performing the calculations of the performance metric there are a few formulas which can be utilized for achieving the performance value from the dataset. The formulae for the calculation of the performance metrics are given below in table.
Table.1. quantitative analysis
METRIC FORMULA
Accuracy (TP+TN)/(TP+TN+FP+FN)
Error Rate 100 – Accuracy
Precision TP/(TP+FP)
Recall TP/(TP+FN)
F- Value 2/(1/P+1/R)
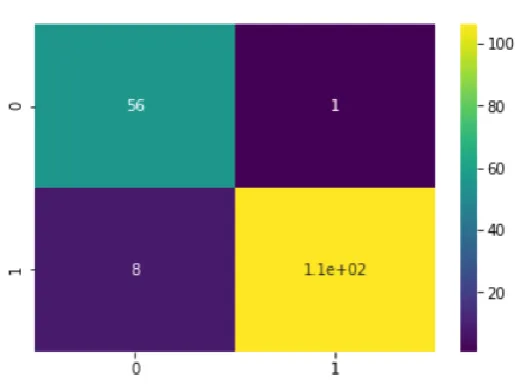
Logistic Regression Classification:
Table.2. Performance analysis
Precision Recall F1-Score Support
0.00 0.88 0.98 0.93 57
1.0 0.99 0.93 0.96 114
Micro avg 0.95 0.95 0.95 171
Macro avg 0.93 0.96 0.94 171
Weighted avg 0.95 0.95 0.95 171
Fig. 3. Confusion matrix of Logistic Regression
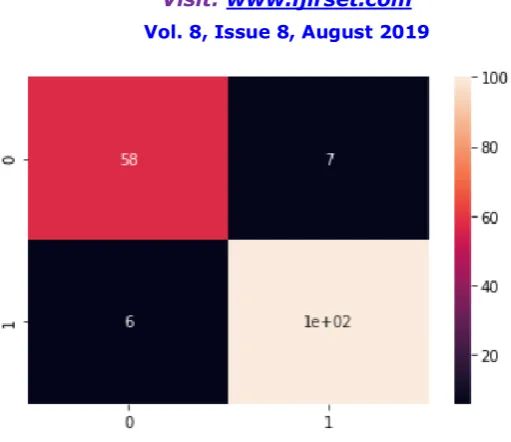
Decision Tree Classification:
Table.3. Performance analysis
Precision Recall F1-Score Support
0.0 0.91 0.89 0.90 65
1.0 0.93 0.94 0.94 106
Micro avg 0.92 0.92 0.92 171
Macro avg 0.92 0.92 0.92 171
Weighted avg 0.92 0.92 0.92 171
Fig. 4. Confusion matrix of Decision Tree
VI.CONCLUSIONS
In this paper we have analyzed breast cancer dataset using two basic machine learning algorithms. The first algorithm logistic regression gives good results and good accuracy (94.73%) when dealing with imbalanced data but before that we have done preprocessing for to replace missing values and to remove noise from the given data. So that classification can be performed well. The second algorithm gives good results and good accuracy (92.39%) but less performance when compared to logistic regression algorithm. It is happened because it is a tree algorithm and gives worse accuracy when dealing with imbalanced datasets. We extend this research work to improve accuracy and to use advanced methodologies for various datasets.
REFERENCES
[1] Vivek Kumar, Brojo Kishore Mishra, Manuel Mazzara, Dang N. H. Thanh and Abhishek Verma, ” Prediction of Malignant & Benign Breast Cancer: A Data Mining Approach in Healthcare Applications”.
[2] Borges, Lucas Rodrigues, “Analysis of the Wisconsin Breast Cancer Dataset and Machine Learning for Breast Cancer Detection”,Proceedings of XI Workshop de Visão Computacional ‐ October 05th‐07th, 2015.
[3] Dr. Savita Kumari Sheoran, “Breast Cancer Classification using Big Data Approach”, Volume-7 | Issue-1 | January-2018.
[4] Animesh Hazra, Subrata Kumar Mandal, Amit Gupta, “Study and Analysis of Breast Cancer Cell Detection using Naïve Bayes, SVM and Ensemble Algorithms”,International Journal of Computer Applications (0975 – 8887) Volume 145 – No.2, July 2016.
[5] Vikas Chaurasia, Saurabh Pal, BB Tiwari, “Prediction of benign and malignant breast cancer using data mining techniques”, Journal of Algorithms & Computational Technology ,February 20, 2018.
[6] https://towardsdatascience.com/building-a-simple-machine-learning-model-on-breast-cancer-data-eca4b3b99fa3
[7 Wenbin Yue,Zidong Wang, Hongwei Chen, and Annette Payne 1 and Xiaohui Liu, Machine Learning with Applications in Breast Cancer Diagnosis and Prognosis, 9 May 2018
[8] https://www.kaggle.com/lbronchal/breast-cancer-dataset-analysis
[9] Ronak Sumbaly, N. Vishnusri, S. Jeyalatha, Diagnosis of Breast Cancer using Decision Tree Data Mining Technique, International Journal of Computer Applications (0975 – 8887) Volume 98– No.10, July 2014