Mapping and QTL analysis of the barley population Sloop × Halcyon
9
0
0
Full text
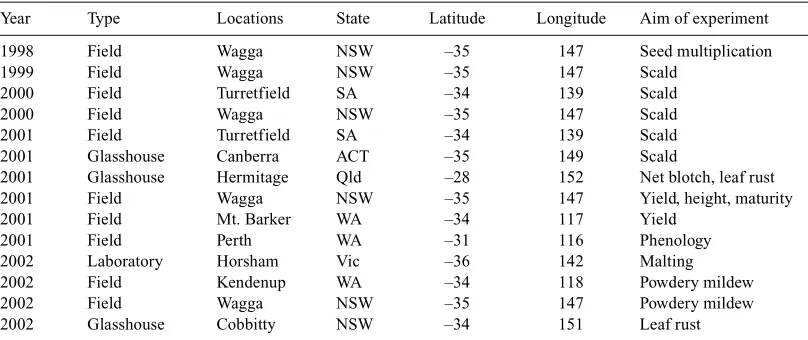
(2) 1146. Australian Journal of Agricultural Research. Table 1.. B. J. Read et al.. Locations of sites, and aim of experiment from the Sloop × Halcyon mapping population. Year. Type. Locations. State. Latitude. Longitude. 1998 1999 2000 2000 2001 2001 2001 2001 2001 2001 2002 2002 2002 2002. Field Field Field Field Field Glasshouse Glasshouse Field Field Field Laboratory Field Field Glasshouse. Wagga Wagga Turretfield Wagga Turretfield Canberra Hermitage Wagga Mt. Barker Perth Horsham Kendenup Wagga Cobbitty. NSW NSW SA NSW SA ACT Qld NSW WA WA Vic WA NSW NSW. –35 –35 –34 –35 –34 –35 –28 –35 –34 –31 –36 –34 –35 –34. 147 147 139 147 139 149 152 147 117 116 142 118 147 151. winter wheats with a vernalisation requirement are favoured because of their flexibility in planting times. Early-maturing barleys having a similar vernalisation requirement, good malting quality, and resistance to multiple diseases, especially to scald (Rhynchosporium secalis), net form of net blotch (NFNB—Pyrenophora teres f. teres), leaf rust (Puccinia hordei), and powdery mildew—(Erysiphe graminis f. sp. hordei), would give a cropping option for early sowings. Halcyon has been an accepted malting variety on the UK recommended list from 1985 until 2000, when it was still 4% of receivals by maltsters in the UK. Although European winter barleys have increased in popularity because of their high yields, they have generally been inferior in malting quality to contemporary European spring barleys. Halcyon’s features include winter growth habit, ‘intrinsic lateness’, and resistance to foliar diseases, particularly durable resistance to leaf scald. This variety was bred by the Plant Breeding Institute, Cambridge, England from the cross Warboys × Maris Otter. Sloop is an Australian malting variety, bred by R. C. M Lance, D. H. B. Sparrow, and A. R. Barr in South Australia and released in 1995 for commercial cultivation (Barr 1998). To exploit the novel alleles associated with various components of phenology, malting quality, and resistance to foliar diseases, a cross between Sloop (spring type) and Halcyon (winter type) was made. This paper reports the construction of a linkage map and identification of major and quantitative trait loci associated with traits of interest especially to Australian barley breeding programs. Materials and methods Population development The cross between Sloop and Halcyon was made at the Wagga Wagga Agricultural Institute by B. J. Read in 1996. The doubled haploid population (DH) comprising 166 lines was developed in 1997 from F1 plants using the microspore culture method (P. A. Davies, pers. comm.) at Wagga Wagga.. Aim of experiment Seed multiplication Scald Scald Scald Scald Scald Net blotch, leaf rust Yield, height, maturity Yield Phenology Malting Powdery mildew Powdery mildew Leaf rust. SNP marker analysis PCR primers were designed around a single nucleotide polymorphism (SNP) site in a P450 gene. The product contained an AflII restriction site in Sloop but not in Halcyon. The AflII site spanned the SNP. PCR was followed by AflII digest and products were visualised on ethidium bromide stained agarose gel. Linkage map construction The linkage map was constructed using AFLP (Vos et al. 1995), RFLP, microsatellite (Saghai-Maroof et al. 1994; Liu et al. 1996; Struss and Plieske 1998; Ramsay et al. 2000; Holton et al. 2002), and SNP based markers as described by Barr et al. (2003, this issue). AFLP markers were visualised using 2 methods. These were radio-labelling with [γ32P] ATP, and fluorescent tagging of the oligonucleotide primers. AFLPs visualised by radio-labelling have names ending in numerals below 12, indicating the locus number, whereas fluorescently visualised AFLPs have standard KeyGene nomenclature. Phenotypic data collection The DH population was screened for various traits under field and glasshouse conditions for identification of QTLs associated with these attributes (Table 1). Field observations were made on basic vegetative phase (BVP), awn emergence, response to extended photoperiod, spring or winter habit, and the level of leaf disease infection by pathogens: Rhynchosporium secalis, Pyrenophora teres f. teres, Puccinia hordei, and Erysiphe graminis f. sp. hordei, causing leaf scald, net blotch, leaf rust and powdery mildew diseases respectively. Mean plant height to the base of the head (cm) was measured at maturity. Various phenology components (basic vegetative phase, response to extended photoperiod, and ear or awn emergence) were measured as described by Boyd et al. (2003). Due to the large variation in awn emergence observed among DH lines derived from Sloop × Halcyon cross, the lines showing ‘erect seedling growth habit’ and awn emergence like Sloop (spring-type parent) were scored as spring-type and the rest, showing prostrate seedling growth, were scored as winter-type, including those that did not flower under summer sowing in Western Australia. At Wagga Wagga, awn appearance (days) was measured as duration from sowing to awn emergence (50% of lines showing heads). Grain colour [MinL (brightness), MinA (redness), and MinB (yellowness)] were measured with a Minolta colour meter as described (Li et al. 2003, this issue). Blue aleurone colour of grains of the DH population grown under.
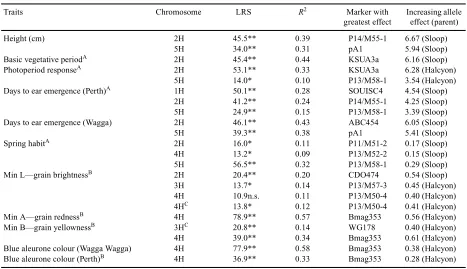
(3) Mapping and QTL analysis of Sloop × Halcyon. agro-climatic conditions in New South Wales and Western Australia was scored visually [blue (1) and white (0)]. QTL analysis An integrated linkage map based upon AFLP, RFLP, SNP, and microsatellite loci, generated with the segregation data using MapManager QTX17 (Manly et al. 2001), was used to establish associations between marker loci and QTL. Thirty-three of the 257 markers were redundant and were excluded from simple and composite interval regression analysis. The likelihood ratio statistic (LRS) was calculated using the interval mapping function by a regression procedure (Haley and Knott 1992) in MapManager QTX17. Permutation tests (Doerge and Churchill 1996) were carried out on associations that identified the QTLs for 10 cM and 1000 iterations, and an association between the marker and trait was identified at P = 0.001. Composite interval and di-genic analysis was carried out to determine any QTL and QTL × environment interactions as described (Raman et al. 2003, this issue).. Results and discussion Linkage map The Sloop × Halcyon linkage map of 1280 cM includes 151 AFLPs, 78 RFLPs, 27 SSRs, and 1 SNP marker with 7 linkage groups (Fig. 1; 246 markers shown). Average marker density was 5 cM, with the highest densities on chromosomes 2H, 5H, and 7H and the lowest on chromosome 4H. Average length of this map was similar to previous maps (Graner et al. 1991; Kleinhofs et al. 1993; Ramsay et al. 2000). QTL mapping for phenology components in the DH population from Sloop × Halcyon Significant trait-marker associations established in the DH population of Sloop × Halcyon are indicated in Table 2. Major QTLs for plant height, BVP (earliness per se or minimum duration to heading, as in Boyd et al. 2003), days to awn or ear emergence, photoperiod response, and spring habit were mapped on the short arm of chromosome 2H. Data showed that the genomic region associated with the Ppd-H1 locus for photoperiod response had a significant effect on plant height, accounting for 39% of the genetic variation. Laurie et al. (1994) also reported the gene for plant height to be located on the short arm of chromosome 2H in the Igri (winter) × Triumph (spring) DH population and found a strong effect of the Ppd-H1 region on plant height. This was ascribed to a pleiotropic effect of the variation in flowering time. Another QTL mapped on the long arm of 5H was found to be associated with plant height (Table 2). Simple interval analysis revealed that the genomic region located near the centromeric region of 2H and flanked with XP14/M50-4 and XABC454 had significant association with BVP. The marker KSUA3a detected the maximum variation (r2 = 44%) for BVP (Table 2). Two genomic regions associated with response to photoperiod were located on 2HS and 5HL. A major QTL with marker interval XP14/M50-4–XABG14, located near. Australian Journal of Agricultural Research. 1147. the centromere of 2H, was associated with response to photoperiod and had the largest effect, explaining 33% of total variation (Table 2). Another locus, XP13/M58-1, also exhibited association (significant at P = 0.05) with photoperiod response on 5H and explained 10% of phenotypic variance. On the short arm of chromosome 2H, a gene for photoperiod responsiveness, Ppd-H1 (Lundqvist et al. 1997), has been reported previously (Laurie et al. 1995; Boyd et al. 2003). For photoperiod sensitivity in barley, the Ppd locus on chromosome 2 is activated at longer photoperiod, whereas the earliness per se loci, easp, eac, and eak, are activated by shorter photoperiod (Yasuda 1977; Gallagher and Soliman 1988). Several yield-related QTLs have also been mapped to the QTL-2S, including flowering time (Laurie et al. 1994), plant height (Karsai et al. 1997), kernel weight, number of seeds per spike, and fertile tiller number (Powell et al. 1985; Kjaer et al. 1991). In wheat, Ppd-A1, Ppd-B1, and Ppd-D1 (synonyms Ppd3, Ppd2, and Ppd1, respectively) photoperiod response genes have been reported on chromosomes 2A, 2B, and 2D, homeolgous to barley chromosome 2H. Comparative mapping of wheat, rye, and barley using RFLP markers showed that homeologous group 2 chromosomes are conserved (Devos et al. 1993) and, hence, provide a valuable opportunity for establishing trait-marker associations (Ahn et al. 1993). Besides chromosome regions on 2H and 5H influencing various components of plant development and flowering in the Sloop × Halcyon population, another genomic region flanked by Ebmac501 and BCD304a–X7SGLOB markers on 1HL exhibited significant association (LRS 50.1) with awn emergence (Table 2). The SNP marker SOUISC4 and microsatellite Bmag382 explained the greatest phenotypic variance (r2 = 28%). The QTL identified in this population further confirmed that awn emergence is the final result of several interacting traits e.g. vernalisation requirement, photoperiod sensitivity, and earliness per se. Previously, Sh3, eam8, conferring photoperiod insensitivity and extreme earliness under short days, and Ppd-H2 genes for flowering under short days have been described on chromosome 1H (Gallagher et al. 1987; Laurie et al. 1995; Boyd et al. 2003). It was found that the photoperiod gene Ppd-H1 may also be associated with awn emergence in the Sloop × Halcyon DH population, as one detected QTL was located on 2H and explained 24% of total variation for awn emergence (Table 2). In wheat, Sourdille et al. (2000) reported 2 QTLs that affect heading time, one on 2BS that cosegregates with Ppd-B1 (photoperiod response) and another on 7BS, which is homeologous to barley chromosome 7H. Besides Ppd-H1, genes for early maturity, Eam1, and ‘earliness per se’, eps2S, have been reported on chromosome 2H (Laurie et al. 1995; Boyd et al. 2003). Pan et al. (1994) also reported a large effect QTL for heading date on the short arm of chromosome 2H and hypothesised that this QTL was due to the effects of alleles at the ea locus described by Nilan.
(4) X P13/M 50-7. X P14/M 53-2. X cdo105. X cdo393. X P12/M 59-1. X P13/M 52-5. X abg458b. X 7SGLOB. X bcd304a. X P13/M 50-5. X Bm ag382. X SO U ISC4. X P13/M 57-4. X P14/M 59-2. X EBmac501. A W RM 1. X P11/M 61-2. X Bm ac213. 2HL. C. 2HS. XBmac134 XP13/M50-2 XP12/M51-1 XP13/M54-7 XP12/M50-185 XP13/M49-126 Xwg516 XP14/M50-4 Xhwm007.g09 XP14/M53-1 Xabg002 XksuA3a XP14/M50-8 XP13/M54-4 XP11/M61-1 Xabc454 XP11/M51-2 XP13/M62-2 XBmac684 XBmac850 XP14/M55-1 Xwg996 XBmag378 XP13/M54-6 Xabg14 Xcdo474 XP14/M54-3 XpA8 XP14/M54-5 XP14/M55-9 XP14/M59-3 XP13/M57-7 XP13/M55-1 XBmac415 XP12/M51-5 XP13/M60-1 XP13/M57-6 XksuF41 XP14/M62-2 Xbcd512 Xbcd0292 XP13/M50-6 XP11/M57-1 XP13/M55-4 Xwg645 XP14/M50-6 XP14/M50-2 XP14/M54-2 XP13/M56-2 Xbg123 XP13/M50-123 XP12/M59-2. 3HL. C. 3HS. XP13/M58-2. Xwg940. XP14/M62-5. XP13/M48-2. XP13/M61-148. XBmag225. XPc-A12a. Xwg178. XP14/M48-4. XP13/M57-3. Xbcd22. Xbcd15. Xabc171. XP13/M59-1. XP14/M55-8. XP13/M54-5. XP13/M62-1. Xpsr604c. XP14/M62-4. 4HL. C. 4HS. XP13/M52-2. XP12/M51-4. Xcdo63. XP11/M48-112. Xabg472. XP14/M62-1. XBmag353. XP13/M50-4. XksuA3c. XP13/M51-4. XGMS89. XBmac906. XP13/M50-108. XP14/M61-154. Xcdo795a. XP11/M48-105. 5HL. C. 5HS. XksuA3b Xpsr637b Xwg1026 XP11/M53-3 XpA10 XpA5 XP11/M52-8 XP14/M54-4 XpA3 XpA4 Xcdo400 XpA1 XP14/M48-3 Xu160-M13r/f XP14/M62-7 Xpsr131 Xabg3 XP13/M58-1 Xabg712 XGMS61 XP14/M55-5 XP13/M52-8 XP14/M48-7 XP11/M61-3 XP13/M52-1 Xabc310b XP14/M48-6 XP14/M50-5. XP11/M53-4 XP11/M53-1 Xabg705 XP14/M50-1 Xwg616 Xpsr326 Xcdo795a XP14/M62-3 XP13/M54-2 XP13/M54-1 XP13/M49-208 Xbcd276 XP14/M61-92 XBmac96 XBmag394 XP14/M48-1 XP13/M58-3 XP13/M57-5 XP14/M61-103 Xabc302 XP11/M51-1 XP13/M52-4 XP13/M52-7 XP14/M50-3 XBmag223 XP11/M57-4 XP14/M48-5 Xpsr911. 6HL. 6HS XP14/M53-4 XP13/M56-1 XP12/M51-2 XP14/M61-168 XP13/M55-2 XP11/M52-2 XP11/M51-3 Xabg458a XP11/M52-4 Xwg789 Xd1-650b XBmac18 XP11/M57-3 XP11/M61-4 XP14/M54-8 XP13/M61-269 XP13/M51-1 XP14/M62-6 XP13/M48-4 Xbcd269 Xcmwg669 Xhwm001.f10 Xpsr162 XP13/M50-3 Xwg622b XP14/M60-2 XP11/M57-2 XP13/M51-2. 7HL. C. 7HS. XP14/M50-7 XP13/M60-3 Xbcd304b XP13/M48-3 Xbcd129 XP12/M51-7 XP14/M55-2 XP13/M54-3 XP12/M50-144 XP13/M57-2 X55-TH2e7.seq XP12/M51-6 XP13/M51-3 XP13/M60-2 Xpsr604a XP14/M48-8 XP11/M52-5 XP14/M59-4 XP13/M48-1 XLimitDex XP13/M52-6 XP13/M50-1 XP11/M53-2 XKUA03-4 XP11/M52-7 XP11/M55-1 XBmag110 XBmac167 Xawbma15 XP11/M52-3 XP11/M52-1 XP11/M52-6 XP14/M55-7 XP14/M54-6 XP14/M55-11 XBmag120 XksuE18 XP11/M53-5 XP13/M52-3 Xabc310b Xpsr637a Xpsr129 XP14/M53-3 XP12/M50-222 XP13/M49-121 XBmac755 Xwg420 XP13/M59-2 XP13/M55-3 XP13/M57-1 XP14/M48-2. XP14/M61-7 XP14/M59-1 XP11/M53-6 Xpsr604b XP14/M55-3 XP14/M54-1. Fig. 1. Linkage maps based on 166 progeny from the Sloop × Halcyon doubled haploid population. Distances are in Kosambi (1944) centiMorgan (cM) units. Centromeres (C) are indicated on all chromosomes.. 1HL. C. 1HS. Australian Journal of Agricultural Research. 300. 250. 200. 150. 100. 50. 0. Distance cM. 1148 B. J. Read et al..
(5) Mapping and QTL analysis of Sloop × Halcyon. Table 2.. Australian Journal of Agricultural Research. 1149. Chromosomal regions associated with agronomic traits measured on the Sloop × Halcyon mapping population LRS, Likelihood ratio statistics; R2: coefficient explaining percentage of phenotypic variance. Traits Height (cm) Basic vegetative periodA Photoperiod responseA Days to ear emergence (Perth)A. Days to ear emergence (Wagga) Spring habitA. Min L—grain brightnessB. Min A—grain rednessB Min B—grain yellownessB Blue aleurone colour (Wagga Wagga) Blue aleurone colour (Perth)B. Chromosome 2H 5H 2H 2H 5H 1H 2H 5H 2H 5H 2H 4H 5H 2H 3H 4H 4HC 4H 3HC 4H 4H 4H. LRS 45.5** 34.0** 45.4** 53.1** 14.0* 50.1** 41.2** 24.9** 46.1** 39.3** 16.0* 13.2* 56.5** 20.4** 13.7* 10.9n.s. 13.8* 78.9** 20.8** 39.0** 77.9** 36.9**. R2. Marker with greatest effect. 0.39 0.31 0.44 0.33 0.10 0.28 0.24 0.15 0.43 0.38 0.11 0.09 0.32 0.20 0.14 0.11 0.12 0.57 0.14 0.34 0.58 0.33. P14/M55-1 pA1 KSUA3a KSUA3a P13/M58-1 SOUISC4 P14/M55-1 P13/M58-1 ABC454 pA1 P11/M51-2 P13/M52-2 P13/M58-1 CDO474 P13/M57-3 P13/M50-4 P13/M50-4 Bmag353 WG178 Bmag353 Bmag353 Bmag353. Increasing allele effect (parent) 6.67 (Sloop) 5.94 (Sloop) 6.16 (Sloop) 6.28 (Halcyon) 3.54 (Halcyon) 4.54 (Sloop) 4.25 (Sloop) 3.39 (Sloop) 6.05 (Sloop) 5.41 (Sloop) 0.17 (Sloop) 0.15 (Sloop) 0.29 (Sloop) 0.54 (Sloop) 0.45 (Halcyon) 0.40 (Halcyon) 0.41 (Halcyon) 0.56 (Halcyon) 0.40 (Halcyon) 0.61 (Halcyon) 0.38 (Halcyon) 0.28 (Halcyon). *P < 0.05; **P < 0.01; n.s., not significant (P > 0.05). A See Boyd et al. (2003). B See Li et al. (2003). C Regression analysis conducted with composite interval mapping.. (1964). The authors further reported a large QTL effect for heading date on the long arm of chromosome 5H and that the QTL associated with awn emergence on 5H may be attributed to the segregation of alleles at the Sh2 gene. Under NSW conditions, only 2 QTLs linked with awn emergence were identified on chromosomes 2H and 5H (Table 2). Karsai et al. (1997) found a possible interaction for heading date between the Ppd locus on chromosome 2H and Sh2 in a Dicktoo × Morex DH population, and both loci explained >90% of phenotypic variation for heading date. The photoperiod-insensitive allele of Ppd-H1 from Sloop favoured early flowering (ear emergence). Photoperiodinsensitive, dominant alleles of wheat Ppd genes have been reported to confer early flowering under both short and long day length (Worland 1996). An eak gene for determining ‘earliness’ under short day length is located on 1H (Stracke and Borner 1998). Takahashi and Yasuda (1971) reported that at least 3 physiological factors (vernalisation response, photoperiod response, and earliness) are responsible for heading date in barley. Vernalisation response has been shown to be strongly influenced by photoperiod (Roberts et al. 1988). Epistatic interactions among major loci of vernalisation response, photoperiod reaction, and earliness per se, and the effect of additional quantitative minor loci,. may be responsible for the fact that a large number of genomic regions have been identified as determinants of heading date (Karsai et al. 2001). For spring v. winter habit, 3 chromosomal regions located on 2HS, the distal end of 4HL, and 5HL exhibited significant association in the Sloop × Halcyon DH population. Three genes, Sh1, Sh2, and Sh3, located on 4HL, 5HL, and 1HL, respectively, have been reported to influence spring v. winter habit in barley (Takahashi and Yasuda 1971; Yasuda 1981). It is likely that QTLs located at 4HL and 5HL may be the same as the Sh1 and Sh2 genes associated with spring growth habit. The genes Sh2 and eps5L for spring habit and ‘earliness per se’ have been located on 5H (Laurie et al. 1994; Boyd et al. 2003). The vernalisation requirement gene (Vrn1) has also been mapped on chromosome 5A of wheat, which is homeologous to the spring habit gene (Sh2) on chromosome 5H of barley (Galiba et al. 1995) and the Sp1 locus (De Vries and Sybenga 1984; Plaschke et al. 1993) on chromosome 5R of rye. Since a large variation in growth habit was recorded in the Sloop × Halcyon DH population, it is possible that several genes may influence this trait. A multiple allele series at the Sh2 locus and complex epistatic interactions among loci were postulated to explain the range of growth habits existing in barley germplasm (Nilan 1964;.
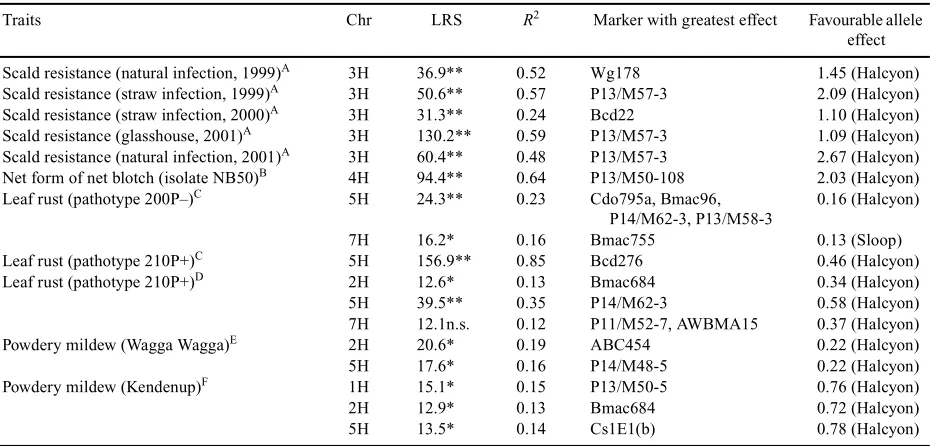
(6) 1150. Australian Journal of Agricultural Research. Takahashi and Yasuda 1971). QTL controlling traits (field survival, LT50, growth habit and crown fructan content) associated with winter hardiness in barley have also mapped to 5H (Hayes et al. 1993). Our results are consistent with the previous findings made. It was found that alleles from Sloop favour early awn emergence, short BVP, and spring habit, whereas the alleles of Halcyon advanced the response to extended photoperiod. In summary, several QTLs governing flowering time, measured as awn emergence, and plant height were located near the centromeric region of chromosome 2H and on 5H; hence, these genomic regions were ‘hot spots’ controlling various traits associated with plant development and awn emergence (flowering). These ‘hot spots’ may control various associated genes or may have pleiotropic effects. Coventry et al. (2003, this issue) found associations of Ppd-H1 (2HS), eps2 (2H centromeric), Sh1 (4HL), Sh2 (5HL), and eps7HS (7HS) loci with grain weight and size QTLs in barley. QTL mapping for grain colour in DH population from Sloop × Halcyon Two QTLs located on 2H and 3H exhibited significant associations with grain brightness (Table 2). Of these, the QTL located on chromosome 2H contributed the largest variation (20%). Alleles from both Sloop and Halcyon favoured the brightness of grain. Similar chromosomal regions on 2H and 3H have been associated with grain brightness in Alexis × Sloop populations (Li et al. 2003). The ant-28 gene associated with the proanthocyanidin-free trait has also been mapped on 3H in barley (Garvin et al. 1998). A third QTL located on chromosome 4H near locus XP13/M50-4 (LRS 10.9, r2 = 11%), detected with simple regression analysis, was not significantly associated with grain brightness, although it has attained LRS close to the level of significance (P = 0.05). Composite interval analysis revealed that the loci on chromosome 3H (XP13/M57-3) and on 4H (XP13/M50-4) had (epistatic) gene interactions. By controlling this interaction, a significant QTL flanked with markers KSUA3c and P13/M50-4 on 4H was detected (Table 2). Simple and composite interval mapping revealed a major QTL having main effects associated with grain redness (Min-A) on chromosome 4H. The marker Bmag353 detected a maximum 57% of phenotypic variance. The allele from Halcyon favoured this trait in the DH population of Sloop × Halcyon (Table 2). Halcyon and Sloop exhibited a distinct difference of 1.6 units in grain colour. No significant interactions were observed for grain redness. For MinB (yellowness of grain), a major QTL with marker interval between P11/M48-105 and ABG472 on 4H exhibited main effects, accounting for 34% of phenotypic variation. Regression analysis also indicated that a QTL close to the end of 7HL near P13/M55-3 marker (LRS 11.2,. B. J. Read et al.. r2 = 12%) was close to significance to establish association with yellowness of grains. Composite analysis indicated that locus XP13/M50-4, which was associated with yellow grain colour on 4H, exhibited epistatic interactions with 3H. Controlling associated marker loci allowed detection of a new QTL flanked by BCD22 and P13/M58-2 markers on chromosome 3H. The locus XWG178 detected the maximum variability (14%) for this trait and had an LRS of 20.8, which was highly significant (P < 0.0001). Both alleles of Halcyon increased the yellowness of grain. A major QTL associated with blue aleurone colour (scored visually) was located on chromosomes 4H and accounted for 58% of phenotypic variation (Table 3). The Halcyon allele gave blue aleurone colour in the DH population from Sloop × Halcyon. Our results showed that the major QTL identified for blue aleurone colour on 4H was the same as mapped for the loci controlling grain brightness, redness and yellowness (Table 2). Mapping of QTLs for disease resistance in DH population from Sloop × Halcyon Favourable alleles from Halcyon increased resistance to scald, NFNB, leaf rust, and powdery mildew in the DH population derived from Sloop × Halcyon (Table 3). A major gere for scald resistance was mapped on chromosome 3H and explained 24–59% of phenotypic variation under different seasons/conditions (Table 3). For the NFNB resistance, a major QTL flanked with P11/M48-105 and ABG472 markers on chromosome 4H exhibited significant association. The XP13/M50-108 revealed maximum LRS and accounted for the 64% of total variation of net blotch resistance (Raman et al. 2003). Steffenson et al. (1996) also reported 2 genomic regions, one flanked with marker pairs ABG3 and ABG484 (LOD 11.1, r2 = 31%) on 4H and the second on the long arm of 6H flanked by KsuD17 and KsuA3D (LOD 4.5, r2 = 14%) associated with NFNB resistance. In the present investigation, the QTL located on 6H was not significant, but was very close to significance. The QTL identified on 4H for seedling resistance to NFNB may be allelic with the previously identified major locus (Steffenson et al. 1996). It may be possible to combine different QTL and major genes to develop broad-spectrum and high level resistance to P. teres f. teres (Raman et al. 2003). The Halcyon alleles for blue aleurone colour and NFNB resistance are close to the centromere on 4H. On the basis of infection response to leaf rust pathotype 200P–, 2 significant QTLs were identified: one located near the centromere of chromosome 5H, and another on the long arm of chromosome 7H (Park et al. 2003, this issue). Alleles from Halcyon on 5H and from Sloop on chromosome 7H were in the direction of increasing leaf rust resistance to pathotype 200P– (Table 3). Significant interaction was observed between Xbmac96 on chromosome 5H and.
(7) Mapping and QTL analysis of Sloop × Halcyon. Australian Journal of Agricultural Research. 1151. Table 3. Chromosomal (Chr) regions associated with disease traits measured on the Sloop × Halcyon population LRS, Likelihood ratio statistics; R2: regression coefficient explaining percentage of phenotypic variance Traits. Chr. LRS. R2. Marker with greatest effect. Favourable allele effect. Scald resistance (natural infection, 1999)A Scald resistance (straw infection, 1999)A Scald resistance (straw infection, 2000)A Scald resistance (glasshouse, 2001)A Scald resistance (natural infection, 2001)A Net form of net blotch (isolate NB50)B Leaf rust (pathotype 200P–)C. 3H 3H 3H 3H 3H 4H 5H. 36.9** 50.6** 31.3** 130.2** 60.4** 94.4** 24.3**. 0.52 0.57 0.24 0.59 0.48 0.64 0.23. 1.45 (Halcyon) 2.09 (Halcyon) 1.10 (Halcyon) 1.09 (Halcyon) 2.67 (Halcyon) 2.03 (Halcyon) 0.16 (Halcyon). 7H 5H 2H 5H 7H 2H 5H 1H 2H 5H. 16.2* 156.9** 12.6* 39.5** 12.1n.s. 20.6* 17.6* 15.1* 12.9* 13.5*. 0.16 0.85 0.13 0.35 0.12 0.19 0.16 0.15 0.13 0.14. Wg178 P13/M57-3 Bcd22 P13/M57-3 P13/M57-3 P13/M50-108 Cdo795a, Bmac96, P14/M62-3, P13/M58-3 Bmac755 Bcd276 Bmac684 P14/M62-3 P11/M52-7, AWBMA15 ABC454 P14/M48-5 P13/M50-5 Bmac684 Cs1E1(b). Leaf rust (pathotype 210P+)C Leaf rust (pathotype 210P+)D. Powdery mildew (Wagga Wagga)E Powdery mildew (Kendenup)F. 0.13 (Sloop) 0.46 (Halcyon) 0.34 (Halcyon) 0.58 (Halcyon) 0.37 (Halcyon) 0.22 (Halcyon) 0.22 (Halcyon) 0.76 (Halcyon) 0.72 (Halcyon) 0.78 (Halcyon). *P < 0.05; **P < 0.01; n.s., not significant (P > 0.05). A Leaf scald screening under glasshouse and field conditions (see Genger et al. 2003). B Net form of net blotch seedling severity after inoculation with isolate NB50 (1 = clean, 10 = severe necrosis; see Raman et al. 2003). C Leaf rust seedling reaction to pathotype 200P- and 210P+ (see Park et al. 2003). D Leaf rust seedling reaction (isolate S2773; pathotype 210P+) at Hermitage Research Station, Qld. E Powdery mildew severity (1 = clean, 9 = severe infection) in field screening nursery at Wagga Wagga Agricultural Institute, NSW. F Powdery mildew severity (1 = clean, 9 = severe infection) in field screening at Kendenup, W. Aust.. Xbmac755 on 7H, associated with resistance to pathotype 200P– at a level of significance of P = 10–6 (Park et al. 2003). Only one major QTL, explaining 85% of phenotypic variation was associated with resistance to pathotype 210P+ and this was located on chromosome 5H (Park et al. 2003). On the basis of infection response to Puccinia hordei isolate (210P+) scored at Hermitage Research Station, 3 QTLs were identified on chromosomes 2H, 5H, and 7H. Two QTLs mapped on 2H and 5H were significant, whereas the QTL on 7H was not significant but was very close to significance (LRS 12.1, LOD 2.6, Table 3). For powdery mildew resistance, 3 genomic regions were identified that exhibited significant association with resistance to Erysiphe graminis f. sp. hordei. Two genomic regions mapped on 2H and 5H were detected in both experiments conducted at Wagga Wagga and Kendenup. However, another QTL, explaining 15% of phenotypic variance at Kendenup only, was located on 1H (Table 3). This difference between locations may be due to a different pathogen population, or to the small population size and stringent conditions used to declare the putative QTLs. Validation To validate the markers linked with resistance to NFNB under a different background, an experiment was conducted. at Hermitage Research Station, Warwick. The results confirm that the microsatellite marker EBmac906 can be used to predict the resistance for net blotch from F2 individuals of the Ant29 × Halcyon population (Raman et al. 2003). In summary, the Sloop × Halcyon DH population has been a valuable source of identification of marker loci associated with resistance to scald, net blotch, leaf rust, and powdery mildew, as well as blue aleurone colour and various components of phenology. This population has also been very useful for verification of QTL alleles from Sloop, especially for grain colour and leaf rust that have recently been identified in the Alexis × Sloop population (Barr et al. 2003). Phenotyping for various components of malting quality is in progress and identification of the associated QTLs may allow us to determine ‘novel’ alleles, if any. The Halcyon region on 4H near Bmag353 is associated with NFNB resistance and grain colour traits. However, it is uncertain whether this is due to linkage or due to pleiotropy. The marker linked to NFNB has been validated and would be very useful to monitor gene introgression for NFNB resistance and to increase the proportion of different favourable alleles while pyramiding genes conferring multiple disease resistance from diverse sources in the barley germplasm..
(8) 1152. Australian Journal of Agricultural Research. Acknowledgments The authors are thankful to their respective employer organisations and to the Grains Research and Development Corporation Australia for financial support. References Ahn S, Anderson JA, Sorrells ME, Tanksley SD (1993) Homoeologous relationships of rice, wheat and maize chromosome. Molecular and General Genetics 241, 483–490. Barr AR (1998) Sloop syn. WI2875–22. Plant Varieties Journal 11, 15–16. Barr AR, Jefferies SP, Broughton S, Chalmers KJ, Krestschmer JM, Boyd WJR, Collins HM, Roumeliotis S, Logue SJ, Coventry SJ, Moody DB, Read BJ, Poulsen D, Lance RCM, Platz GJ, Park RF, Panozzo JF, Karakousis A, Lim P, Verbyla AP, Eckermann PJ (2003) Mapping and QTL analysis of the barley population Alexis × Sloop. Australian Journal of Agricultural Research 54, 1117–1123. Boyd WJR, Li CD, Grime CR, Cakir M, Potipibool S, Kaveeta L, Men S, Jalal Kamali MR, Barr AR, Moody DB, Lance RCM, Logue SJ, Raman H, Read BJ (2003) Conventional and molecular genetic analysis of factors contributing to variation in the timing of heading among spring barley (Hordeum vulgare L.) genotypes grown over a mild winter growing season. Australian Journal of Agricultural Research 54, 1277–1301. Collins HM, Panozzo JF, Logue SJ, Jefferies SP, Barr AR (2003) Mapping and validation of chromosome regions associated with high malt extract in barley (Hordeum vulgare L.) Australian Journal of Agricultural Research 54, 1223–1240. Coventry SJ, Barr AR, Eglinton JK, McDonald GK (2003) The determinants and genome locations influencing grain weight and size in barley (Hordeum vulgare L.). Australian Journal of Agricultural Research 54, 1103–1115. De Vries JN, Sybenga J (1984) Chromosomal location of 17 monogenically inherited morphological markers in rye (Secale cereale L.) using the translocation tester set. Zeitschrift für Pflanzenzuchtung 92, 117–139. Devos KM, Millan T, Gale MD (1993) Comparative RFLP maps of the homoeologous group-2 chromosomes of wheat, rye and barley. Theoretical and Applied Genetics 85, 784–792. Doerge RW, Churchill GA (1996) Permutation tests for multiple loci affecting a quantitative character. Genetics 142, 285–294. Galiba G, Quarrie SA, Sutka J, Morgounov A, Snape JW (1995) RFLP mapping of the vernalisation (Vrn1) and frost resistance (Fr1) genes on chromosome 5A of wheat. Theoretical and Applied Genetics 90, 1174–1179. Gallagher LW, Belhadri M, Zahour A (1987) Interrelationships among three major loci controlling heading date of spring barley when grown under short day length. Crop Science 27, 155–160. Gallagher LW, Soliman KM (1988) Classification of global environments and cultivars of spring barley based on heading time interactions. Plant Breeding 100, 124–136. Garvin DF, Miller-Garvin JE, Viccars EA, Jacobsen JV, Brown AHD (1998) Identification of molecular markers linked to Ant-28–484, a mutation that eliminates proanthocyanidin production in barley seeds. Crop Science 38, 1250–1255. Genger RK, Williams KJ, Raman H, Read BJ, Wallwork H, Burdon JJ, Brown AHD (2003) Leaf scald resistance genes in Hordeum vulgare and Hordeum vulgare ssp. spontaneum: parallels between cultivated and wild barley. Australian Journal of Agricultural Research 54, 1335–1342. Graner A, Jahoor A, Schondelmaier J, Siedler H, Pillen K, Fischbeck G, Wenzel G, Herrmann RG (1991) Constriction of an RFLP map of barley. Theoretical and Applied Genetics 83, 250–256.. B. J. Read et al.. Graner A, Michalek W, Streng S (2000) Molecular mapping of genes conferring resistance to viral and fungal pathogens. Barley Genetics VIII, 45–52. Haley SD, Knott SA (1992) A simple regression method for mapping quantitative trait loci in line crosses using flanking markers. Heredity 69, 315–324. Hayes PM, Blake TK, Chen THH, Tragoonrung S, Chen FQ, Pan A, Liu B (1993) Quantitative trait loci on barley (Hordeum vulgare) chromosome 7 associated with components of winter hardiness. Genome 36, 66–71. Holton TA, Christopher JT, McClure L, Harker N, Henry R (2002) Identification and mapping of polymorphic SSR from expressed gene sequences of barley and wheat. Molecular Breeding 9, 63–71. Karsai I, Meszaros K, Hayes PM, Bedo Z (1997) Effects of loci on chromosomes 2 (2H) and 7 (5H) on developmental patterns in barley (Hordeum vulgare L) under different photoperiod regimes. Theoretical and Applied Genetics 94, 612–618. doi:10.1007/ S001220050458. Karsai I, Meszaros K, Lang L, Hayes PM, Bedo Z (2001) Multivariate analysis of traits determining adaptation in cultivated barley. Plant Breeding 120, 217–222. doi:10.1046/J.1439-0523.2001.00599.X. Kjaer B, Haahr V, Jensen J (1991) Associations between 23 quantitative traits and 10 genetics markers in barley cross. Plant Breeding 106, 261–274. Kleinhofs A, Kilian A, Saghai-Maroof MA, Biyashev RM, Hayes PM, Chen FQ, Lapitan N, Fenwick A, Blake T, Kanazin V, Ananiev E, Dahleen L, Kudrna D, Bollinger J, Knapp SJ, Liu B, Sorrells M, Heun M, Franckowiak JD, Hoffman D, Skasdsen R, Steffenson BJ (1993) A molecular, isozyme and morphological map of the barley (Hordeum vulgare) genome. Theoretical and Applied Genetics 86, 705–712. Kosambi DD (1944) The estimation of map distance from recombination value. Annals of Eugenics 12, 172–175. Laurie DA, Pratchett N, Bezant JH, Snape JW (1994) Genetic analysis of a photoperiod response gene on the short arm of chromosome 2 (2H) of Hordeum vulgare (barley). Heredity 72, 619–627. Laurie DA, Pratchett N, Bezant JH, Snape JW (1995) RFLP mapping of five major genes and eight quantitative trait loci controlling flowering time in a winter × spring barley (Hordeum vulgare L.) cross. Genome 38, 575–585. Li CD, Lance RCM, Collins HM, Tarr A, Roumeliotis S, Harasymow S, Cakir M, Fox GP, Grime CR, Broughton S, Young KJ, Raman H, Barr AR, Moody DB, Read BR (2003) Quantitative trait loci controlling kernel discoloration in barley (Hordeum vulgare L.). Australian Journal of Agricultural Research 54, 1251–1259. Liu ZW, Biyashev RM, Saghai-Maroof MA (1996) Development of simple sequence repeat DNA markers and their integration into a barley linkage map. Theoretical and Applied Genetics 93, 869–876. Lundqvist U, Franckowiak JD, Konishi T (1997) New and revised descriptions of barley genes. Barley Genetics Newsletter 26, 22–516. Manly KF, Cudmore RH Jr, Meer JM (2001) Map Manager QTX, cross-platform software for genetic mapping. Mammalian Genome 12, 930–932. doi:10.1007/S00335-001-1016-3. Nilan RA (1964) ‘The cytology and genetics of barley.’ (Washington State University Press: Seattle, WA) Pan A, Hayes PM, Chen F, Chen THH, Blake T, Wright S, Karsai I, Bedo Z (1994) Genetic analysis of the components of winterhardiness in barley (Hordeum vulgare L.). Theoretical and Applied Genetics 89, 900–910. Park RF, Poulsen D, Barr AR, Cakir M, Moody DB, Raman H, Read BJ (2003) Mapping genes for resistance to Puccinia hordei in barley. Australian Journal of Agricultural Research 54, 1323–1333..
(9) Mapping and QTL analysis of Sloop × Halcyon. Australian Journal of Agricultural Research. Plaschke J, Borner A, Xie DX, Koebner RMD, Schlegel R, Dale MD (1993) RFLP mapping of genes affecting plant height and growth habit in rye. Theoretical and Applied Genetics 85, 1049–1054. Powell W, Caligari PDS, Thomas WTB, Jinks JL (1985) The effects of major genes on quantitatively varying characters in barley. 2. The denso and day length response loci. Heredity 54, 349–352. Raman H, Platz GJ, Chalmers KJ, Raman R, Read BJ, Barr AR, Moody DB (2003) Mapping of genomic regions associated with net form of net blotch resistance in barley. Australian Journal of Agricultural Research 54, 1359–1367. Ramsay L, Macaulay M, Ivanissevich SD, MacLean K, Cardle L, Fuller J, Edwards KJ, Tuvesson S, Morgante M, Massari A, Maestri E, Marmiroli N, Sjakste T, Ganal M, Powell W, Waugh R (2000) A simple sequence repeat-based linkage map of barley. Genetics 156, 1997–2005. Roberts EH, Summerfield RJ, Cooper JP, Ellis RH (1988) Environmental control of flowering in barley (Hordeum vulgare L). I. Photoperiod limits to long-day responses, photoperiod-insensitive phase and effects of low temperature and short day vernalisation. Annals of Botany 62, 127–144. Saghai-Maroof MA, Biyashev RM, Yang GP, Zhang Q, Allard RW (1994) Extraordinarily polymorphic microsatellite DNA in barley: species diversity, chromosomal locations and population dynamics. Proceedings of the National Academy of Sciences of the United States of America 91, 5466–5470. Sourdille P, Snape JW, Cadalen T, Charmet G, Nakata N, Bernard S, Bernard M (2000) Detection of QTLs for heading time and photoperiod response in wheat using a doubled haploid population. Genome 43, 487–494. doi:10.1139/GEN-43-3-487. Steffenson BJ, Hayes PM, Kleinhofs A (1996) Genetics of seedling and adult plant resistance to net botch (Pyrenophora teres f. teres) and spot blotch (Cochliobolus sativus) in spring barley. Theoretical and Applied Genetics 91, 552–558.. 1153. Stracke S, Borner A (1998) Molecular mapping of the photoperiod response gene ea7 in barley. Theoretical and Applied Genetics 97, 797–800. Struss D, Plieske J (1998) The use of microsatellite markers for detection of genetic diversity in barley populations. Theoretical and Applied Genetics 97, 308–315. Takahashi R, Yasuda S (1971) Genetics of earliness of growth habit in barley. In ‘Barley Genetics II—Proceedings of 2nd International Barley Genetics Symposium’. pp. 388–408. (Washington State University: Pullman, WA) Vos P, Hogers R, Bleeker M, Reijans M, van de Lee T, Hornes M, Frijters A, Pot J, Peleman J, Kuiper M, Zabeau M (1995) AFLP: a new technique for DNA fingerprinting. Nucleic Acids Research 23, 4407–4414. Williams KJ (2003) The molecular genetics of disease resistance in barley. Australian Journal of Agricultural Research 54, 1065–1079. Worland AJ (1996) The influence of flowering time genes on environmental adaptability in European wheats. Euphytica 89, 49–57. Yasuda S (1977) Linkage of the barley earliness gene eak and its pleiotropic effects under different growth conditions. Berichte des Ohara Instituts fur Landwirtschaftliche Biologie 17, 15–28. Yasuda S (1981) The physiology and earliness in barley. In ‘Barley Genetics IV—Proceedings 4th International Barley Genetics Symposium’. pp. 507–517. Edinburgh.. Manuscript received 4 February 2003, accepted 14 October 2003.. http://www.publish.csiro.au/journals/ajar.
(10)
Figure
Related documents
