R E G U L A R A R T I C L E
Open Access
Characterization of online groups along
space, time, and social dimensions
David Martin-Borregon
1*, Luca Maria Aiello
2, Przemyslaw Grabowicz
3, Alejandro Jaimes
2and
Ricardo Baeza-Yates
2*Correspondence:
1Universitat Pompeu Fabra,
Barcelona, Spain
Full list of author information is available at the end of the article
Abstract
Social groups play a crucial role in online social media because they form the basis for user participation and engagement. Although widely studied in their static and evolutionary aspects, no much attention has been devoted to the exploration of the nature of groups. In fact, groups can originate from different aggregation processes that may be determined by several orthogonal factors. A key question in this scenario is whether it is possible to identify the different types of groups that emerge
spontaneously in online social media and how they differ. We propose a general framework for the characterization of groups along the geographical, temporal, and socio-topical dimensions and we apply it on a very large dataset from Flickr. In particular, we define a new metric to account for geographic dispersion, we use a clustering approach on activity traces to extract classes of different temporal footprints, and we transpose the “common identity and common bond” theory into metrics to identify the skew of a group towards sociality or topicality. We directly validate the predictions of the sociological theory showing that the metrics are able to forecast with high accuracy the group type when compared to a
human-generated ground truth. Last, we frame our contribution into a wider context by putting in relation different types of groups with communities detected
algorithmically on the social graph and by showing the effect that the group type might have on processes of information diffusion. Results support the intuition that a more nuanced description of groups could improve not only the understanding of the activity of the user base but also the interpretation of other phenomena occurring on social graphs.
Keywords: social media; groups; bond theory; identity theory; Flickr
1 Introduction
The explosive success of social media is partly motivated by their capability of transpos-ing everyday life dynamics on online platforms in a very intuitive way. Accordtranspos-ingly, even though dyadic social links are the primary way for people to connect online, social media have allowed from their very early stages the creation of socialgroups. This is a neces-sity that emerges directly from the collective behaviour of the crowd, that tends to flock in communities pushed by a number of reasons, including affiliation by similarity, local prox-imity, common interest, conflict with other groups, or even just the need for a definition of an identity by being separated by the rest of the population [–]. As a result, groups in
social media have flourished and they nowadays form a strong basis for user participation and engagement in online services.
For this reasons, online groups have been studied extensively in the past, with respect to their social structure and activity evolution. Despite the great attention given to the study of online groups, previous work on large online datasets has mainly considered groups as homogeneous entities, overlooking the fact that groups, similarly to social ties [, ], are not all created equal, as they emerge from different collective processes and from the different motivations of their founders or members.
Although several other disciplines, including physics, psychology, organizational sci-ences, and social sciences have been trying to explore specific aspects of the formation, evolution, and internal dynamics of groups at different levels (see Section ), most of the studies has focused either on (i) small or offline social ecosystems, (ii) groups that are gen-erated ad-hoc to conduct specific experiments, or (iii) groups inferred from the network structure. Also, very often specific aspects of group dynamics (e.g., consensus reaching, language norms, geographic placement) have been investigated in separation, with very few efforts to go towards a more holistic, multidimensional characterization of social ag-gregations. As a consequence, we feel that a thorough and large-scale exploration of the
natureof online, user-generated groups, across some fundamental dimensions that char-acterize groups is in order.
We propose a categorization of online groups along three axes:spatial,temporaland
socio-topical. For each dimension we propose a set of general metrics that capture quan-titatively the different facets of groups. Specifically, we describe groups with respect of the geographic scattering of their members, the temporal footprint of the members’ ac-tivity in terms of dispersion, skeweness, and burstiness, and the tendency of the group to aggregate members on a topical or social basis. With respect to the last dimension, we rely on a longstanding theory about the creation of social communities. The theory states that people join groups driven by either pre-existing social ties with other members or by the interest in the topical focus of the group as a whole and we build metrics to quantify this tendency. We show that our metric well reflect the cardinal points of the theory, be-ing good predictors of the group type. Our metrics are tested on a large-scale corpus of public, online, user-generated groups.
Last, to frame our contribution in to a wider context, we provide examples of possible applications of our framework to other analytical issues on social networks. In particular, we put in relation the social and topical groups we find algorithmically with the commu-nities detected from the graph structure and we speculate about the impact that different group types may have in the process of information diffusion, following the intuition that information cascades and group boundaries are strictly related concepts [].
1.1 The Flickr case-study
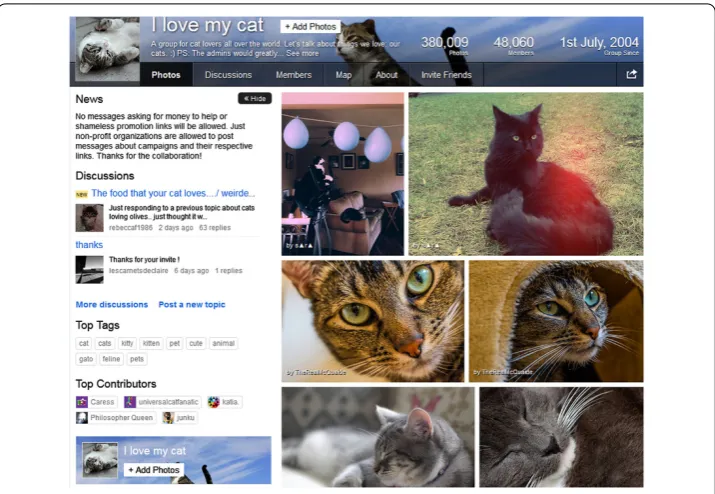
Figure 1 Page of a popular Flickr group, showing the pictures in the photo pool and a set of content (news, add photo, top tags) and social (discussions, members, top contributors) features.
Groups in Flickr are self-declared and self-managed communities that are sponta-neously created by the user base, meaning that each user can create (and become admin-istrator of ) an arbitrary number of groups. Most groups have open membership, so users can join without invitation, just by clicking ajoinbutton, while others are by invitation only and joining requires the administrator’s permission. Groups are usually built around a theme that is user-defined and, consequently, their topic, generality, and scope of interest can vary much. All groups provide functionalities that are explicit instantiations ofcontent
andrelationalfeatures of social media. As illustrated in Figure , group participants can share their pictures with other group members in a commonphoto pool. A picture that is featured in a group tends naturally to receive feedback from other members, but social interaction is also possible through discussion boards. As a result, a Flickr group can be denoted by a set oftermsincluding comments and tags on photos of the pool, discussions, group name and description and by a set of socialactionssuch as exchange of messages in a discussion board, comments and favorites on photos, and so on.
1.2 Contributions and roadmap
This work is a direct extension to our previous paper [] that focused on the interplay between social and topical aspects of online communities. Here we extend and improve that work here in a number of ways, and present the following contributions.
• We introduce a framework for the characterization of groups along geographical and temporal dimensions.
• We run a study of a large scale corpus of Flickr groups using the three target dimensions, being able to draw a more nuanced characterization of them than previous work.
• We use our framework to run a faceted analysis of the phenomenon of information diffusion on networks, spotting insightful correlations between type of spreading and type of group.
Overall, our work gives a contribution in the first place in the field of computational social science, specifically in the direction of a nuanced characterization of groups according to notions of topicality and sociality developed in sociology in the past decades but never tested on large online datasets. Our experimental evaluation shows that the formulation of the theory well captures the separation between the two macro-classes of groups. The transposition of the theory in quantitative metrics allowed us also to provide additional evidence to support another well-established theory about the maximum number of stable relationships for individuals in social environments (Dunbar’s number []). Furthermore, we consider spatial, temporal, and socio-topical metrics jointly for the first time, discov-ering some macro-classes of groups that reveal the interplay between the different dimen-sions; to mention two clear examples, topical groups that tend to be long-lived and with steady activity in contrast with social groups that are more often bursty and short-lived.
The main goal of this work is to provide yet another step towards a computational un-derstanding of social structures, user-generated groups in this specific case. To show that the value a nuanced characterization of social aggregations is not limited to the possibility of carrying out more fine-grained network analysis, we also connect our study to the field of information diffusion showing that different types of groups can impact on the process of the spreading of information along the network. This is the first study that shows such empirical evidence and directly connects with very recent work in information diffusion that have been trying to leverage the same intuition [].
The remainder of the paper is structured as follows. First, we present an overview of re-lated work (Section ). Then we introduce the three dimensions that we use to characterize social groups (geographical, temporal, and socio-topical) and we define how to measure them quantitatively (Section ). After a short illustration of the Flickr dataset we use and of the ground truth we extracted to validate our socio-topical metrics (Section ), we present the results of the application of the metrics, identifying different classes of Flickr groups with respect to the three dimensions considered in separation but also jointly (Section ). Finally, we set our contribution into a wider context by analyzing the process of informa-tion diffusion in the light of the different group types in which the process takes place (Section ).
2 Related work
2.1 Online groups characterization
purposes but also in direct application to several tasks, including profiling and recom-mendation [, ]. The global structure, evolution and dynamics of social groups have been investigated over large-scale and heterogeneous datasets. The shape and evolution of groups have been described in computer science literature as very broad phenomena [, ] that are determined by the intrinsic group fitness [] and on the density of social links connecting their members [].
Although the broad variety of group types and their emerging features (starting from their size []) has motivated some research work to characterize the nature of groups along their main dimensions, most of the contributions so far have not established any quantitative framework for their classification.
Due to its open nature and its multiple features, Flickr has been one of the most studied platform to this respect. Early work relied on interviews and user studies to identify the different usage of Flickr groups [], finding five main motivations for users to join groups (memory, identity and narrative, relationships maintenance, representation and self-expression). Alternative classifications based on user studies have been proposed as well [, ].
Negoescuet al.have contributed quite much to this research area with several stud-ies on Flickr groups. First they have introduced a manual categorization of Flickr groups, partitioning them ingeographical,topical,visual, and“catch-all” groups []. With this categorization in mind, they propose to detect hypergroups (i.e., groups of groups) based on the similarity of their topical focus, extracted with LDA []; in contrast, Negiet al.
try to find subgroups in large Flickr communities using MoM-LDA on photo tags []. Groups have been also studied in relation with their membership, with special attention to topicality and to recommendations exchanged between peers []. In more recent work [] Negoescuet al.have discussed about how to represent Flickr groups group according to the topics and tags in use by their members. Also, according to previous studies [], they identified “real” groups as those motivated by self-expression and relationship main-tenance. However, although every Flickr group can be mapped to a topic (set of words), not all groups have a topical focus, as we show in this work.
Following an earlier conceptual framework [], Coxet al.[] attempted to measure the “groupness” of a group using several metrics as size of membership, volume of pho-tos, length of description, and so on. They propose a classification of groups into topical (focused on a theme), highlighting (to promote photos to a wider public) and geographi-cal (rooted into a specific geolocation); however their classification is ultimately arbitrary and not supported by quantitative results. In partial contrast with previous work [], their results also point out that small groups are more important than the big ones to the so-cial activity of the network as they operate at “human scale”. The work was subsequently extended [] and the categorization was manually refined into four categories, namely location-based, award, learning, an topical groups.
At a finer scale, social communities can be described in terms of user engagement. From a quantitative perspective, the amount of participation of members in activities related to the group is varied and dependent on group size []. Intra-group activity has been characterized in terms of propensity of people to reply to questions of other members [], coherence of discussion topics [], or item sharing practices []. Modeling inner activity of groups has helped in finding effective strategies to predict future group growth or activity [], recommend group affiliation, or enhance the search experience on social platforms [].
Groups have been studied also in other online platforms. The structure of user inter-action patterns in groups extracted from LiveJournal, DBLP, YouTube, Orkut, and Yahoo Groups have been investigated in the past [, , , ]. Laineet al.[] present an analy-sis on YouTube groups, highlighting their tendency to both topicality and sociality and the small-world nature of the interactions inside them. Interestingly, they envision in future work an analysis of the interplay between groups and influence.
Last, some important contributions in the field of complex systems have investigated some properties of groups that can be inferred by the structure of social links via cluster-ing or community detection algorithms. Barabasiet al.[] use a network of phone calls to find that large detected groups (using clique percolation) persist longer when they are ca-pable of dynamically changing their membership, suggesting that the ability to self-altering the internal composition results in better adaptability. Using a similar dataset, Onnelaet al.[] explore the geography of groups to find that small communities are geographi-cally tight, but become geographigeographi-cally wider when the group size exceeds members. Temporal patterns similar to the ones we explore in this work have been also investigated. Burstiness of human behaviour as a consequence of processing tasks in relation with their perceived priority have been studied, but not specifically in the context of groups [].
2.2 Groups in (computational) social sciences
Small-size groups have been studied by researchers in psychology and sociology and by scholars in other social and behavioral sciences for the past century and especially in the past decades. The notions ofcommunityand socialgrouphave been widely debated in be-havioral sciences [, ]. The faceted complexity of groups, have been discussed for long time [] and previous works have remarked that the internal dynamics of social groups emerge from the combination of complex cognitive processes such as sense of member-ship, influence between people, fulfillment of individual and collective needs inside the group, and shared emotional connections []. Based on such widely accepted theoretical foundations, sociological theories have been formulated to disentangle all of these com-plex aspects.
dimension, as “ongoing” teams that have to collaborate for a long time must tackle more process and structural issues than groups with “temporary” tasks []. In environments where many groups co-exist, overlap between with other groups’ memberships, age and size of the group can be factors that affects the group in terms of its growth, as result of competitive pressure []. Also, individual benefit of group members in collaborative tasks can be greatly driven by the impulse given by the group leader to increase commu-nity building []. The use of language within social communities has been studied by Postmeset al., who look at how interactional norms regulate the conversation style (e.g., use of abbreviations, superlatives) in small email discussion groups, shedding light on the processes of social construction and formation of social identity [].
More recent work in computational social science attempted to characterize groups in relation to well-established theories from social sciences. The dependency of activity and connectivity on group size has been studied in several platforms [, , ], showing rela-tions to Dunbar’s theory on the upper bound of around stable social relarela-tionships for an average human []. The dimension of similarity between members has been identified also as a factor driving the creation of social communities [], particularly given that, to a large extent, users in social networks tend to aggregate following the homophily principle []. However, similarity is not necessarily the strongest indicator for group activity and longevity, as diversity of content shared between group members is a major factor to keep alive the interest of members [].
Social and thematic components of communities have been widely studied in social science, most of all within the common identity and common bond theory on which part of the present work is based [–]. Nevertheless, the principles behind the the-ory have never been translated into practical methods to categorize groups, nor tested on large datasets. On the other hand, data-driven studies have investigated social and the-matic components separately when characterizing groups []. Preliminary insights on the interweavement between such dimensions have been given in exploratory work on Flickr, where signals of correlation between social density and tag dispersion in groups is shown [] and where two different clusters emerge naturally when plotting the groups size against the number of internal links []. In this work, we define metrics that can be used to predict if a group is social or topical and testing their effectiveness against a reliable ground truth.
2.3 Automatic group extraction
2.4 Information propagation
Modeling the dynamics of information diffusion and influence along network links has re-ceived much attention in the last decade, especially in relation to the task of optimization of viral marketing strategies []. A large corpus of studies on influence and information propagation has relied on Twitter-based experiments [, ]. In Flickr, instead, an analy-sis of information propagation based on favorites showed that diffusion is limited to indi-viduals who reside in the close neighborhood of the seed user and the spreading process is very slow []. In this paper we use the same propagation model to measure the effect that the boundaries of different groups may have on diffusion of information. Instead of representing the influence as an infection phenomenon between connected individuals, alternative models agnostic on the network structure that rely only on the time of the con-tagion have been proposed [, ], assuming the presence of a hidden concon-tagion web that might be different from the observed social network [].
Even though our contribution does not focus on the definition of information propaga-tion models, we measure informapropaga-tion diffusion through social links within different group types, motivated by recent findings that hypothesize a connection between group type and potential of propagation of information cascades [, ].
3 Metrics for group characterization
Geography, time and the duality between social and topical bias of groups are mentioned multiple times in previous work, as they are important aspects for the characterization of communities. Next, we consider those three dimensions and define new general metrics for each of them. All our metrics assume the presence of a user baseUand a set of groups
Gwhereg={u, . . . ,un},g∈G∧ui∈U. Users can belong to multiple groups and we
asso-ciate, with each group, a bag of user-generatedterms Tg(e.g., tags, group posts). We also
assume to have a set of actionsAg that members of a groupgperform within the group
(e.g., group subscription or photo upload in the group pool). In the following, we refer to these actions also as events. We consider space and time associated to those actions, respectively geo = (lata, lona) andt(a)≡ta,a∈Ag; when focusing on a specific type of
ac-tion, we will consider their temporal sequence, whose timestamps will be denoted simply asti,i∈[,n]. Last, we take into account also the social interactions between members of
a group and within groups. We adopt a very generalmultidigraphmodel that fits most of the current social media platforms. Members are represented as nodes, and each distinct
interactionbetween any two members is represented by a directed arc.
3.1 Geographical dispersion
Geographical distribution of group members can be very variable, as sometimes groups are very localized (e.g., members of a photography club in the same city) and sometimes very broad (e.g., Canon camera owners). When studying the geographical distribution of viewers of a given photo, Van Zwol [] proposed three metrics. First, the most direct way to gauge the sparsity is to compute the geodesic distance geodbetween all the pairs of locations
geod(lat, lon, lat, lon)
= rarcsin
sin
lat– lat
+cos(lat)·cos(lat)·sin
lon, lon
Figure 2 Illustration of methods to measure dispersion of geolocated points (in red) on a map. (a)Average of pairwise geodesic distances.(b)Diagonal of the bounding box defined by the standard deviations of latitude and longitude around the center of gravity (blue cross).(c)Same as(b)but with geodesic distance of the diagonal.
Figure 3 Illustration of the center-to-Earth distance method to measure dispersion of geolocated points (in red) on the Globe.Points are translated into spatial Cartesian coordinates, they are averaged, and the distance of the resulting point to the center of the Earth (in blue) is calculated as a measure of dispersion.
and to average them (Figure (a)). However, this scales quadratically with respect to the number of points and it could be computationally prohibitive when large sets of points are considered. For this reason, a second way to estimate dispersion is to compute the standard deviation for the longitudes and latitude separately and use them to build a bounding box around the centroid of the Cartesian coordinates (Figure (b)). Then the Euclidean dis-tance between the angles of the bounding box is considered ad a measure of spreading. This solution however does not consider the rounded surface of the Earth, thus biasing the results by the latitude: same values at different latitudes could imply very different dis-tances. A straightforward solution to solve this problem is to user the geodesic distance instead of the Euclidean distance (Figure (c)). Still, even if this solution accounts for cur-vature, it does not consider the Earth as spherical, as longitude is interpreted as a linear metric (e.g., two points at the two ends of the Bering strait will be considered very far from each other).
To address these problems we propose a new simple metric, the center-of-Earth distance (coed), to directly measure geographical dispersity, illustrated in Figure . We consider
each latitude-longitude pair as a polar-azimuth angle in the spherical coordinate system centered on the center of Earth. We convert all the points into the Cartesian system, so that every point is represented as points in the three-dimensional space. All the points are then averaged and, as they all lie on the spherical surface, their average will be a centroid that by definition will be under the Earth’s surface. The sparsity is then estimated by the distance of the centroid to the center of the Earth, normalized by the Earth’s radius. In the case-limit in which just one point is available (or many perfectly overlapping points), the geographical spreading will be maximally narrow (coed= ), whereas two points at the
leading to maximal sparsity. Additionally, we apply the arc-cosine to the final value to get an angle that more intuitively relates to the spreading of points on the spherical surface.
This solution is linear with the number of points, it considers the Earth’s curvature and it considers the World as spherical, thus addressing the limitations of previous approaches.
3.2 Temporal patterns
Similarly to geography, groups could exhibit also quite broad temporal patterns. The time series of events associated to a group (e.g., photo uploads) is the temporal footprint we aim to characterize. Of course, as each distribution in time is likely to be unique, we need to capture the peculiar features of each temporal pattern. We rely on the statistical properties of the distribution of the volume of actions in time to describe the time sequences. We identify four different properties: thecentral tendency, thedispersion, theskewnessand the
burstiness. In the following, we consider that all the events take place in a fixed, large time window [,T] (that will correspond to our temporal sample in the experimental data). Next, we define their meaning and propose metrics to capture each of them. The way to combine the metrics for a characterization of groups along the temporal axis will be discussed in Section ..
.. Central tendency
We consider a sequence of timestamps (t, . . . ,tn) in which events in the group occur. For
each group, we consider a normalized window where the start time is and coincides with the first group event (t= ) and ends at time , which coincides with the endT of our temporal sampling (which impliestn≤). We define the central tendency of a group as:
μtg=
n
n
i=
ti. ()
The output value is in the range [, ] and reflects the central tendency of distribution of events in time: the closer the value to the most time values happened at the beginning of the group’s life, the closer to , the most values near to the present. Groups with strong central tendency will have values close to ..
.. Dispersion
Dispersion denotes how stretched or narrow is a distribution. To measure dispersion we use a corrected version of the standard deviation using events in a normalized timeline:
σg=
n–
n
i=
ti–μtg
n( –μt g)μtg
. ()
.. Skewness
Another of the time properties we want to capture is skewness. It is calculated with the normalized difference between the median and the mean as follows:
γgt= μ
t
g– median t g
min(μt g, –μtg)
. ()
Again, values are in the [, ] interval. A divergence between the mean and the median im-plies a skewed distribution as more elements will have values either smaller or larger than the median. The correction factor in the denominator ensures the independence between the skewness and the central tendency, as shown in the Appendix.
.. Burstiness
Last, we use a measure of burstiness to check whether the events are grouped together and happen in big bursts. To capture this concept we consider the inter-event timetgij=
tj–ti,i<jis used. We denote astgthe overall series of inter-event times for groupg. The
burstiness is defined as follows:
=log μ tg–log median tg. ()
Note that the mean of all the inter-event timesμtgis equivalent to the total time between
thetandtn, divided by the number of events. The median of the inter-event times
in-stead will get values on the range (,μt
g)]. For the series with uniformly separated events,
μ(tg) and median(tg) will be equal whereas the groups with a bursty behavior will have a median(t
g) near to .
3.3 Topical and social groups
The “common identity and common bond” theory [] states that, depending on the prevalent motivation of people to join a group, groups can be categorized as eithersocial
ortopical, and assumes that the two types of groups have distinct and well-recognizable traits. In recent years, the theory has been widely commented and elaborated by social sci-entists from a theoretical perspective and through small-scale experiments [, , ], but no rigorous methodology to distinguish the two types has been developed nor tested on large-scale datasets.
We design a technique to detect the group type based on the common identity and com-mon bond theory, first to contribute to a strong validation of the theory itself but also to provide a general framework for automatic classification of user groups in online social media. In the following, we provide a more detailed description of the theory and then we propose a translation of its main principles into general metrics that can be applied to social graphs.
.. Identity and bond theory
based on their interest in the community as a whole or in a well-defined common theme shared by all of the members. People whose participation is due to identity-based attach-ment may not directly engage with anyone and might even participate anonymously. Con-versely, bond-based attachment is driven by personal social relations with other specific members, and thus the main theme of the group may be disregarded. The two processes result in two different group types, that for simplicity we name “topical” for identity-based attachment and “social” for bond-based attachment.
In practice, groups can be formed from a mix of identity and bond-based attachment, but very often they tend to lean more towards either sociality or topicality. According to the theory, the group type is related with thereciprocityand thetopicsof discussion. Mem-bers of social groups tend to have reciprocal interactions with other memMem-bers, whereas interactions in topical groups are generally not directly reciprocated. In addition, topics of discussion tend to vary drastically and cover multiple subjects in social groups, while in topical groups discussions tend to be related to the group theme and cover specific areas. According to the theory, social groups are founded on individual relationships between their members, therefore it is harder for newcomers to join and integrate with members that already have strong relationships between each other. One implication of this is that social groups are vulnerable to turnover, since the departure of a person’s friends may influence his own departure. Topical groups, on the other hand, are more open to new-comers and more robust to departures.
.. From theory to metrics
It is possible to construct metrics to differentiate between the two types of groups by quan-tifying the reciprocity of interactions, and the topicality of the information exchanged between group members. Next, we describe: (i)reciprocitymetrics, used to quantifying group sociality, (ii)entropyof terms, to determine how much the topics of discussion vary within a group, and (iii)activitymetrics, to measure the liveliness of the group. Similarly to the temporal dimension, the approach to combine all these metrics into a decision on the group type will be discussed in Section .., with specific examples on our Flickr case-study.
Reciprocity Reciprocity occurs whenever a user interacts with another user and that user responds her at any time later with the same type of interaction. We define intra-reciprocityof a groupgas:
rintg = E int,rec
g /
Eint,recg / +Eint,nrecg
, ()
whereEint,rec
g andEint,nrecg are, respectively, the number of reciprocated and
non-recipro-cated links internal to the groupg. Correspondingly, theinter-reciprocityat the border of the group is defined byrext
g , accounting for the reciprocity between members and
non-members.
We normalize the intra-reciprocity score using the average reciprocity valuerint
g over
all groups:
tg=
rint
g
rint
g
The larger the intra-reciprocity, the higher the probability that the group is social. Al-ternatively, to compensate for the effect of the correlation between reciprocity and the number of internal interactions, and to account for local effects, the intra-reciprocity can be normalized by the inter-reciprocity:
ug=
rint
g +
rext
g +
. ()
We add to both numerator and denominator to reduce the fluctuations ofugat low values
ofrext
g . This relative reciprocity compares the reciprocity between the members with their
reciprocity toward people not belonging to the group. It reflects how sociality of group members distinguishes itself from the environment.
Topicality The set of termsT(g) associated with a group indicates the topical diversity of the group. Thus we measure the entropy of the group as
H(g) = –
t∈T(g)
p(t)·logp(t), ()
wherep(t) is the probability of occurrence of the termtin the setT(g). The higher the entropy, the greater is the variety of terms and, according to the theory, the more social the group is. Conversely, the lower the entropy, the more topical the group is. In addition, since not all groups have the same number of terms and the entropy value grows with the total number of terms, we introduce thenormalized entropy hg, which is normalized by
the average value of entropy for the groups with the same number of terms:
hg=
H(g)
H(f)|T(g)|=|T(f)|. ()
Activity Even if, for the considered theory, activity is not a discriminative factor between social and topical groups, it is useful to characterize the liveliness of a community. Activity is quantified in terms of the number of internal interactions normalized by the expected number of internal interactions for a set of nodes with the same degree sequence:
ag=
Eint
g
(Din
gDoutg )/E
, ()
whereDin
g andDoutg are total numbers of interactions originated by members of the group
gor being targeted to members of this group, whereEis the total number of interactions in the network. If this property has a value higher than then the number of interactions internal to the group is higher than the number of interactions expected in a random scenario with the same group activity volume.
Another way of measuring activity of a group is by comparing density of its internal interactions with the density of its external interactions:
bg=
Eint
g /(sg(sg– ))
Eext
g /((N–sg)sg)
wheresgis the cardinality of groupgandNis total number of nodes in the network. Values
of bg greater than indicate a density of internal interactions higher than interactions
between the group and the rest of the network. This metric effectively compares intensity of interactions between members of the groups with the intensity of their interactions with the entire network.
4 Dataset and preprocessing
To test our metrics we use a dataset from Flickr. The wide variety of user groups, the richness of interaction types, and the openness of the data (retrievable through the public API) make Flickr an ideal platform for our study.
4.1 Flickr groups and interactions
We consider a random sample of public groups created until the end of year . Users of Flickr can create, moderate and administer their own groups. Most groups are open, so users can join without an invitation. Others are only by invitation and joining requires the administrator’s permission. In total, our dataset contains over K groups. For each of these groups, we extracted all the public information related to them (retrievable via the Flickr public API) and that we detail next. All the data has been anonymized and processed in aggregate. Table summarizes some statistics of the data described below.
First, for all the users of the groups, we collect public information of their profile, ex-tracting their interactions with other users or online objects, namely:
• Comments. Userucomments on a photo of userv. This interaction ismediated through the photo. We filter out the comments of users on their own photos, obtaining a total ofM comments.
• Favorites. Userumarks one of userv’s photos as afavorite. The interaction is mediated through the favorited photo. We extractM favorite interactions. • Contacts. Useruadds uservamong his contacts. Social contacts in Flickr are directed
and may be reciprocated. One person can choose another person as his contact only once and the relation remains in the same state until the contact is removed. There areM contacts in our dataset.
Additionally, we also rely on the information related to specific actions that users make to interact with the group itself:
• Uploads. Useruuploads a photopto the groupphoto pool. Flickr groups provide pools to store pictures related to the group and pictures can stay in multiple pools. Only members of the group can upload a photo to a pool.
• Subscriptions. Userujoins a the group at a certain time.
In addition to user-created groups (we refer to them asdeclared), in Section . we ana-lyze the sociality and topicality properties of groups that are not defined by users but are instead found by community detection algorithms (we name thesedetectedgroups). We applied the OSLOM community detection algorithm [] over the entire network of social contacts in our dataset. We choose OSLOM because it detects overlapping communities, which is a natural feature of real groups. Moreover, OSLOM has performed well in recent
Table 1 Total number of interactions and declared/detected groups.
Comments Favorites Contacts Decl. g. Det. g.
community detection benchmarks [] and it outperformed other algorithms we tested. OSLOM detected K groups.
We also usetagsof the photos as terms for our model. The primary set of photos from which we extract tags is the photo pool. Photo pools are available for declared groups only. In addition, in both declared and detected groups, the interactions between members of the group that are mediated through photos (i.e., comments, favorites) result in two addi-tional photo sets from which tags are extracted. We process the three tag sets separately (pool, comments, favorites), and for each of them we compute the normalized entropy (hpoolg ,hcomg ,hfavg ).
4.2 Socio-topical group labeling
The socio-topical dimension we consider is a rather abstract concept and we like to check whether our metrics are able to correctly capture it. For this reason, we need a reliable ground truth to check against the detected sociality and topicality scores. We asked hu-man coders to label groups based on well-defined guidelines extracted directly from the common identity and common bond theory []. For the labeling we randomly selected groups meeting the following minimum requirements: (i) more than members, (ii) more than internal comments, (iii) relative activitiesacom
g andbcomg higher than . The
third requirement ensured us that the selected groups were active well above the expected values in a random case. After this selection we obtained over K declared groups and over K detected groups. We describe the labeling process of such groups in detail next.
.. Information provided to labelers
The labeling is based on the human capability of processing the semantics, aesthetics, and sentiment behind text and photos. With the editorial process we generate a ground truth of “social” and “topical” groups. The coders were asked to make judgments in this respect and were presented with the following information for each group:
Group profile. The Flickr group profile consists of the group name, description by the creator of the group, discussion board, photo pool, and map of places where photos uploaded to the group pool were taken. This information is available only for declared groups.
Comments. We provide text of all comments that happen between the members. Com-ments are shown in chronological order and are grouped by thread, if they appear under the same photo. Additionally we also include a link to the photo.
Tags. Human coders are shown the list of the most frequent tags attached to the photos that mediate the internal comments to the group. The list is sorted alphabetically.
.. Labeling guidelines
I. Comments and photos. By examining comments and photos, find traces of people who know each other or who have a personal relationship. Knowing each other’s real names, spending time together, co-appearing in photos, sharing common past experiences, refer-encing mutually known places, and disclosing personal information are all signals of the presence of a social relationship []. The predominance of friendly and colloquial com-ments (e.g., jokes, laughter) is another element distinguishing social groups from topical groups. In topical groups, the atmosphere is more formal and comments tend to be more impersonal []. Examples of impersonal comments include expressing appreciation for photos, praising the photographers, thanking them for their work, or commenting on any particular topic in a neutral way. As a rule of thumb, if many personal comments are de-tected, then the sociality of the group should be considered high. If such comments are not many (e.g., just between small subsets of members), but the overall atmosphere of the interaction is rather personal and friendly, then we consider the sociality of this group as fairly present. If, on the other hand, comments are mainly impersonal and neutral, social-ity has to be considered low, in favor of higher topicalsocial-ity.
II. Tags and description. Read the tags and the profile description of the group. If the tags are semantically consistent then the topicality of the group should be considered high, and even higher if the name and description of the group corresponds to the content of the tags. In some cases, tags or group descriptions can contain words indicating personal relations or events (e.g., “wedding”, “grandpa”, names,etc.), indicating a higher sociality of the group. Tags can also contain names of specific locations. Geo-characterized tags can be reasserted by looking at the map of places where photos were taken. Such tags are a good indication that the sociality of the group is present, but that has to be confirmed through the inspection of comments.
The coders labeled the groups after judging the two aspects above. If both tags and com-ments are highly social or topical, then the choice of label is straightforward. If the tags are highly topical and the comments are not social then the group is labeled as topical, and vice versa. If the tags are a bit topical and comments highly social then the group is labeled as social. The labelers were asked to read as many comments as needed to arrive to a fairly clear decision.
.. Group examples
every complex annotation process. Nevertheless, the defined guidelines gave the labelers precise instructions and, as described next, we recurred to multiple independent coders to assess the quality of the extracted ground truth.
.. Labeling outcome
A total of declared groups and detected groups were labeled by people: two of the authors and an independent labeler who was not aware of the type of study nor of the purpose of the labeling. The inter-labeler agreement, measured as Fleiss’ Kappa, is . for the declared groups, meaning that there exists good agreement between labelers.
In order to assess the quality of the labels, we also counted the number of messages exchanged between group members. The counting was done anonymously in aggregate and the content of the messages was not accessed. Groups labeled as social contain around twice as many messages between their members compared to topical groups of similar size. Even if this does not constitute a proof of higher sociality, intuitively people who get in touch via one-to-one communication are more likely to have a more intimate social relationship.
The Kappa value for detected groups is around ., revealing lower agreement. A factor that partially determined such result is the lack of information about the group’s profile, since it is not available for detected groups. Another cause of the disagreement is a higher variability in the comments. This may be because we use a network of contacts for the purpose of finding clusters and defining detected groups, which may not be the best proxy of personal relations.
In total we label distinct declared groups and distinct detected groups. We char-acterize them in the following section.
5 Characterization of groups
We now describe the Flickr groups in our dataset according to the three dimensions iden-tified above. After a short analysis of the overlap between declared and detected groups, we inspect each dimension separately, discussing how the metrics we identified earlier are applied to groups. Last, we discuss the characterization of groups along all the three dimensions.
5.1 Overlap of groups with detected communities
Since community detection techniques have been largely employed in recent years to de-scribe the structure of complex social systems [], the need for a clearer assessment of the meaning of the detected clusters has been often expressed from different angles [, ], but never completely satisfied. In this study we contribute to shed light on this mat-ter by comparing the user-generated groups with the groups detected algorithmically (as described in Section ).
The groups from the two sets share typical properties of groups found in on-line social networks. The distribution of sizes of groups in both cases is heavy-tailed and close to power-laws (not shown). Declared groups tend to be much bigger, having on average members versus members in detected groups.
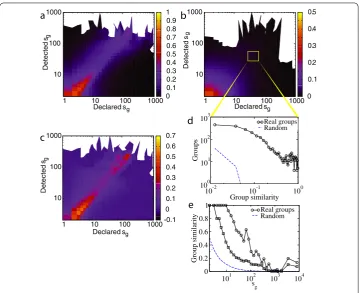
Figure 4 Jaccard similarity between declared and detected groups as a function of their sizes.
Diagonal shows an interesting pattern(a)which is not reproduced by randomized groups(b). We subtract
(b)from(a)and plot the result in(c), and a histogram of similarity values for a sample of groups lying at the diagonal in(d). For groups of various sizes, we plot 91th and 99th percentiles of similarity between declared and detected groups(e).
5.2 Spatio-temporal classes
Spatial characterization of groups is defined by a single dispersion metric coed. In Flickr
groups we have two potential different sources of geolocated data: user location and photo geotags.
Here we do not use the geolocations of users for two reasons. First, some users do not provide their position and the IP-based geolocation could be quite unreliable []. Last, we aim to characterize groups with the information that is directly related to that group rather than to an individual. For this reason, we consider the geotags attached to the photos uploaded to the group instead.
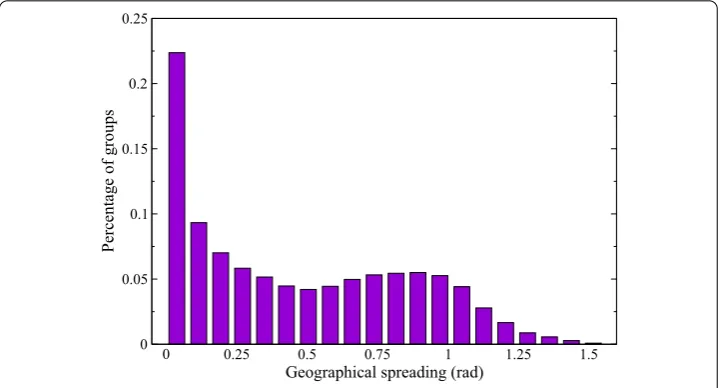
When we apply the dispersion metric using geotags, we obtain a distribution over groups that is shown in Figure . The histogram displays a bi-modal distribution: a first local max-imum around zero that includes the groups that contain photos geographically near, and a second local maximum with peak around the . radians (≈◦), that is approximately the angle between Europe and US, which are the two continents with highest data density. A random sample of photos in the dataset produces a peak at the same point (not shown), therefore suggesting that groups with those higher dispersion values are groups where the geographical aspect is not crucial to the purpose of the community.
To transition from a continuous value to a partition of groups into classes we apply the X-Means algorithm [] over the monodimensional space of dispersion values, to avoid manual thresholding. X-Means is an improvement over K-Means where the number of clustersKis not given and it is able to estimate the number of clusters and the clusters in a much faster way than optimizing the parameterKwith brute force approaches.
Not surprisingly, two clusters are found. Thegeo-narrowcluster, contains the % of groups, and the remaining % belongs to thegeo-widecluster.
The temporal aspect includes four different metrics that would be difficult to com-bine with ad-hoc approaches. Besides, we have two different sets of timestamped actions, namely user joining the group and photos uploaded in the goop pool. Therefore, similarly to the spatial clustering, we apply X-Means to this -dimensional feature space, obtaining three different clusters.
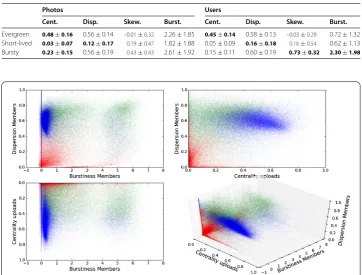
Table 2 Average and standard deviation of every feature in each of the clusters.
Photos Users
Cent. Disp. Skew. Burst. Cent. Disp. Skew. Burst.
Evergreen 0.48±0.16 0.56±0.14 –0.01±0.32 2.26±1.85 0.45±0.14 0.58±0.13 –0.03±0.29 0.72±1.32 Short-lived 0.03±0.07 0.12±0.17 0.19±0.47 1.82±1.88 0.05±0.09 0.16±0.18 0.16±0.54 0.62±1.13 Bursty 0.23±0.15 0.56±0.19 0.43±0.43 2.61±1.92 0.15±0.11 0.60±0.19 0.73±0.32 2.30±1.98
Figure 6 Scatter plot of the groups with respect to the three most discriminative features for the clustering on the temporal dimensions.Bursty groups are depicted in green, evergeen in blue, and short lived in red.
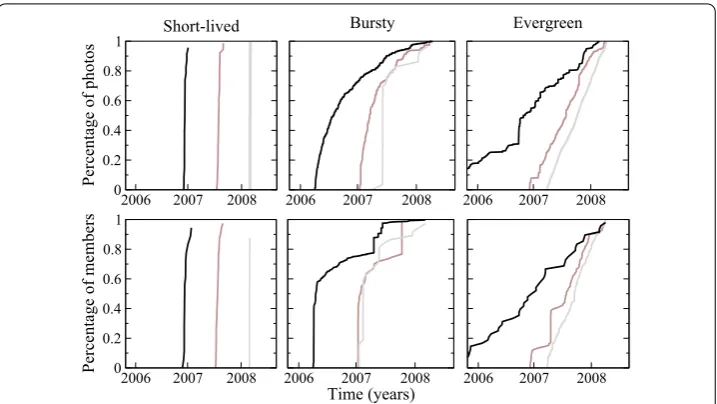
The average and standard deviation of every feature are displayed in Table . We find that the three most characteristic features are the dispersion and burstiness over users joining, and the centrality over photos uploaded. Figure shows a scatter plot of these three features for each cluster. After an inspection of the clusters, we name themevergreen,
short-livedandbursty. We report their peculiar features next.
Short-lived. The short-lived groups represent % of our sample and are characterized by low centrality and small dispersion. This category includes groups that had a little bit of activity after they were created and that became inactive shortly after. Examples in-clude limited-scope photo sharing groups whose activity ceases shortly after the photos are uploaded and consumed by small social circles.
Evergreen. The evergreen cluster is the biggest one, containing % of the groups. Groups in this cluster are characterized by their high centrality and dispersion values around .. were created at a certain point in the past and they have been growing in num-ber of users and photos uniformly until the end of the time period we consider. Examples include groups dedicated to general topics, such as groups hosting artistic portraits from amateur and professional photographers.
Figure 7 Evolution of each of the three most centered groups in each temporal cluster.Values on the
y-axis are normalized by the maximum values reached at the end of the time window of our dataset.
The evolutions of number of users and photo uploads for the three most representative groups in each class are shown in Figure .
5.3 Socio-topical classes
To tackle the socio-topical dimension we first characterize the two sets of groups in terms of the metrics we introduced in Section ... Then we study the relation between the labels of the declared groups annotated by the human coders and the values of the metrics. Additionally, we report ratios of groups labeled as social and topical among both declared, and detected groups.
.. Statistical properties of metrics
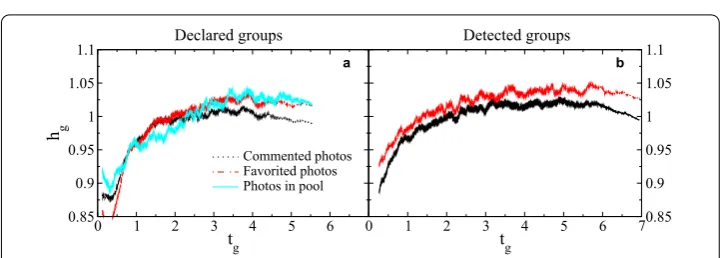
Besides directly comparing membership overlap, we study the variation of the metrics defined in Section .. with the group size. Reciprocity and normalized entropy have a wide local maximum for groups of sizes between and members, both for declared and detected groups, as shown in Figures (a)-(d). This holds for all interactions and all sets of tags, with the exception of contacts, for which the curves are relatively flat. A sim-ilar result has been reported in a recent study [] for pairwise interactions in Twitter by various community detection algorithms. We perform a random reshuffling of photos between groups, keeping the number of photos per group fixed. The normalized entropy calculated for the shuffled photos stays close to , as expected, and the maximum disap-pears. A possible interpretation of the existence of the maximum is that these sizes tend to correspond to social groups, while bigger groups are more frequently topical. Further findings to support this interpretation are presented in the next subsection.
Figure 8 Fluctuation of metrics with group size.Dependency of normalized reciprocity(a-b), normalized entropy(c-d)and relative activity(e-f)on size of groups for comments, favorites, contacts and photo pools, for declared and detected groups. Blue dashed line is for randomized photos(c-d)and groups(e-f).
Figure 9 Correlation between reciprocity of comments inside a group and entropy of photos commented or favorited between its members, or belonging to the photo pool of this group, for declared and detected groups.
com-munity detection algorithms tend by design to output node clusters with high numbers of connections between them.
.. Relation between metrics and group label
Here we analyze properties and values of the metrics for groups labeled through the ed-itorial process. First, the ratio of groups labeled as social differs between declared and detected groups. In declared groups we find around % social groups, whereas among detected groups almost % are labeled as social. Additionally, we picked detected groups among the ones that are the most similar to declared groups. Specifically, we se-lected them randomly from the th percentile shown in Figure . These groups have significant overlap with declared groups and should share similar properties. Indeed, the ratio of groups labeled as social among them is closer to that of declared groups and equal to %. We conclude that detected groups are more likely to be social than declared ones. It is a somewhat expected result, since clustering algorithms detect dense parts of a net-work, and so they are inclined to detect areas with more reciprocal connections. Note that the theory envisions more reciprocal relations in social groups. Thus, community detec-tion algorithms are more likely to find social groups, however, determining to what extent it happens is not trivial.
One of the expectations is that bond-based groups should not be very large, as the hu-man capacity for stable relationships is limited. As pointed in Section .., the Dunbar number can be considered as a possible cap for the size of such groups, while topical groups do no yield such a restriction. In line with this expectation, we find that declared groups labeled as social have on average members, whereas groups labeled as topical have on average around members.
We find insightful differences and similarities in various properties, which we explore in detail in Figure . We plot them as a function of the size of groups as they vary drasti-cally with it, and one needs to compare groups of similar sizes in order to draw unbiased conclusions.
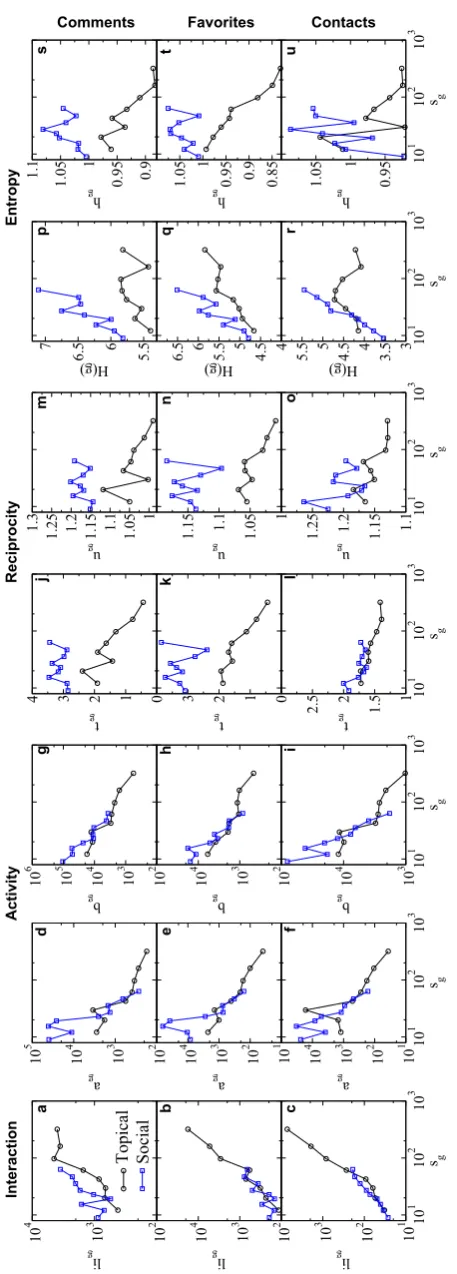
First, there are almost no differences in the number of photos (not shown), favorites, and contacts (as in Figures (b), (c)) inside social and topical groups. The number of comments is, however, around times higher in social groups than in topical groups of similar size (Figure (a)). More differences can be found when looking at relative activity (Figures (d)-(i)), which compares the interaction internal to the group with the overall activity level of users belonging to groups. In all three types of interaction the relative ac-tivity metrics for social groups yield values from to over times higher than for topical groups. These metrics compare activity internal to the group with activity external to it. Therefore this result may reflect a stronger focus or even a possible isolation of members belonging to social groups from the rest of people they interact with.
F
igur
e
10
A
v
er
ages
of
v
a
rious
topical
(black
cir
cles)
and
social
(blue
squar
e
s)
gr
oups
as
a
func
tion
o
f
their
siz
e
.
Each
point
cor
re
sponds
to
30
g
roups
for the tags extracted from photos commented, and favorited between members. Assum-ing that tags of photos represent topics of interaction, the result is consistent with bond attachment. It is expected for members of bond-based groups to cover many different top-ics and areas in their interactions, whereas members of identity-based groups focus their interactions on specific topics. However, this does not hold for the tags extracted from photo pool of the group (Figures (r), (u)). Apparently, the content of the photo pool does not always reflect well the interactions and relations between members of the group. Additionally, we plot the fraction of groups labeled as social with respect to group size, activity, reciprocity, and entropy (Figure ). The size of the groups correlates negatively as expected (Figure (a)). The correlations with the number of interactions and relative activityag are rather weak (Figures (b), (c)), whereas surprisingly there is a strong
de-pendency on relative activitybg (Figure (d)). For the lowest values ofbcomg , % of the
groups are topical, while for the highest, % of the groups are social. High values ofbg
can mean stronger group-focus, or even an isolation of the group members from the rest of people they interact with. It may relate to the fact that it is hard to enter bond-based groups due to strong relations existing between their members and because high invest-ment is required to create such relations with them []. Direct reciprocity of interactions, with the exception of contacts, correlates strongly with social groups (Figures (e), (f )). We strongly expected this result based on bond attachment. Furthermore, we found that the entropy of tags correlates with social groups, but entropy based on other sources does not (Figure (g)). However, we find that our normalized entropy performs much better than this, and a strong correlation is found both for tags extracted from comments and from favorites (Figure (h)). This shows that the normalized entropy of tags may be the most proper way of measuring topical diversity of communications of a set of people.
.. Group type detection
The properties of labeled social and topical groups tend to confirm the validity of the prin-ciples identified by the common identity and common bond theory. A stronger confirma-tion would directly come from the ability of the defined metrics to predict the tendency of a group towards sociality or topicality. To this end, we propose and compare two methods to predict the group type and we test their accuracy over the corpus of the labeled groups.
Prediction methodology The first approach we use is a linear combination of the met-rics. To this end, we select the features that are the most related to the sociological theory and for which we built specific metrics, i.e.,tg,ug andhg. Each of them is applied to the
different interaction types and bags of tags, which produces a total of values. We trans-form the values of the metrics into theirt-statistics by subtracting the average value and dividing them by the standard deviation of the distribution. Then we weight the normal-ized scores evenly by dividing them by the total number of metrics considered and we finally sum them up to obtain a singlescore Sg. All of the components are supposed to
score high for social groups. Therefore, the higher the value of the score, the higher the chance that the group is social rather than topical. To convert the score into a binary label, a fixed threshold above which groups are predicted to be social must be selected. Using this approach, we aim at testing if those metrics, based on the theory, can be successful in predicting the type of group (social or topical).
data to learn a prediction model. The trained classifier then outputs a binary prediction for any new group instance defined in the same feature space. Due to the limited size of our corpus of labeled groups, we estimate the classifier performance using -fold cross validation. We report results on a Rotation Forest classifier, which performed best in com-parison to several algorithms implemented in WEKA. For the classifier we used a wider set of features than for the linear combination approach, namely: group sizesgandEintg ,ag,
bg,tg,ug,H(g),hg, each applied to the different interaction types and bags of tags. This
results in a total of features. We selected such a wide set of features to test if indeed the metrics proposed to distinguish between the social and topical groups are the best ones for the task. The relative predictive power of the features is measured through a feature selection algorithm.
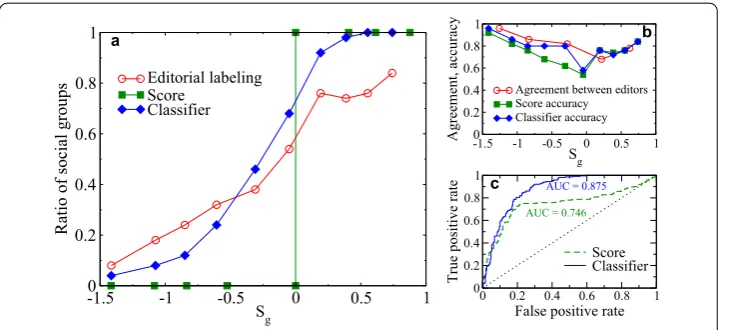
Prediction results The ratio of groups labeled as social increases quickly with the score
Sg, as shown in Figure (a). This summarizes the findings of previous sections, suggesting
that the features embedded in the score are able to capture well the nature of the groups. The higher the score, the higher the probability that the group is social; the lower, the more topical. When the score is around zero, groups can be either social or topical, or both, meaning that a decision on the nature of the group may be more difficult. If we fix the threshold for theSg value in order to perform a binary group classification, it is
clear that several misclassifications will occur, especially around the threshold value. An example for threshold at is shown in Figure (a). Conversely, the classifier performs much better and achieves the ratio that adheres much more to the actual ratio of social and topical groups.
Both methods, however, fail more frequently for groups with mixed social and topical features. The prediction accuracies of the classifier and of the score-based predictions have an evident drop of performance around (Figure (b)). The accuracy at the extreme values of the score is close to ., while it falls below . for groups with a score close to . On the other hand, this drop appears also in the agreement between two of the human
Figure 12 Comparison between prediction methods. (a)Ratio of groups labeled as social versus the score. The same ratio is plotted for the score-based (threshold at 0) and trained classifier predictions.(b)The accuracy of prediction of the two techniques and agreement between two of the labelers against theSg
Table 3 Group type prediction performance using (i) the score with threshold at 0, (ii) 10-fold cross validation on a Rotation Forest classifier trained on all the features, or (iii) the same classifier trained on the set of top-5 predictive features, according to the Chi Squared feature selection.
Method Accuracy AUC
Score 0.763 0.749
Classifier 0.801 0.879
Classifierχ2
top5 0.803 0.872
labelers, measured as a ratio of groups that have been given the same label. Apparently, this is a shortcoming of the binary classification itself, as opposed to multi-label classification. The overall performance of the two approaches can be compared fairly through ROC curves (Figure (c)), which astray from the selection of a fixed threshold. The curve for the classifier (computed for the -fold cross validation) always performs better, and this is reflected in the considerably higher AUC value and accuracy, as shown in Table .
In addition, to determine the most predictive features, we rank the features using Chi-square feature selection. The top features are, in decreasing order of importance:hcomg ,
tcom
g ,ucomg ,hfavg , andbcomg . The selected set is the optimal for the prediction performance:
retraining the classifier on such restricted set of features results in stable performance, as shown in Table . The top most predictive features correspond directly to the ex-pectations of the theory and results of the analysis from Section ; in other words, the normalized entropy of comments on the photo within the group and the reciprocity of comments exchanged between members are the best predictors of the socio-topical di-vide of groups. More surprisingly, as not explicitly mentioned in the original theory, also the amount of activity, namely the normalized activity in commenting in our case (bcom
g ),
is another good predictor. However, this is understandable, as we have already remarked on its importance and commented on its interpretation in Section .
5.4 Three-dimensional characterization
Once groups are characterized by each aspect separately, a natural question is whether there are some cross-dimensions relationships between group types, or in other words if different clusters of groups in one dimensions correspond predominantly to some other type of group in the other dimension. Blending all the metrics in a single model would be a way to answer the question. However, such unifying approach would be quite unprac-tical because of the different nature of the group characterization problem in different dimensions (clustering for geo-temporal, classification for socio-topical) and because of the difficult interpretation of a model that blends together such diverse types of measures. For these reasons, we use a more modular and simple approach to analyze groups along the three dimensions together just by looking at the intersections between differ-ent classes. In this way we obtain an easier interpretation of results. Since there are two spatial classes (geo-wide and geo-narrow), three temporal classes (evergreen, short-lived and bursty), and two socio-topical classes (social and topical), there are possible combi-nations of classes. The relative volume of the Flickr groups in our sample for each of them is reported in Table .