A Bit Vector Based Binary Code Comparison Method for
Static Malware Analysis
Ki-Su Kim
1, Hyo-Jeong Shin
2, Hyong-Shik Kim
1*1 Department of Computer Science & Engineering, Chungnam National University, Daejeon, korea. 2 Software Research Center, Chungnam National University, Daejeon, korea.
* Corresponding author. Tel.: +82-42-821-6277; email: [email protected] Manuscript submitted May 30, 2017; accepted July 5, 2017.
doi: 10.17706/jcp.13.5.545-554
Abstract: As variants of malicious codes have made it difficult and complicated to detect possible threat in the Internet, it is one of the most important challenges to analyze the malwares correctly in a timely manner. It has been also observed that we need static analysis as well as dynamic analysis to detect the malware correctly. In this paper, we define a bit vector to characterize a binary code, and utilize it for static malware analysis. Since each bit of a bit vector is organized to indicate the existence of a certain function or code block, we could replace a comparison operation on binary codes by simple logical operations. Common features of a group of binary codes could be also captured by bit vectors, which would be used to determine whether another binary code is similar to those of the group or not. Experimental results show that the bit vector could be effectively utilized to do static malware analysis, and that the group bit vectors could help classify the malwares into their appropriate groups.
Key words: Binary code comparison, static malware analysis, bit vector representation.
1.
Introduction
Most computers and networks are very susceptible to various kinds of cyber attacks these days. A common means of these attacks is a malicious software, simply malware. Even a single instance of malware could make a damage on a computer or a network by infecting essential files, replicating it onto other devices, spying silently on users, and even triggering system crashes. A malware sometimes remain hidden or dormant for a long time before it starts to act.
Recently it has become difficult to detect malwares using traditional techniques since a carefully crafted malware could generate its variants easily and spread them widely in a short time period. It is one of the most challenging problems to detect such malwares by their inherent properties – how it looks like the existing malware and how it behaves.
There are two approaches towards analyzing malwares – static analysis and dynamic analysis. Although both analyses perform the same function of detecting malwares, basic mechanisms underlying such analysis are very different. Static analysis investigates the inside of malwares at the binary code level, while dynamic analysis executes the malware to figure out how it behaves. It is believed that both static and dynamic analyses are required together to investigate the malware and its related security threats correctly.
tools such as disassemblers and debuggers to make the analysis easier. Static analysis has some inherent advantages over dynamic analysis. Static analysis is much safer to apply since it does not execute a malware, and thus usually consumes much less resources and time compared to dynamic analysis
There are two example cases of developing a variant with existing malwares. The simplest one is just to replace some strings by another ones to escape from a signature-based analysis. The common and feasible way of crafting a similar malware is to copy some functions or code blocks from the existing code, which would relieve the programmer from tedious task of developing the same code segment again.
Therefore, it seems that a variant of a malware would share some functions or code blocks with its original version in a certain degree. The existing signature-based analysis methods, however, do not work effectively, since the variants would make a totally different signature from the original.
Another problem associated with static analysis is that the amount of time required to analyze the whole set of a binary code increases sharply as the number of codes increases. Since the pairwise comparison involves n2 operations with n entities, we may need to extract some features which are common to a group of binary codes and utilize them to make the comparison process go faster.
In this paper, we propose a binary code comparison method that is based on bit vector. We construct a bit vector for a binary code, and carefully set its individual bit so that each bit indicates the existence of a specific function or code block. We will suggest a procedure of deriving a bit vector from a given binary code and show some necessary operations for further static analysis on binary codes.
The bit vector is organized to represent the whole code like a feature value. In order to prove the effectiveness of the bit vector, we will show a set of bit vectors could be used to recognize malwares among others on a group basis rather than on an individual.
This paper is organized as follows. The next section shows some related works first, and then the bit vector will be introduced at section 3. Our binary code comparison method based on the bit vectors will be explained at section 4, and section 5 shows some experimental results. Section 6 concludes this paper.
2.
Related Works
Since the signature-based comparison is very discriminative, it has been widely deployed for static analysis on binary codes. In order to overcome some inherent limitations involved in static analysis, T. Kim
et al extracted the sequence of APIs from binary codes and used it to determine the similarity of any two binary codes [1]. They also suggested an idea of decomposing a binary code to a set of functions and code blocks and compared them with respect to the so-called major blocks [2]. They defined the major block as a code block that has some remarkable features, and assumed a binary bode that shares the same major block could be regarded as similar.
An n-gram model has been used as a kind of probabilistic language model in a wide area. Since n-gram frequency profiles could be used as a simple and reliable means to categorize some objects in a predefined way, there were some approaches of applying the n-gram model to static analysis on binary codes, too. Pektas et al. suggested a method of classifying malware instances by using n-gram features of its disassembled code [3]. They defined n-gram as a fixed size sliding window of byte array, and extracted an
n-gram vector to represent so-called subfamily. Moskovitch et al. applied n-gram based algorithm to more than 30,000 binary codes [4]. Their ideas are based on text categorization concepts, which were used for their extensive evaluations on the binary codes.
and carried flow-based analysis on it to capture security-oriented program behavior, and then showed that it is possible to find critical behaviors against security policies.
Christodorescu et al. also tried static analysis to detect malicious patterns [7]. They regarded malicious code detection as an obfuscation-deobfuscation game between malicious code writers and inspectors. They claimed that malicious code writers attempt to obfuscate the malicious code to subvert the malicious code detectors and then proposed an architecture of detecting such malicious patterns effectively.
3.
Bit Vector Representation of Binary Code
3.1.
Decomposing a Binary Code
A binary code is decomposed into a set of functions and code blocks. Note that since a binary code could be disassembled to a sequence of assembly instructions such as push and return, we could divide even a binary code into a set of functions. A function, in turns, could be decomposed as a sequence of basic blocks. A basic block is literally defined as a sequence of instructions with no branch targets except at the entry and no branches out except at the exit. Since we are concerned about dividing the whole code into smaller but meaningful pieces for analysis purpose, we do not have to follow the definition in a strict way. We also had to consider the case that the code has been scrambled or obfuscated to avoid possible reverse engineering. That is another reason why we had to develop our own definition of basic block. In this paper, we use the term of code block simply to indicate another version of basic block modified for analysis purpose.
Let’s take an above example instruction sequence of a function to explain what to consider before decomposing a whole binary code. The code sequence has some variant part, which constitutes an operand of an instruction. Since 0x00402097 acts as the target address of call instruction, for example, the next call instruction may take a different value for its target. Push instruction also assumes an operand for its own purpose, and thus a couple of push instructions may take different values as their operands.
In order to characterize each function or code block for comparison purpose, it would be better to regard both push instructions as the same regardless of their different operands. It is because the operands do not carry any significant meanings as far as the behavior is concerned. The case of call instruction is, however, different from the push instruction, since its operands are filled with its target address, which may give some hints on control flow.
We replace these constant operands by a simple null value to avoid having them make any effect on comparison. The following instruction sequence shows a refined one. Register operands are preserved, while immediate operands are replaced by NULL except call instruction.
3.2.
Constructing a Bit Vector
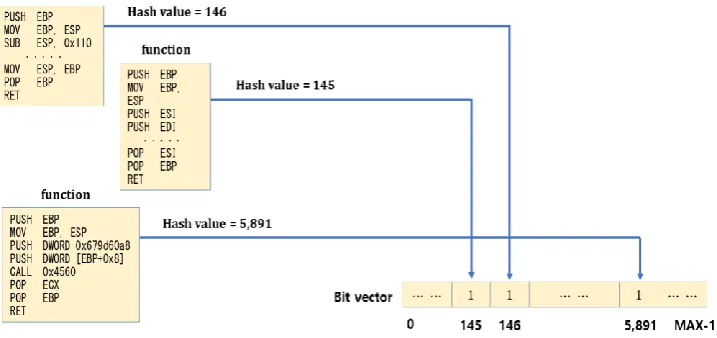
Once we divide a binary code into a set of functions or code blocks, the next step is to assign a feature value to each function or code block. We use hashing function to derive the feature values from a function or a code block. Since the set of hash values are still difficult to process for comparison purpose, we define a bit vector, which is literally composed of individual bits. Each bit represents whether its associated function or code block is in the set or not.
Suppose that we get a hash value v with a given function. The bit vector is produced long enough to provide required space for each hash value, so there should be a bit at the location v. We set the value at the location as 1 to indicate that there is a correspond function in the binary code. Fig. 1 shows an example case of constructing a bit vector with three given functions. In the figure, each function is summarized to a hash values 145, 146, and 5,891 respectively, and the bit locations whose indices match with the hash values are all set to 1. If the three functions are all that constitute a binary code, the other bit locations are filled with 0.
Fig. 1. Constructing a bit vector with a binary code.
could be easily eliminated with the bit vector.
4.
Binary Code Comparison Using Bit Vector
4.1.
Exact Match and its Limitations
If a couple of binary codes are composed of the same functions (code blocks), those bit vectors should be the same. Every single bit has the same 1 or 0 with those bit vectors. Note that we have already eliminated the constant portion. If two binary codes are different only in constant values, they are regarded as the same since a bit vector is exactly equal to the other’s.
Suppose that two binary codes are different in a few functions, or a binary code does not have functions that are a part of the other. Their bit vectors should be different in those correspond bits. Since their similarity sometimes does matter while comparing binary codes, it is more important to decide similarity rather than equality.
4.2.
Measuring the Similarity Rate
We could measure the similarity of two binary codes by counting different bits of their bit vectors, which is sometimes expressed as the distance of two vectors. The vectors (1, 1, 1, 0) and (1, 0, 1, 0) are said to have the distance of one since those vectors are the same except a single bit, which means that their associated binary codes are different only in a single function. The first one has three functions, while the second one does not have one of the functions.
Now, the similarity between binary codes could be measured with bit vectors. The problem of comparing two binary codes is reduced to that of comparing their associated bit vectors. In order to measure the similarity between two bit vectors, we use Jaccard Index [8], which is defined as in (1).
1 2
1 2
1 2
Similarity rate( , ) BV BV ,
BV BV
S S
BV BV
S S
(1)
where and represent two bit vectors respectively, and means the set of bit locations where the bit is assigned to 1.Note that | | denotes the cardinality of , which indicates how many functions the binary code is composed of.
For the bit vectors BV1 = (1, 1, 1, 0) and BV2 = (1, 0, 1, 1), their similarity is measured as 2/4 = 1/2. Note that and apply together, since the bit vector observes the properties of Boolean algebra. With the given and , for example, and are (1, 0,
1, 0) and (1, 1, 1, 1) respectively. Therefore, the above expression could be rewritten as in (2).
1 2
1 2
1 2
Similarity rate( , ) BV BV .
BV BV
S S
BV BV
S S
(2)
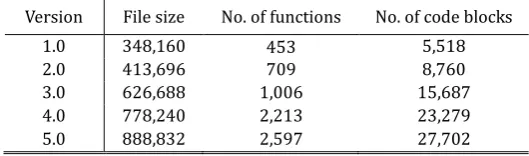
Table 1. Characteristics of Notepad Programs
Version File size No. of functions No. of code blocks
1.0 348,160 453 5,518
2.0 413,696 709 8,760
3.0 626,688 1,006 15,687
4.0 778,240 2,213 23,279
In order to verify the feasibility of similarity rate, let’s take an example case of a well-known program. The Notepad program equipped with Microsoft Windows has been revised many times. However, those versions still look similar to each other. Table 1 shows some characteristics of each version of Notepad programs.
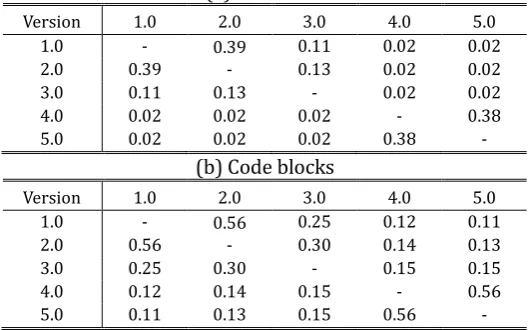
We measured the similarity of each pair of versions using the above expression. Table 2 shows the result. We repeated the same measurements with functions and code blocks. First, we divided a binary program into a set of functions and generated a bit vector on a function basis, and then repeated it on a code block basis. Analytical results show that version 2.0 and version 5.0 are very similar with its preceding versions respectively, while version 3.0 and version 4.0 are not. It looks like there was a major revision from version 3.0 to version 4.0.
The next experiment with a set of code blocks showed a similar result, however the similarity rates are higher than those with a set of functions in a certain amount. The chances of finding the exactly same ones would go higher with code blocks than functions, since code blocks are generally a part of a function.
4.3.
Measuring the Inclusion Rate
Even though the aforementioned Jaccard index is one of good metrics to get similarity rate between a pair, there is still a room for improvement. We found that the similarity between a pair of malwares mostly comes from copying a part of actual code while building a new one. Therefore, it would be more informative to measure how many reference functions or code blocks are actually found with a new binary code.
In order to calculate the portion of the functions or code blocks copied from the reference code, the
inclusion rate is defined as in (3).
Inclusion Rate( , ) BVi BV BV BVi ,
i
BV BV
S S S
BV BV
S S
(3)
where represent a new binary code under examination and is a for reference binary code. For the
bit vectors BV1 = (1, 1, 1, 0) and BV = (1, 0, 1, 1), the inclusion rate of BV1 over BV is measured as 2/3. Note that we do not count the second function or code block into consideration, since it is not used at all by the reference code.
We again analyzed the Notepad programs with inclusion rates as in Table 3. The leftmost column shows the reference version, and the next columns show the inclusion rate of a specific version with the reference.
Table 2. Similarity Rate Analysis on Notepad Programs (a) Functions
Version 1.0 2.0 3.0 4.0 5.0
1.0 - 0.39 0.11 0.02 0.02
2.0 0.39 - 0.13 0.02 0.02
3.0 0.11 0.13 - 0.02 0.02
4.0 0.02 0.02 0.02 - 0.38
5.0 0.02 0.02 0.02 0.38
-(b) Code blocks
Version 1.0 2.0 3.0 4.0 5.0
1.0 - 0.56 0.25 0.12 0.11
2.0 0.56 - 0.30 0.14 0.13
3.0 0.25 0.30 - 0.15 0.15
4.0 0.12 0.14 0.15 - 0.56
-Note that the rates are not found symmetrically – The inclusion rate of version i with the reference version j
should be different from that of version j with the reference version i. As with the experiment with similarity rates, the inclusion rates are higher with code blocks than functions.
Table 3. Inclusion Rate Analysis on Notepad Programs (a) Functions
Version 1.0 2.0 3.0 4.0 5.0
1.0 - 0.71 0.32 0.09 0.09
2.0 0.47 - 0.27 0.08 0.07
3.0 0.15 0.19 - 0.06 0.06
4.0 0.02 0.03 0.03 - 0.59
5.0 0.02 0.02 0.03 0.52 -
(b) Code blocks
Version 1.0 2.0 3.0 4.0 5.0
1.0 - 0.87 0.66 0.42 0.43
2.0 0.60 - 0.60 0.37 0.38
3.0 0.29 0.38 - 0.30 0.32
4.0 0.14 0.19 0.24 - 0.76
5.0 0.13 0.17 0.22 0.68 -
For the version 2.0, about 71% of functions or about 87% of code blocks seem to come from the version 1.0. The inclusion rates of version 5.0 with the reference of version 4.0 are also remarkable. The inclusion rates with the reference of its preceding version are 87%, 60%, 30%, and 76% with respect to code blocks. It is interesting that the inclusion rate of version 5 is slightly higher than version 4 with the reference of any preceding versions. It is analyzed that some parts of version 5.0 were rolled back to the older than version 4.0, after making a major revision with version 4.0 Considering all the observations, the inclusion rate seems to work as a meaningful indicator for static malware analysis purpose.
5.
Experiments
5.1.
Environment
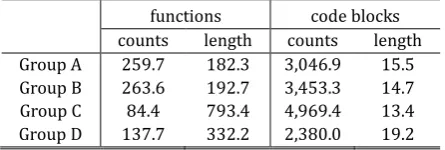
In order to prove the effectiveness of our bit vector-based analysis method, we did further analyses with 600 malwares. Since we wanted to show how effectively the bit vector could be used for static malware analysis purpose, we collected 150 malwares each from four groups, and built a pool of 600 malwares. Since the four groups had been formed by dynamic behavior analysis, each group may contain more than one kinds of binary codes with viewpoint of static analysis. Table 4 shows some statistics on functions and code block for each group.
Table 4. Characteristics of Four Malware Code Groups
functions code blocks
counts length counts length
Group A 259.7 182.3 3,046.9 15.5
Group B 263.6 192.7 3,453.3 14.7
Group C 84.4 793.4 4,969.4 13.4
Group D 137.7 332.2 2,380.0 19.2
similar result with a code block basis experiments.
5.2.
Distribution of Bit Vectors
Fig. 2 visualizes all bit vectors for 150 malwares of Group A. In figure (a), there are 150 rows, each for individual malware. A column is assigned for a function that has more than a predetermined number of occurrences. Since the bit vector is assumed to be 65,536 bit long, the figure shows the bit locations for some frequent functions rather than all functions for the sake of intuitive insight. The colored portion means 1 bit, while the white space means 0 bit.
(a) unordered bit vectors (b) ordered bit vectors Fig. 2. Bit vectors for a group of binary codes (Group A).
Even though there are some patterns found in the plot, the Figure (a) is less informative than the figure (b), where we rearranged the order by the number of 1 bits. We simply moved up the bit vector that has more 1 bits than others. Figure (b) implies that there should be some common bit vectors that would represent a bundle of malwares together. Ignoring the trailing bit vectors at the bottom part, we could say that there are three distinct bit vectors found with group A.
By applying the same method to group B, C, and D, we have got 8 more bit vectors – 3 bit vectors for group B, 2 bit vectors for group C, and 3 bit vectors for group D. We call the 11 bit vectors as group bit vector hereafter, since they will be used as a feature value of their groups.
5.3.
Grouping Binary Codes
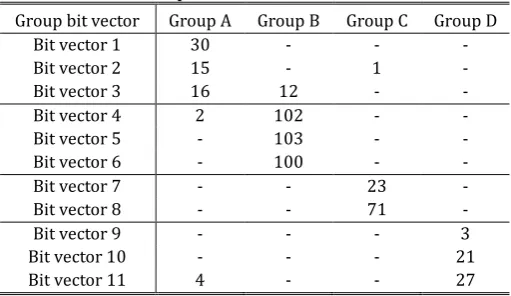
In order to investigate how effectively the group bit vector could classify malwares, we compared all 600 malwares against the 11 group bit vector. Table 5 shows the number of malwares that each group bit vector recognizes as belonging to its group. Note that malwares had been clustered to form a group by dynamic analysis.
Table 5. Group Bit Vectors for 600 Malwares
Group bit vector Group A Group B Group C Group D
Bit vector 1 30 - - -
Bit vector 2 15 - 1 -
Bit vector 3 16 12 - -
Bit vector 4 2 102 - -
Bit vector 5 - 103 - -
Bit vector 6 - 100 - -
Bit vector 7 - - 23 -
Bit vector 8 - - 71 -
Bit vector 9 - - - 3
Bit vector 10 - - - 21
Bit vector 11 4 - - 27
vectors 2 and 3 of group A also detect 15 malwares and 16 malwares respectively. Even though the group bit vector 2 is generated to features group A, the bit vector detected a malware of group C as belonging to group A. As already mentioned, group classification had been performed with dynamic behavior analysis, which had determined the malware as similar to group A. However, static analysis seemed to found a remarkable number of functions that the malwares of group C usually have.
Group bit vector 4 detected not only the malwares of group B, but also 2 malwares of group A, which is again not consistent with dynamic analysis. Group bit vector 11 also detected 4 malwares of group A in addition to the malwares of group D. However, such exceptional cases are not found widely throughout our experiments. Considering that static analysis mechanisms are basically different from dynamic ones, those exceptions are in an acceptable range.
Malwares classified by bit vector 7 are different from those classified by bit vector 8, even though both vectors are originated from the same group. In other words, they seem to be composed of different functions, but behave in a similar way. However, malwares classified by bit vector 4, bit vector 5, and bit vector 6 are overlapped in a certain degree. It is partly because those bit vectors themselves are very similar in bit patterns. We may have to keep all those bit vectors nonetheless since there are still some differences in the binary codes that those bit vector could detect.
6.
Conclusion
In order to represent a binary code with a single feature value for comparison purpose, we introduced a bit vector whose bit indicates the existence of a certain function or code block. We showed how to derive such a bit vector from a given binary code using a hash function, which computes the location (or index) in a bit vector.
With the bit vector, we could make it even easier to compare a pair of binary codes. Applying some simple logical operations to the vectors and counting the number of 1 bits are just sufficient for comparison. We also introduced the inclusion rate in addition to the similarity rate, and showed how effectively those rates are used for static analysis on binary codes.
The bit vector also makes it possible to compare a single binary code to a group of binary codes that share common features, with the same way as we do for pairwise comparison. Once we extract the common features into a few group bit vectors, we could use them for group comparison.
The experiments with a set of group bit vectors are encouraging. We extracted 11 group bit vectors for 600 malwares, and successfully classified more than a half codes into their appropriate group using the vectors. Careful inspection on the binary codes also confirmed that our bit vectors had classified them in a correct way.
We are now developing a formal procedure of deriving bit vectors from a group of malwares. Since we utilized a group of malwares that had been already classified by dynamic analysis, we may have to refine the procedure including its associated threshold values so as to work with a collection of arbitrary binary codes. We are also considering the situation when a sequence of binary codes arrive to be checked with accumulated reference bit vectors. It is also challenging to maintain the bit vector as short as possible to reduce analysis time.
Acknowledgment
This work was supported by Institute for Information & Communications Technology Promotion (IITP) Grant funded by the Korea Government (MSIP) (B0101-16-0300, The Development of Cyber Blackbox and Integrated Security Analysis Technology for Proactive and Reactive Cyber Incident Response)
[1] Han, K. S., Kim, I. K., & Im, E. G. (2011). Malware family classification method using API sequential characteristics. Journal of Security Engineering, 8(2), 319-335.
[2] Kim, T., Kim, I. K., & Im, E. G. (2012). Malware detection method via major block comparison. Journal of Security Engineering, 9(5), 401-416.
[3] Pektas, A., Eris, M., & Acarman, T. (2011). Proposal of n-gram based algorithm for malware classification. Proceedings of the 5th International Conference on Emerging Security Information, Systems and Technologies (pp. 14-18).
[5] Shabtai, A., Moskovitch, R., Elovici, Y., & Glezer, C. (2009). Detection of malicious code by applying machine learning classifiers on static features: A state-of-the art-survey. Information Security Technical Report, 14(1), 16-29.
[6] Bergeron, J., Debbabi, M., Desharnais, J., Erhioui, M. M., Lavoie, Y., & Tawbi, N. (2001). Static detection of malicious code in executable programs. International Journal of Requirement Engineering, 184-189. [7] Christodorescu, M., & Jha, S. (2006). Static Analysis of Executables to Detect Malicious Patterns.
Madison: Computer Science Department, University of Wisconsin.
[8] Harmers, L., Hemeryck, Y., Herweyers, G., Janssen, M., Keters, H., & Rousseau, R. Similarity measures in scientometric research: The jaccard index versus salton’s cosine formula. Information Processing & Management, 25(3), 315-318.
Ki-Su Kim received the B.E. degree in computer science and engineering from Chungnam
National University, Korea in 2015, and is now a master-course student. He has participated in a project of analyzing malwares for the cyber blackbox during his master studies and developed a method of characterizing and classifying malwares in a static method.
Hyo-Jeong Shin received the B.S.E. in computer engineering, and the M.S.E in computer
engineering from Seoul National University, Korea in 1991 and 1994. She worked for Korea Telecom as a research staff from 1994 to 2014, when she designed the network architecture, the DNS service, and the network management system of KORNET(Korea telecom internet), and was in charge of technical support for network security. She is now a researcher of software research center in Chungnam National University, Korea, and participating in a project of analyzing malwares for the cyber blackbox.
Hyong-Shik Kim received the B.S.E. in computer engineering, the M.S.E in computer
engineering, and the Ph.D from Seoul National University, Korea in 1988, 1990 and 1997. He joined Chungnam National University, Korea as a faculty member in 1999, and is currently in the department of computer science and engineering. He worked as a faculty research associate for the University of Alabama in Huntsville, USA before then. His research interests lie on the borderlands between computer system architecture and security. Currently, he is chiefly interested in analyzing malwares in various ways, including traditional static and dynamic methods. He is a member of Korean Institute of Information Scientists and Engineers(KIISE), and Korea Institute of Information Security & Cryptology(KIISC).