Research article Available online www.ijsrr.org ISSN: 2279–0543
International Journal of Scientific Research and Reviews
System and Method of Population Census Based on Vision and Remote
Sensing
Singh Shashi Kr.
1*and Sisodia Vibhash Singh
21
ECE Department, SBNITM, Jaipur, (Raj.) India. Email- [email protected]
2
CSE Department, SBNITM, Jaipur, (Raj.) India. Email- [email protected]
http://doi.org/10.37794/IJSRR.2019.8418
ABSTRACT
The research gives solution for online population census based on vision and remote sensing. The paper further relates to capturing, enhancing and monitoring data related to human population and its social, economic, environmental and ecological impact on mankind. Population estimation with questionnaires and demographic models is time consuming and usually accompanied by high costs. Real time image based approaches and operations constitute key tools towards the solution of this problem,
The developed method is based on hue threshold and Wavelet transform based imaging system. It is capable of giving the information for global city, district, zone and state .The multi resolution property gives on line , population estimation (density) and settlement, employment estimation, and other associated socioeconomic characteristic.
KEYWORDS: Population, Urbanization, Fertility, Socioeconomic, Symlet Wavelet
_________________________________________________________________________________
*Corresponding Author:
Shashi Kr. Singh
ECE Department, SBNITM, Jaipur, (Raj.) India.
INTRODUCTION
A census is the procedure of systematically acquiring and recording information about the members of a given population. The census is a single source of a variety of statistical information on different characteristics of the population of an area. Governments of many countries take continuous steps for developing systematic collection of statistics on the size of population, its growth, etc., and have special organizations for collecting census data. These organizations are responsible for generating data on population statistics including vital statistics and census. Census provides valuable information for planning and formulation of polices for Central & State Governments and is widely used by National & International agencies, scholars, business people, industrialists, and many more.
The Indian Census is the most credible source of information on Demography (Population characteristics), Economic Activity, Literacy & Education, Housing & Household Amenities, Urbanization, Fertility and Mortality, Scheduled Castes and Scheduled Tribes, Language, Religion, Migration, Disability and many other socio-cultural and demographic data.
There are existing techniques in prior art for census estimation based on the intended goal and the information that is required. These techniques can be grouped into two categories: areal interpolation and statistical modelling. Areal interpolation methods are primarily designed for the zone transformation problem that involves transforming data from one set of spatial units to another. This approach uses census population data as the input and applies interpolation or disaggregation techniques to obtain a refined population surface.
The statistical modelling approach is more focused in inferring the relationship between population and other variables for the purpose of estimating the total population for an area.The statistical modelling approach does not directly use census data as the input. Rather, it makes use of socioeconomic variables and applies theories in urban geography for population estimation; census population data only participate in the model training process. The existing techniques like areal interpolation and statistical modelling are sample based and manual approaches. These techniques are not suited for online and global census measurement. For the modern scenario the need is faster methods which can be collect and process the data in short period of time so that periodic population increased can be measured and also the effects of population can be analysed.
provide evidence that attempt to estimate and extract socioeconomic attributes directly from remote sensed data or indirectly by means of offline information derived from imagery. Iisaka and Hegedus proposed and apply mathematical model based on Landsat MSS data to estimate the population distribution in Tokyo, Japan. Understanding quality of life, for example, has been successfully analyzed by using data generated by remote sensing imagery and socio economic variables. Sutton9 model population density using night time imagery in USA. Lo6 estimated economic indicators in China using allometric growth model. Weber and Puissant analysed urbanization process and identify urban changes in Tunis, capital of Tunisia. Chen10 proposed an approach with different level to link remotely sensed data and areal census data in Sydney, Australia. Lo7 tested urban theories on spatial urban structure using remote sensing in Atlanta, USA. Daniele Marinelli12 presented Light Detection and Ranging (LiDAR) to characterize the 3-D structure of the forest. Bin Zou et al11 presented Satellite Based Mapping of Ground PM2.5 Concentration. Yang Long et al13 introduced Object Localization in Remote Sensing Images, Emmanuel Maggiori etal14 proposed an end-to-end framework for the dense, pixelwise classification of satellite imagery with convolution neural networks (CNNs). Fabio Pacifici et al15 presented multi angular acquisition for unique scene,
METHODOLOGY
The system consists of four phases: data capture, data aggregation, filtering and data storage/ data analysis.
The major com components of the developed system is Image acquisition Ip Camera, image processing software for wavelet based algorithm development, (Matlab, and Labview). The developed method and algorithm is capable satellite imaging.
The system consists of four phases: Image capture, face recognition, filtering and data storage/ data analysis.
The face recognition process based on hue threshold approach is applied. Hue threshold approach is based on intensity isolation Scattered light from the cotton tuft is collected by CCD camera lens and converted image in two-dimensional arrays. The acquired image is send to Hue saturation plane where it is displayed in Red (R), Green (G) and Blue (B) colors. The RGB plane is 1200 each with respect to white light. Three hues are made as a result of RG, GB, and BR planes. For Hue saturation value we have numbers (0-255) from which we can adjust the plane value to separate the hue plane for contaminants in the pure cotton. We have sum and division function before hue plane display. The sum function adds the intensities, which come from different surfaces of the region. The resultant component is differentiated from the intensity level of image. The hue mask is set in –1800 to +1800 whose domain and range is covering the total lux reflected from different surface of the area. This is useful for setting surface gradient between the light scattered from the person and other object. This is made to work in real time at the calculation time of approximately 10-4s.
The developed method and algorithm is capable for Unmanned aerial Vehicle (Ground/ and Satellite imaging. It consists of Camera, Digital I/Om Auto pilot , Processing Stations, Recording stations, Population Density display as shown in figure3.
Steps of Algorithm development-
Wavelet based approach
This system involves the development of tools for environment image enhancement and analysis. The development of device by using wavelet analysis and 3D image processing will be done in Matlab and Labview. The technique can reduce noise contents in signals and images enhancing the gradient at most edges. The noise filtration technique by Symlet Wavelet will be quite robust. There will be many possible extensions of the technique. Its applications in spatially dependent noise filtration, edge detection and enhancement, image restoration, and motion noise removal.
This system involves the development of tools for environment image enhancement and analysis. The development of device by using wavelet analysis and 3D image processing will be done in Matlab and Labview. The technique can reduce noise contents in signals and images enhancing the gradient at most edges. The noise filtration technique by Symlet Wavelet will be quite robust. There will be many possible extensions of the technique. Its applications in spatially dependent noise filtration, edge detection and enhancement, image restoration, and motion noise removal.The main aim is to implement de-noising algorithms based upon the discrete wavelet transform (DWT) that can be applied successfully to enhance noisy multidimensional data sets in the imaging technology. The work will present both image decomposition, thresholding and reconstruction and the 3-D de-noising of image volumes using the DWT as a new approach which can be used in the processing of images.
Daubechies proposes modifications of her wavelet such that their symmetry can be increased while retaining simplicity. The idea consists of reusing the function m0 introduced in the dbN
considering the m0()2 as function of i
e
z . Then we can factor in several different ways
in the form of )
z 1 U( U(z) ) z (
. The roots of with modulus not equal to 1 go in pairs. If one is,
1 1 z 1 ,
z is also a root. By selecting U such that the modulus of all its root is strictly less than 1, we
Daubechies introduced scaling function (x) 2 h (2x n) n n
for wavelet dbN (hn are the
coefficients associated to a ‘standard’ multiresolution analysis and the corresponding orthonormal basis). However, more symmetric wavelet filters make easier to deal with the boundaries of the image Symmetric filters are linear phase filters. More precisely, a filter with filter coefficients a is n called linear phase if the phase of the function
n ξ -in n e a ) (
a is a linear function of , i.e., if for
some l Z, a()= eil a(). This means that a are symmetric around n l, an a2l-n .
The phase introduced by I. Daubechies for Symlet wavelet is given below
... ) 16 / ( 0 m /8) ( 0 m ) 4 / ( 0 m /2) ( 0 m ) (
1
= ], ) 2 ( m ) 2 ( [m
-2j-1 0 2j 2
1 j
0
where
n
in -n
0 h e
2 1 ) (
m . The phase
1
of the Symlet wavelet is closer to linear phase than
that of dbN, 1 j j
-0(2 )
m )
(
.
Detailed description
For the purpose of promoting an understanding of the principles of the invention, reference will now be made to the embodiment illustrated in the figures and specific language will be used to describe them. It will nevertheless be understood that no limitation of the scope of the invention is thereby intended. Such alterations and further modifications in the illustrated system, and such further applications of the principles of the invention as would normally occur to those skilled in the art are to be construed as being within the scope of the present invention.
Flow chart of Algorithm
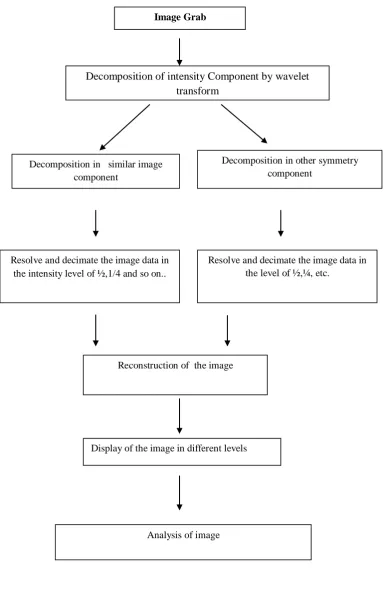
Figure 3- Flow diagram of the analysis by Symlet Wavelet
Decomposition of intensity Component by wavelet transform
Decomposition in similar image component
Decomposition in other symmetry component
Resolve and decimate the image data in the intensity level of ½,1/4 and so on..
Resolve and decimate the image data in the level of ½,¼, etc.
Reconstruction of the image
Display of the image in different levels Image Grab
Steps of Hue threshold Algorithm development-
The Image Processing steps-
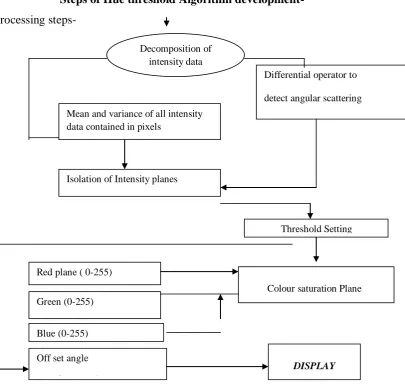
Figure 4- Flow diagram for abnormalities detection in image using Hue Separation
The terms "comprises", "comprising", or any other variations thereof, are intended to cover a non-exclusive inclusion, such that a process or method that comprises a list of steps does not include only those steps but may include other steps not expressly listed or inherent to such a process or method. Similarly, one or more sub-systems or elements or structures or components preceded by "comprises... a" does not, without more constraints, preclude the existence of other, sub-systems, elements, structures, components, additional sub-systems, additional elements, additional structures or additional components. Appearances of the phrase "in an embodiment", "in another embodiment" and similar language throughout this specification may, but not necessarily do, all refer to the same embodiment.
Unless otherwise defined, all technical and scientific terms used herein have the same meaning as commonly understood by those skilled in the art to which this invention belongs. The
Decomposition of intensity data
Colour saturation Plane Red plane ( 0-255)
Green (0-255)
Blue (0-255)
Off set angle
(-1800 to +1800)
DISPLAY Mean and variance of all intensity
data contained in pixels
Differential operator to
detect angular scattering
from i.e. from different portion
Isolation of Intensity planes
system, methods, and examples provided herein are only illustrative and not intended to be limiting Embodiments of the present invention will be described below in detail with reference to the accompanying figures.
FIG. 1 discloses a system for population census based on vision and remote sensing. The system includes an input for receiving images of the population. The system further includes a memory for storing data. The system also includes a processor adapted to process the received information for face recognition and filtering of the noise to generate census data. The processor is further adapted to analyze the census data to generate census related information. The system also includes a display 108 to present census related information to a user.
FIG. 2 discloses a method for population census based on vision and remote sensing. It shows image recording system for population census based on vision and remote sensing. The system includes image sensor for capturing images or video. The system further includes unmanned aerial vehicle having capability of imaging sensors etc. The system also includes autopilot. The system also includes input output means for providing and input. The input can be provided by means of keyboard, mouse, light pens etc. The input can also be directly provided by external sources. The system further includes processing stations for processing the captured images. The system also includes recording station for recoding population samples or population density.
The method includes step of receiving images of the population. The method further includes step of processing the received images for face recognition and step filtering of the noise to generate census data. The method also include step of analyzing the census data to generate census related information.
sum function adds the intensities, which come from different surfaces of the region. The resultant component is differentiated from the intensity level of image. The hue mask is set in –1800 to +1800 whose domain and range is covering the total lux reflected from different surface of the area. This is useful for setting surface gradient between the light scattered from the person and other object. This is made to work in real time at the calculation time of approximately 10-4s. The received images are also enhanced to reduce noise content and enhancing the gradient at most edges in signals by using wavelet analysis and 3 dimensional images processing in MATLAB and LABVIEW. The noise filtration technique by Symlet Wavelet will be quite robust. There will be many possible extensions of the Symlet and Hue saturation techniques.
The main aim is to implement de-noising algorithms based upon the discrete wavelet transform (DWT) that can be applied successfully to enhance noisy multidimensional data sets in the imaging technology. The present invention provides image decomposition, thresholding and reconstruction and the 3-D de-noising of image volumes using the DWT as a new approach which can be used in the processing of images.
FIG. 3 and 4 show a flow diagram for abnormalities detection in image using Hue Separation in system and method of population census based on vision and remote sensing method. In one embodiment, the captured image is decomposed into intensity data. The angular setting is detected based on differential operator. The mean and variance of all intensity data is contained in the pixels. The isolation of intensity planes is compared to the threshold setting. The colour saturation plane is identified according to the red, blue and green planes and offset angle.
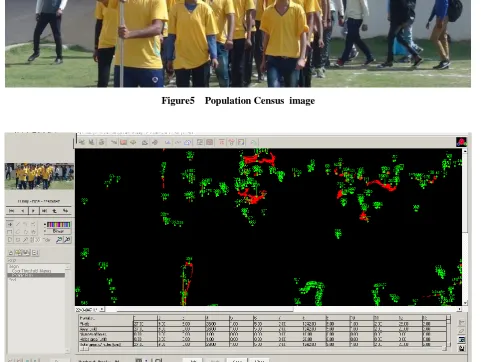
FIG. 5 shows an original image for population demography based on vision and remote sensing method. The image is analyzed for population demography.
RESULT
Figure5 Population Census image
Figure7. The recorded and analyzed image
CONCLUSION
The system developed gives on line public distribution of specific local areas. It stores the records of population area wise in a city and state. Anyone can retrieve the visual data of the existence of people in specific areas or village or city.
REFERENCES
1. Lo, C. P.. Automated population and dwelling unit estimation from high-resolution satellite images. a GIS approach. International Journal of Remote Sensing(1995; 16(1): 17 - 34.
2. Lu, D. S., Q. H. Weng and G. Y. Li. Residential population estimation using a remote sensing derived impervious surface approach. International Journal of Remote Sensing. 2006;27(16): 35533570
3. Mesev, V. Integration of GIS and remote sensing. Chichester. 2007;Wiley & Sons.
4. Lo, C. P.Testing urban theories using remote sensing. GIScience and Remote Sens.2004; 41: 95115.
5. Lo, C. P. Application of Landsat TM Data for Quality of Life Assesment in an Urban Environment .Computers, Environment and Urban Systems. 1997; 21(3/4): 259-276.
6. Lo, C. P. Urban Indicators of China from Radiance-Calibrated Digital DMSP-OLS Nighttime Images. Annals of the Association of American Geographers. 2002; 200292(2): 225 - 240. 7. Lo, C. P. Testing urban theories using remote sensing. GIScience and Remote Sensing 2004;41:
95115.
8. Lo, C. P. and R. Welch. Chinese Urban Popuilation Estimates. Annals of the Association of American Geographers.1977 67,(2): 2;46-253.
9. Sutton, P. Modeling population density with night-time satellite imagery and GIS. Computers, Environment and Urban Systems. 1998;21(3-4): 227-244.
10.Chen.K. An approach to linking remotely sensed data and areal census data." International Journal of Remote Sensing. 2002; 23(1): 37 – 48.
11.Bin Zou, Jingwen Chen, Liang Zhai, Xin Fang and Zhong Zheng. Satellite Based Mapping of Ground PM2.5 Concentration Using Generalized Additive Modeling” Remote Sens. 2017; 9(1): 1
12.Daniele Marinelli, Claudia Paris, Lorenzo Bruzzonei .A Novel Approach to 3-D Change Detection in Multitemporal LiDAR Data Acquired in Forest Areas, IEEE Transactions on Geoscience and Remote Sensing2018; Volume: 56, Issue: 6
13.Yang Long, Yiping Gong, Zhifeng Xiao, Qing Liu. Accurate Object Localization in Remote Sensing Images Based on Convolutional Neural Networks. IEEE Transactions on Geoscience and Remote Sensing,2017; Volume: 55, Issue: 5Page(s): 2486 - 2498 .
15.Fabio Pacifici. The Importance of Physical Quantiities for the Analysis of Multitemporal and Multiangular Optical Very High Spatial Resolution Images. IEEE Transactions on Geoscience and Remote Sensing. 2014.;olume: 52, Issue: 10, Page(s): 6241 – 6256.