Design and Structural Dynamic Analysis of
Overhead Elliptical Conveyor
Hanumanthlal. S Pranesh. K. G
Assistant Professor PG Student
Department of Mechanical Engineering Department of Mechanical Engineering
Vijaya Vittala Institute of Technology, Bangalore, Karnataka, India
Vijaya Vittala Institute of Technology, Bangalore, Karnataka, India
Abstract
Over Head Conveyors are used to transport material or components from one place to another place either for assembly or for transportation purpose. In the present work, overhead conveyor designs need to be done to for transporting the components for sand blasting applications. These members should be loaded and unloaded with an elliptical orbit. So the structure designed should take all types of loads resulting from the dynamic effects of the moving load. So channels sections which will reduce the weight to be selected and proper weld sizes need to be specified for structural safety to a take a maximum component load of 500Kg. Also the design should consider loading and unloading effects on the structure at overlap time. Due to the vibration with the hoist, the load effect on the structure should be analyzed properly and structural safety should be maintained under buckling and structural loads. Every section of the member should be checked for dynamic moving load.
Keywords: overhead conveyor, channel section, structural load, dynamic moving load
_______________________________________________________________________________________________________
I. INTRODUCTION
A conveyor system is a common piece of mechanical handling equipment that moves materials from one location to another. Conveyors are especially useful in applications involving the transportation of heavy or bulky materials. Conveyor systems allow quick and efficient transportation for a wide variety of materials, which make them very popular in the material handling and packaging industries [1].
Overhead conveyor is an elevated system similar to floor level conveyor that is used to transport the materials throughout a facility. They are known as overhead conveyor because load is carried on the moving carriages which move on overhead track.
Overhead conveyor find many applications in transporting casting, forging and assembly units in shops and between transporting machine, parts between machine tools, transporting subassemblies between the stations and transporting the parts for sandblasting.
The main parts of the overhead conveyor are Rail, Carrier, Drive, Suspension attachments, Speed controller, Overhead tracks and structure [20].
In the present work overhead conveyor structure including track has to be designed for sandblasting application to carry a load of 500kg. For design and analysis CAD/CAE softwares are used. For modeling CATIA and analysis ANSYS softwares are used.
II. PROBLEM DEFINITION
Conveyor design and design optimisaiton is the main definition of the problem. The main objectives include 1) Section calculations using theoretical approach.
2) Modeling through modeling software CATIA
3) Structural analysis through finite element software Ansys.
4) Modal and Harmonic Analysis for dynamic and cyclic loading due to movement of the hoist through finite element software Ansys.
III. DESIGN SPECIFICATION FOR OVERHEAD CONVEYOR
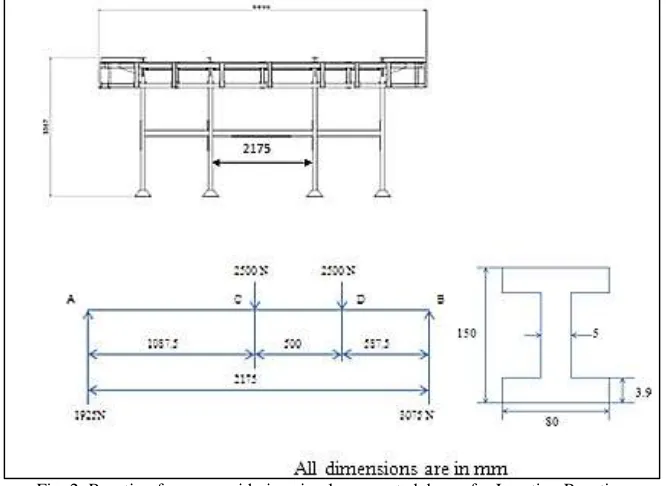
1) Length x width x height : 6805x3057x3387 mm 2) Desired capacity : 500 kg.
3) Material : Steel 42 Material
3) Poisson’s Ratio : 0.3 4) Ultimate Tensile Stress : 420 Mpa
IV. OVERALL DIMENSION
V.
Fig. 1: All dimensions are in mm Overall dimensions of overhead conveyor
VI. THEORETICAL CALCULATIONS
Max Bending Moment: Maximum bending moment can be calculated by considering simply supported beam for I-section.
Bending Moment calculation
RA+RB = 5000 ΣMA = 0
= (RBx2175) - (2500x1587.5) - (2500x1087.5) = 0 RB = 3075 N
RA = 1925N
Bending Moment at D = (3075x587.5) = 1.81x10⁶ N-mm
Bending Moment at C = (3075x1087.5)-(2500x500) = 2.09x10⁶ N-mm
Max Bending Moment at C = 2.09x10⁶ N-mm
Moment of inertia for beam
Yield stress = 420 Mpa Factor of Safety = 3
Design Stress = Yield Stress / Factor of Safety = 420/3
= 140 Mpa Design Stress = (Moment x Y) / I
(Equation1.16 Design Data Hand Book-K.Mahadevan and K.Blaveera Reddy) Y= Distance from neutral axis to extreme fiber = 150 / 2 =75 mm
I= Moment of Inertia
I= (Moment x Y) / Design stress I = (2.09x106x75) / 140
I = 1.12x106 mm4
Moment of inertia for I-section
I = (BH3-bh3) / 12
(Table 1.3 Design Data Hand Book-K.Mahadevan and K.Blaveera Reddy) B=80 mm
H=150 mm
b= B-t = 80-5.2 = 74.8 mm h= 142.2 mm
I= ((80x1503) - (74.8x142.23) / 12 I=4.5x106 mm4
The moment of inertia of I-section is larger than the moment of inertia of beam, so the dimensions of the I-section are acceptable.
Design stress
Design Stress= (M x Y) / I
(Equation1.16 Design Data Hand Book-K.Mahadevan and K.Blaveera Reddy) Design Stress = (2.09x106 x75) / (4.5x10⁶)
= 34.22Mpa
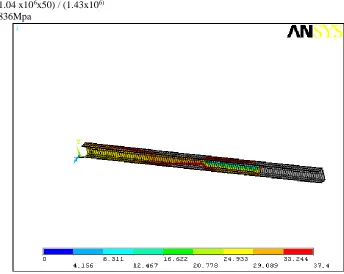
Fig. 3: Finite element Validation Vonmises Stress in I Section
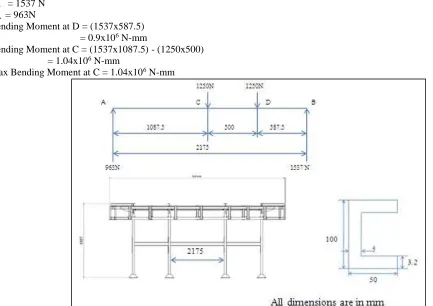
Maximum Bending Moment Calculation C- Section
Bending Moment Calculations RA+RB = 2500
ΣMA = 0
= (RBx2175) - (1250x1587.5) - (1250x1087.5) = 0 RB = 1537 N
RA = 963N
Bending Moment at D = (1537x587.5) = 0.9x10⁶ N-mm
Bending Moment at C = (1537x1087.5) - (1250x500) = 1.04x10⁶ N-mm
Max Bending Moment at C = 1.04x10⁶ N-mm
Fig. 4: Reaction forces considering simply supported beam for C-section Reaction
Moment of inertia for beam
Design Stress = Yield Stress / Factor of Safety = 420/3
= 140 Mpa Design Stress = (Moment x Y) / I
(Equation1.16 Design Data Hand Book-K.Mahadevan and K.Balaveera Reddy) Y= Distance from neutral axis to extreme fiber = 100 / 2 =50 mm
I= Moment of Inertia
I= (Moment x Y) / Design stress
I = (1.04 x106 x 50) / 140 = 0.37x106 mm4
Moment of inertia for C-section
I = (BH3-bh3) / 12
(Table 1.3 Design Data Hand Book-K.Mahadevan and K.Balaveera Reddy) B=50 mm
H=100 mm
b= B-t = 50-5 = 45 mm h= 100 - (2x5) = 90mm I= ((50 x1003) - (45x903)) / 12 I=1.43x106 mm4
The moment of inertia of C-section is larger than the moment of inertia of beam, so the dimensions of the C-section are acceptable.
Design stress
Design Stress= (M x Y) / I
(Equation1.16 Design Data Hand Book-K.Mahadevan and K.Blaveera Reddy) Design Stress = (1.04 x106x50) / (1.43x10⁶)
= 36.836Mpa
Deflection:
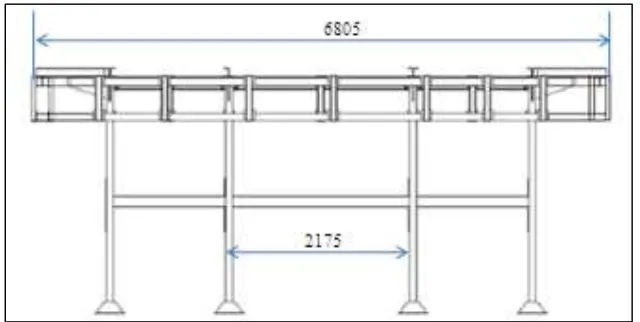
Fig. 6: All dimensions are in mm Overhead conveyor structure
Allowable deflection = Length / 750 = 2175/750 = 2.9 mm Deflection = Pl3/48EI
(Table1.4, Design Data hand Book- K.Mahadevan and K.Balaveera Reddy) I= Pl3 / (Deflection x48 x E)
= (5000 x21753) / (2.9 x 48 x 2 x 105) = 1.847x106 mm4
Total Deflection = Total Length/750 = 6805/750 = 9.07 mm
Buckling:
Fig. 7: All dimensions are in mm buckling
Critical Load P = π2EI / 4l2
(Equation.1.29, Design Data hand Book- K.Mahadevan and K.Balaveera Reddy) P=(π2 x 2 x 105 x 4.5 x 106) / (4 x 32522) = 209982 N
Geometrical Model:
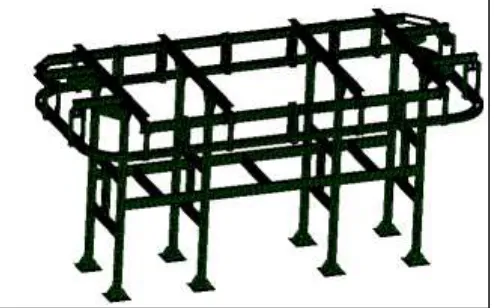
Fig. 8: Geometrical model of overhead conveyor
Fig. 9: Geometrical model of overhead conveyor showing track
Fig. 10: Complete mesh of overhead conveyor
The figure 10 shows meshed view of the problem. Total of 82945 elements with 90242 nodes are used. SHELL63 has been used. It both bending and membrane capabilities. Both in-plane and normal loads are permitted. The element has six degrees of freedom at each node: translations in the nodal x, y, and z directions and rotations about the nodal x, y, and z-axes. Stress stiffening and large deflection capabilities are included. After meshing in hypermesh, the meshed geometry is exported to ansys in ‘cdb’ file format. Elements are grouped to different collectors to assign thickness properties and materials. Number of triangular elements is minimized. The load collectors and displacement collectors are provided to apply the boundary conditions.
Boundary Conditions:
VII.RESULTS & DISCUSSION
Frame Analysis
Analysis is carried out by varying load positions maintaining 500mm between the wheels. The load is applied as point or concentrated load. The analysis is carried out with two dimensional shell elements. All the bottom geometry is constrained in all degree of freedom.
Fig. 11: Deflection due to Self weight
The figure 11 shows deflection in the problem equal to 0.001968 m or 1.968mm due to self-weight. The maximum deflection is observed at the right overhung. This can be attributed to more length compared to the frontal sections from the supporting pillars.
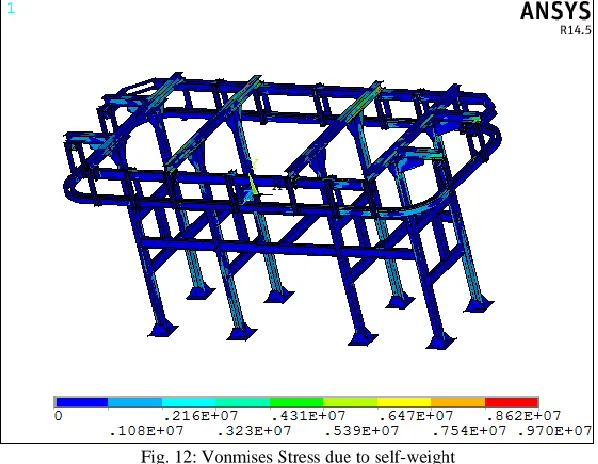
Fig. 12: Vonmises Stress due to self-weight
The figure 12 shows vonmises stress distribution in the conveyor frame. Maximum stress is around 9.7Mpa which is localized at the connections. Generally vonmises stress is considered for the ductile materials, as it is most favored theory to predict failure of the ductile materials. Even shear stress theory also can be applied, but as per the literature 90% ductile failures match by vonmises criteria.
Initial analysis results
Fig. 13: Deflection due to loading
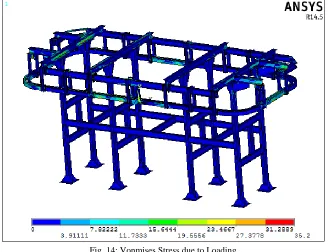
The figure 13 shows deflection due to self-weight along with external loading 5000N. Maximum deflection of 2.27151mm can be observed in the problem as shown in the status bar. The deflection developed is less than the allowable deflection of 2.9mm. Structure is safe for the given loading conditions. The location of maximum deflection is shown by red colour. Also the variation of displacement is represented on the status bar.
Fig. 14: Vonmises Stress due to Loading
Design Optimization Parameters:
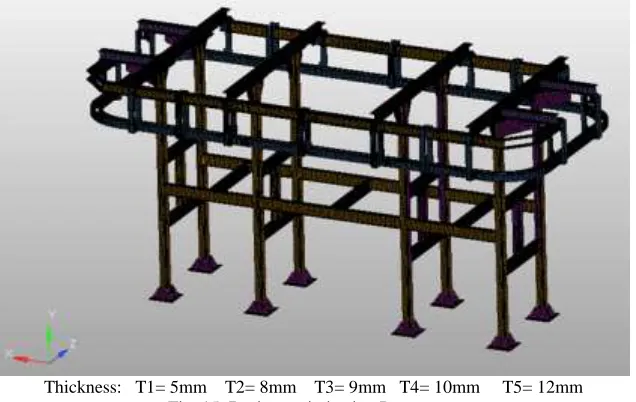
Thickness: T1= 5mm T2= 8mm T3= 9mm T4= 10mm T5= 12mm Fig. 15: Design optimization Parameters
The figure 15 shows design parameters used for the problem. Totally 5 design parameters are used for design optimization. Design optimization module in Ansys requires design variables and state variables. Design variables are geometric parameters and state variables are nothing but deflection and stress conditions. The component represents the thickness used for the problem also as initial values. CP collector is used for connecting the shell geometries. The design optimization also requires objective function which is nothing but weight of the structure. Sub problem approximation is used for obtaining the design sets.
Table - 1(a) Design optimization
Parameters Variables Set 1 (Feasible) Set 2 (Feasible) Set 3 (Feasible) Set 4 (Feasible) MAXD
in mm SV 2.2715 2.7385 3.9719 2.8230
T1
in mm DV 5.0000 4.6943 4.2358 4.5855
T2
in mm DV 8.0000 5.2859 7.2392 5.9106
T3
in mm DV 9.0000 5.3280 3.0200 7.1709
T4
in mm DV 10.000 7.8466 6.2837 3.4900
T5
in mm DV 12.000 7.8380 5.8826 6.1255
WT
in Kg OBJ 2039.2 1606.3 1354.4 1616.6
Table - 1(b) Design optimization
Parameters Variables Set 6 (Feasible) Set 11 (Feasible) Set 12 (Feasible) Set 13 (Feasible) MAXD
in mm SV 2.8517 4.0010 4.0308 4.0266
T1
in mm DV 4.5441 4.2119 4.1976 4.2061
T2
in mm DV 5.7731 7.2384 7.2360 7.2349
T3
in mm DV 5.8654 3.0186 3.0137 3.0137
T4
in mm DV 8.6297 6.2832 6.2815 6.2815
T5
in mm DV 10.528 5.0940 3.5374 3.1471
WT
in Kg OBJ 1657.9 1343.8 1329.1 1327.9
Totally 13 sets are obtained with design optimization. The initial weight of 2039kgs is reduced to 1327.9kg after 13 iterations. The results show 13th set gives the best weight satisfying the functional requirements. The final results are as follows.
Fig. 16: Deformation after optimization
The figure 16 shows deformation in the problem after design optimization. Maximum deformation is around 4.0266mm as shown in the figure. Maximum deformations are observed at the right and left overhung regions due to higher unsupported length. Also more deformations can be observed at the loading regions. The deformation should be within the limits as higher deformations create problems. Higher deformations also create buckling of the structures. The blue region shows minimum deformation in the problem as compared to the other regions.
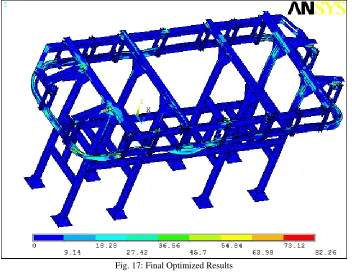
Fig. 17: Final Optimized Results
Table – 2 Results comparison
Sl No Strain and Stress Theoretical Self-weight Initial Analysis (before optimization) Final Analysis (after optimization)
1 Deflection in mm 9.07 1.968 2.271 4.0266
2 Vonmises Stress in Mpa 140 9.7 35.2 82.26
Table 2 shows the results comparisons of theoretical calculation, self-weight, initial analysis and final analysis after optimization. The analysis result shows that the deflection and vonmises stresses are within the allowable limits and hence the frame is safe.
Fig. 18: Iterations to Displacement
The figure 18 shows displacement variation with reference to iterations. As iterations increased, the deflection is reaching to the limiting deflection. From the 10 th set, almost the deflection is closing to the limiting deflection line indicating the convergence of geometrical parameters satisfying the state functions.
Fig. 19: Iterations to Weight
Fig. 20: Weight to Parameters
The figure 20 shows influence of design parameters on weight optimization. The parameter T4 and T5 has more influence on the weight as shown in figure. So design optimizer tool helps in estimating the influence of different parameters on objective function. This objective function may be weight, natural frequencies or harmonic response.
Weight reduction due to optimization
Table – 3
Weight reduction comparison Before optimization 2039.2 Kg
After optimization 1327.79 Kg
Modal Analysis:
It is used to calculate the natural frequencies and mode shapes of a structure or structure.The modal analysis deals with the dynamics behavior of mechanical structures under the dynamics excitation. The modal analysis helps to reduce the noise emitted from the system to the environment. It helps to point out the reasons of vibrations that cause damage of the integrity of system components. Using it, we can improve the overall performance of the system in certain operating conditions.
Stiffness of simply supported beam K=48EI / l3 [16]
= (48 x 2 x 1011 x 4.5 x 106 x 10-12) / (6805 x 10-3)3 = 137087.974 N/m
Wn = Square root of (K/m)
Mode shapes
Figure 21: Modeshape1
Fig. 23: Modeshape3
Fig. 25: Modeshape5
Table – 4 Modal frequencies
Mode Shapes Frequency in rad/ sec Mode Shape 1 5.2766 Mode Shape 2 17.7644 Mode Shape 3 21.5452 Mode Shape 4 22.2492 Mode Shape 5 29.6615
Harmonic Analysis:
Since the conveyor is subjected to movement of the loading platforms, it is subjected to cyclic loads at the support locations. So a response analysis is carried out to find possible resonance frequencies under loading.
The figure 26 shows displacement due to harmonic loading. The response is taken from the highest response condition. Maximum deformation is observed at the loading regions.
Fig. 27: Vonmsies Stress
The figure 27 shows vonmises stress due to harmonic loading. Maximum stresses are limited to the loading regions. The maximum stress development of 62.8Mpa is less than the allowable stress of the problem. So the design of conveyor is safe.
Fig. 28: Harmonic Response
Table – 5
Result comparison of structural and Harmonic analysis
Sl No Strain and Stress Theoretical Structural Analysis Harmonic Analysis
1 Deflection in mm 9.07 4.026 4.66
2 Vonmises Stress in Mpa 140 82.76 62
The vonmises stress in harmonic analysis is less than the structural analysis this indicates that the structure is safe [18].
VIII. CONCLUSIONS
The analysis for overhead conveyor is carried out based on basic mechanics of materials equations and finite element software ansys and the results are summarized as follows.
1) Initial secional dimmehnsions are calcualted based on simple bending moment equaiton and axial loadinng conditios. 2) The frame is constructed for the required dimensions and analysis is carried out by changing the load location after
identifying the critical locations. Shell element is used fo represeting the problmem. The mid surface is extracted and meshed with 4 noded quad elemets and later shell properties are attached for analysis.
3) The results for stress and deformation of selfw weight are recorded alog with stress, lesser deformation then the allowable deformation of 5mm. Ansys plot controls style option helps in three dimensional visulization of the problem. The analysis results indicate design optimization is required due to over factor of safety in the problem.
4) A quad mesh with appropriate qulaity critier is applied for the better results satisfying the aspect ratio, warpage, skew angle and jacobian. The loads are applied at the edge location as analysis is carreied out only for critical locations. Point loads are applied simulating the 4 wheel positions. Both deformation and stress pictures are captured. Since the material is ductile, vonmises stress is captured. The analysis results shows sucesses for stress conditions for the given loading conditions.
5) The conveyor is optimised by varying the thickness of members until the structural safety is obtained and all the design sets are represented. .Further analysis is carried out to find spectru aalysis.
IX. FURTHER SCOPE
1) The structure canbe analysed possible thermal load effects 2) Fatigue analysis canbe carried out
3) Spectrum analysis can be carried out. 4) Composite usage can be checked.
5) Sections can be varied to check further improvement in the problem
REFERENCES
[1] Suhas M. Shinde* and R.B. Patil* Design and Analysis of a Roller conveyor System for Weight Optimization and Material Saving International Journal of Emerging Technologies 3(1): 168-173(2012)
[2] Bernard, A., Frey, F, Janss, J., Massonnet, Ch.,. “Research on the behaviour of aluminium columns against buckling”. University of Liège, Laboratories for testing materials and stability of constructions, Liège, Belgium. 1971
[3] Valtinat, G., Müller, R., “Ultimate load of beam columns in aluminium alloys with longitudinal and transversal welds”. Second Int. Coll. Stability, Prelim. Rep., Liège, pp. 393-402.1977
[4] Kitipornchai, S., Wang, C. M., “Lateral buckling of tee beams under moment gradient”. Computers & Structures, Vol. 23, No. 1, pp. 69-76.1986. [5] Benson, P., “Local and Flexural Buckling of Eccentrically Loaded Square, Thin-Walled Aluminium Alloy Columns”. Royal Institute of Technology,
Department of Structural Engineering, Stockholm, Sweden. 1990
[6] Höglund, T., “Flexural and lateral-torsional buckling of aluminium and steel beam-columns”. International Conference on Steel and Aluminium Structures, ICSAS, Singapore1991.
[7] Corona, E., Ellison, M. S., “Plastic Buckling of T-Beams under Pure Bending”, Journal of Engineering Mechanics, Vol. 123, No. 5, pp. 466-474. 1997 [8] Bradford, M. A., “Elastic distortional buckling of tee-section cantilevers”. Thin-Walled Structures, Vol. 33, No. 1, pp. 3-17.1999
[9] Jaehong Lee, Seung-Eockkim ‘Lateral buckling analysis of thin walled laminated channel section beam’, composite structure56920020, 391-399. [10] M.S.Ellison and E.Corona ‘An experimental investigation of T-beam stability under bending’ 42, Nol38 No1 March1998.
[11] J.Farkas, ‘Optimum design of circular tubes loaded in compression in pre and post buckling ranges’. Spring-verlag1992, structural optimization 5,123-127 [12] Berkeley, composite beam design AISC ETABS Dec2001.
[13] Batin, ‘Simulation model of an ultra-light overhead conveyor system’, IJM, ISE vol7 Nov2013
[14] Pavol Lengvarský*, Jozef Bocko, Martin Hagara, Modal Analysis of I-section using Ansys AJME 2013 Vol1 No7 271-275 [15] Design Data Hand Book –K.Mahadevan and K.Balaveera Reddy, Third edition, CBS Publishers & Distributors Pvt.Ltd. [16] Machine Dynamics and Vibration Lab-NIT Surathkal
[17] Engineering Hand Book –G.L.Huyett
[18] Khawaja ‘Modal and harmonic analysis of L.P.Turbine of a small turbofan engine using FEM’ UET Taxlia Mechanical Engineering dept 2007
[19] Seema S. Vanamane, Pravin A. Mane / International Journal of Engineering Research and Applications (IJERA) ISSN: 2248-9622 www.ijera.com Vol. 2, Issue 3, May-Jun 2012, pp.2162-2167
[20] ‘Material Handlin – Keshva Chanda Arora, Vikas.V.Shinde. [21] www.google.com