1 |
P a g e
ARTERY AND VEIN CLASSIFICATION IN RETINAL IMAGES USING
GRAPH BASED APPROACH
Mr.Prashant L.Kolase [email protected]
Student of Tatyasaheb Kore Institute Of Engineering and Technology, Warananagar, Kolhapur.
Prof.Subhash S.Patil [email protected]
Professor in electronics department, Tatyasaheb Kore Institute Of Engineering and Technology,Warananagar, Kolhapur.
ABSTRACT:
Digital image analysis of eye fundus images has several benefits than current observer based techniques. The characteristic symptoms of different systemic diseases like hypertension, glaucoma, diabetes and cardiovascular disorder etc. affects retinal vessels. Diseases like diabetes show abnormalities and diameter changes in retinal blood vessels. In hypertension retinal blood vessels show
dilatation and elongation of main arteries and veins. Arteriolar to venular diameter ratio (AVR) express
high blood pressure levels, diabetic retinopathy and retinopathy of prematurity. Among other image processing operations the estimation of AVR requires
vessel segmentation, accurate vessel width
measurement and artery or vein classification [1]. Hence the identification of arteries is essential to detect eye diseases. The work has been done on automated classification of retinal vessels and hence it is a challenging task.
INTRODUCTION:
Nowadays for image analysis graph based methods have been used which are useful for retinal vessel segmentation, retinal image registration and retinal vessel classification[2]. The segmented vessels are analyzed using type of intersection and then assigned artery or vein labels to each vessel segment. So the combination of labels and intensity features decides final artery or vein class.
Most of the methods uses intensity features to differentiate between arteries and veins. Due to the acquisition process, very often the retinal images are non-uniformly illuminated and exhibit local luminosity and contrast variability, which can affect the performance of
intensity-based A/V classification methods. For this reason, proposed method which uses additional structural information extracted from a graph representation of the vascular network. The results of the proposed method will show improvements in overcoming the common variations in contrast inherent to retinal images.
LITERATURE REVIEW:
With respect to said work an extensive literature survey is conducted accordingly which is presented as below, 1. Several features like visual and geometrical have
explored the methods for artery or vein classification. Vessel diameter is not a reliable feature for artery or vein classification since it can be affected by diseases [3].
2. Martinez- Perez et al. (2002) In semi automatic method [4] geometrical and topological features of single vessel segments and sub trees are calculated. Significant points are detected through the skeleton extracted from the segmentation result. For labelling purpose root segment of the tree is tracked and then algorithm will search for its unique terminal points and decide if the segment is artery or vein.
3. Grisan et al.(2003) In optic disc zone arteries rarely cross arteries and veins rarely cross veins[5] hence by using vessel structure represented by tracking the classification is propagated outside this zone where little information is available to discriminate between arteries and veins. By applying ‘a divide at impera’ approach which partitioned a concentric zone around the optic disc into quadrants performs more robust local classification analysis.
ISSN: 2454-7875
VOLUME 2, ISSUE 3, March -2016
2 |
P a g e
retinal images are divided into four quadrants andthen it combines the result. Then by using tracking strategy based on minimal path vessel segments are joined to support the classification by voting.
5. C. Kondermann, D. Kondermann et al.(2007) Two feature extraction methods and two classification methods[7], based on support vector machine and neural network to classify retinal vessels. One of the feature extraction methods is based on ROI (Region Of Interest) around each centerline point while the other is profile based. To reduce dimensionality of feature vectors principal component analysis is used.
6. M. Niemeijer, B. van Ginneken et al.(2009) Image feature and classifier is an automatic method for classifying retinal vessels into arteries and veins[8]. A set of centreline features is extracted and a soft label is assigned to each centerline, indicating it’s being a vein pixel.
7. R.Estrada, C.Tomasi et al.(2012) present a methodology[9] for vessel structure in human retina using Dijkstra’s shortest-path algorithm. The method requires no manual intervention, preserves vessel thickness and follows vessel branching naturally and efficiently.
8. M. Niemeijer, X. Xu, A. Dumitrescu, P. Gupta et al.(2011) In the classification method[10] is considered as a step in calculating AVR value. The estimation of AVR requires vessel segmentation, accurate vessel width measurement and artery vein classification hence slight error can produce large influence on the final value.
PROPOSED WORK:
The method proposed in this project follows a graph based approach, where the characteristics of the vessel tree at the region near the optic disc are focused. In this region arteries and veins rarely cross themselves which helps to define different types of intersection points: A bifurcation, crossing, meeting and connecting point. The geometrical analysis of the graph representation of the vascular structure takes the decision on the type of intersection point.
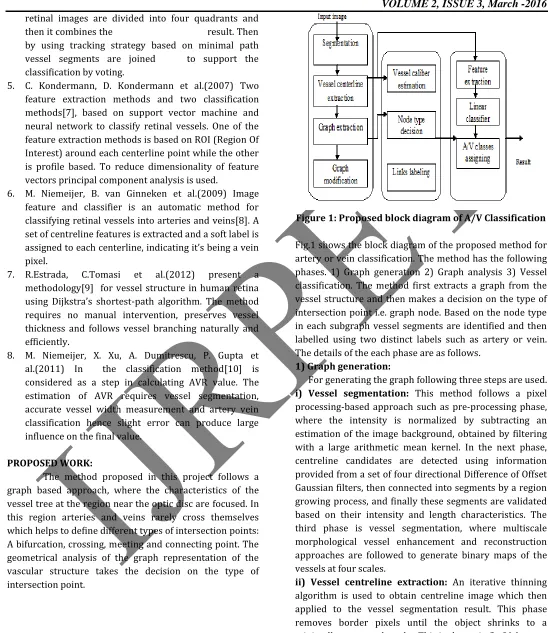
Figure 1: Proposed block diagram of A/V Classification
Fig.1 shows the block diagram of the proposed method for artery or vein classification. The method has the following phases. 1) Graph generation 2) Graph analysis 3) Vessel classification. The method first extracts a graph from the vessel structure and then makes a decision on the type of intersection point i.e. graph node. Based on the node type in each subgraph vessel segments are identified and then labelled using two distinct labels such as artery or vein. The details of the each phase are as follows.
1) Graph generation:
For generating the graph following three steps are used.
i) Vessel segmentation: This method follows a pixel
processing-based approach such as pre-processing phase, where the intensity is normalized by subtracting an estimation of the image background, obtained by filtering with a large arithmetic mean kernel. In the next phase, centreline candidates are detected using information provided from a set of four directional Difference of Offset Gaussian filters, then connected into segments by a region growing process, and finally these segments are validated based on their intensity and length characteristics. The third phase is vessel segmentation, where multiscale morphological vessel enhancement and reconstruction approaches are followed to generate binary maps of the vessels at four scales.
3 |
P a g e
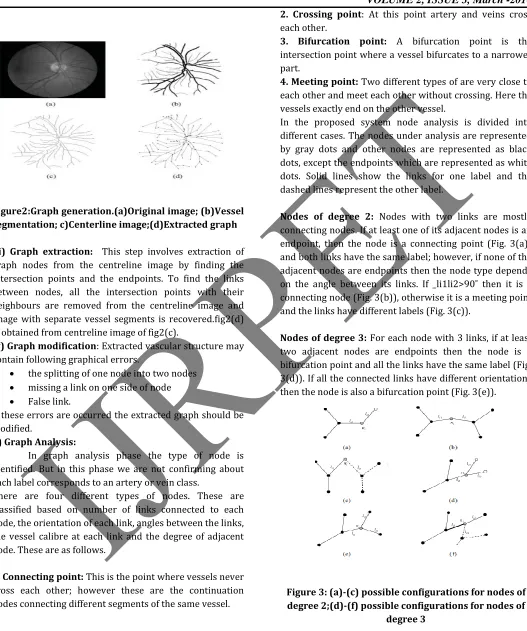
Figure2:Graph generation.(a)Original image; (b)Vesselsegmentation; c)Centerline image;(d)Extracted graph
iii) Graph extraction: This step involves extraction of graph nodes from the centreline image by finding the intersection points and the endpoints. To find the links between nodes, all the intersection points with their neighbours are removed from the centreline image and image with separate vessel segments is recovered.fig2(d) is obtained from centreline image of fig2(c).
iv) Graph modification: Extracted vascular structure may
contain following graphical errors.
the splitting of one node into two nodes
missing a link on one side of node
False link.
If these errors are occurred the extracted graph should be modified.
2) Graph Analysis:
In graph analysis phase the type of node is identified. But in this phase we are not confirming about each label corresponds to an artery or vein class.
There are four different types of nodes. These are classified based on number of links connected to each node, the orientation of each link, angles between the links, the vessel calibre at each link and the degree of adjacent node. These are as follows.
1. Connecting point: This is the point where vessels never
cross each other; however these are the continuation nodes connecting different segments of the same vessel.
2. Crossing point: At this point artery and veins cross each other.
3. Bifurcation point: A bifurcation point is the
intersection point where a vessel bifurcates to a narrower part.
4. Meeting point: Two different types of are very close to
each other and meet each other without crossing. Here the vessels exactly end on the other vessel.
In the proposed system node analysis is divided into different cases. The nodes under analysis are represented by gray dots and other nodes are represented as black dots, except the endpoints which are represented as white dots. Solid lines show the links for one label and the dashed lines represent the other label.
Nodes of degree 2: Nodes with two links are mostly
connecting nodes. If at least one of its adjacent nodes is an endpoint, then the node is a connecting point (Fig. 3(a)) and both links have the same label; however, if none of the adjacent nodes are endpoints then the node type depends on the angle between its links. If _li1li2>90˚ then it is a connecting node (Fig. 3(b)), otherwise it is a meeting point and the links have different labels (Fig. 3(c)).
Nodes of degree 3: For each node with 3 links, if at least
two adjacent nodes are endpoints then the node is a bifurcation point and all the links have the same label (Fig. 3(d)). If all the connected links have different orientations then the node is also a bifurcation point (Fig. 3(e)).
Figure 3: (a)-(c) possible configurations for nodes of degree 2;(d)-(f) possible configurations for nodes of
degree 3
ISSN: 2454-7875
VOLUME 2, ISSUE 3, March -2016
4 |
P a g e
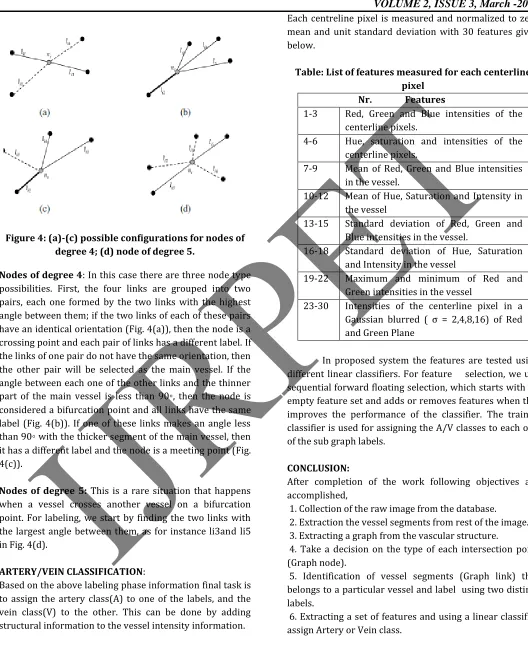
Figure 4: (a)-(c) possible configurations for nodes ofdegree 4; (d) node of degree 5.
Nodes of degree 4: In this case there are three node type
possibilities. First, the four links are grouped into two pairs, each one formed by the two links with the highest angle between them; if the two links of each of these pairs have an identical orientation (Fig. 4(a)), then the node is a crossing point and each pair of links has a different label. If the links of one pair do not have the same orientation, then the other pair will be selected as the main vessel. If the angle between each one of the other links and the thinner part of the main vessel is less than 90◦, then the node is considered a bifurcation point and all links have the same label (Fig. 4(b)). If one of these links makes an angle less than 90◦ with the thicker segment of the main vessel, then it has a different label and the node is a meeting point (Fig. 4(c)).
Nodes of degree 5: This is a rare situation that happens when a vessel crosses another vessel on a bifurcation point. For labeling, we start by finding the two links with the largest angle between them, as for instance li3and li5 in Fig. 4(d).
ARTERY/VEIN CLASSIFICATION:
Based on the above labeling phase information final task is to assign the artery class(A) to one of the labels, and the vein class(V) to the other. This can be done by adding structural information to the vessel intensity information.
Each centreline pixel is measured and normalized to zero mean and unit standard deviation with 30 features given below.
Table: List of features measured for each centerline pixel
Nr. Features
1-3 Red, Green and Blue intensities of the centerline pixels.
4-6 Hue, saturation and intensities of the centerline pixels.
7-9 Mean of Red, Green and Blue intensities in the vessel.
10-12 Mean of Hue, Saturation and Intensity in the vessel
13-15 Standard deviation of Red, Green and Blue intensities in the vessel.
16-18 Standard deviation of Hue, Saturation and Intensity in the vessel
19-22 Maximum and minimum of Red and Green intensities in the vessel
23-30 Intensities of the centerline pixel in a Gaussian blurred ( σ = 2,4,8,16) of Red and Green Plane
In proposed system the features are tested using different linear classifiers. For feature selection, we use sequential forward floating selection, which starts with an empty feature set and adds or removes features when this improves the performance of the classifier. The trained classifier is used for assigning the A/V classes to each one of the sub graph labels.
CONCLUSION:
After completion of the work following objectives are accomplished,
1. Collection of the raw image from the database. 2. Extraction the vessel segments from rest of the image. 3. Extracting a graph from the vascular structure.
4. Take a decision on the type of each intersection point (Graph node).
5. Identification of vessel segments (Graph link) that belongs to a particular vessel and label using two distinct labels.
5 |
P a g e
REFERENCES:
[1] M. D. Knudtson, K. E. Lee, L. D. Hubbard, T. Y. Wong, R. Klein, and B. E. K. Klein,“Revised formulas for summarizing retinal vessel diameters,” Current Eye Res., vol. 27, pp.143– 149, Oct. 2003
[2] R. Estrada, C. Tomasi, M. T. Cabrera, D. K. Wallace, S. F. Freedman, and S. Farsiu,“Exploratory dijkstra forest based automatic vessel segmentation: Applications in videoindirect ophthalmoscopy (VIO),” Biomed. Opt. Exp., vol. 3, no. 2, pp. 327–339, 2012
[3] K. Rothaus, X. Jiang, and P. Rhiem, “Separation of the retinal vascular graph in arteries an
veins based upon structural knowledge,” Image Vis.Comput., vol. 27, pp. 864–875, Jun.2009.
[4] M. E. Martinez-Perez, A. D. Hughes, A. V. Stanton, S. A. Thom, N. Chapman, A. A. Bharath, and K. H. Parker, “Retinal
vascular tree morphology: A semi-automatic
quantification,” IEEE Trans. Biomed. Eng., vol. 49, no. 8, pp. 912–917, Aug. 2002.
[5] E. Grisan and A. Ruggeri, “A divide et impera strategy for automatic classification of retinal
vessels into arteries and veins,” in Proc. 25th Annu. Int. Conf. IEEE Eng. Med. Biol. Soc., Sep. 2003, pp. 890–893.
[6] S. Vazquez, B. Cancela, N. Barreira, M. Penedo, and M. Saez, “On the automatic computation of the arterio-venous ratio in retinal images: Using minimal paths for the artery/vein classification,” in Proc. Int. Conf. Digital Image Comput., Tech. Appl., 2010, pp. 599–604.
[7] C. Kondermann, D. Kondermann, and M. Yan, “Blood vessel classification into arteries and veins in retinal images,” Proc. SPIE, Progr. Biomed. Opt. Imag., vol. 6512, no. 651247, Feb. 2007.
[8] M. Niemeijer, B. van Ginneken, and M. D. Abramoff, “Automatic classification of retinal vessels into arteries and veins,” Proc. SPIE, Progr. Biomed. Opt. Imag., vol. 7260, no.72601F, Feb. 2009.
[9] R. Estrada, C. Tomasi, M. T. Cabrera, D. K. Wallace, S. F. Freedman, and S. Farsiu,“Exploratory dijkstra forest based automatic vessel segmentation: Applications in video indirect ophthalmoscopy (VIO),” Biomed. Opt. Exp., vol. 3, no. 2, pp. 327–339, 2012.