www.soil-journal.net/1/583/2015/ doi:10.5194/soil-1-583-2015
© Author(s) 2015. CC Attribution 3.0 License.
SOIL
SF3M software: 3-D photo-reconstruction for non-expert
users and its application to a gully network
C. Castillo1,2, M. R. James3, M. D. Redel-Macías2, R. Pérez2, and J. A. Gómez1 1Institute for Sustainable Agriculture, CSIC, Apartado 4084, 14080 Cordoba, Spain
2University of Córdoba, Dept. of Rural Engineering, Campus Rabanales, Leonardo Da Vinci Building,
14071 Cordoba, Spain
3Lancaster Environment Centre, Lancaster University, Lancaster, UK
Correspondence to: C. Castillo ([email protected])
Received: 6 April 2015 – Published in SOIL Discuss.: 29 April 2015 Revised: 14 July 2015 – Accepted: 31 July 2015 – Published: 27 August 2015
Abstract. Three-dimensional photo-reconstruction (PR) techniques have been successfully used to produce high-resolution surface models for different applications and over different spatial scales. However, innovative approaches are required to overcome some limitations that this technique may present for field image acquisi-tion in challenging scene geometries. Here, we evaluate SF3M, a new graphical user interface for implementing a complete PR workflow based on freely available software (including external calls to VisualSFM and Cloud-Compare), in combination with a low-cost survey design for the reconstruction of a several-hundred-metres-long
gully network. SF3M provided a semi-automated workflow for 3-D reconstruction requiring ∼49 h (of which
only 17 % required operator assistance) for obtaining a final gully network model of>17 million points over a gully plan area of 4230 m2. We show that a walking itinerary along the gully perimeter using two lightweight automatic cameras (1 s time-lapse mode) and a 6 m long pole is an efficient method for 3-D monitoring of gul-lies, at a low cost (∼EUR 1000 budget for the field equipment) and the time requirements (∼90 min for image collection). A mean error of 6.9 cm at the ground control points was found, mainly due to model deformations derived from the linear geometry of the gully and residual errors in camera calibration. The straightforward im-age collection and processing approach can be of great benefit for non-expert users working on gully erosion assessment.
1 Introduction
3-D photo-reconstruction (3D-PR) based on structure-from-motion (SfM) algorithms has been applied to date to a large number of geoscience applications (James and Robson, 2012; Westoby et al., 2012; Fonstad et al., 2013). Although there has been a great advance in the last years regarding imagery collection (for instance, derived from the develop-ment of UAV (unmanned aircraft vehicle) platforms) and im-age processing (commercial as well as free software), the complete photo-reconstruction (PR) and analysis workflow frequently remains lengthy and not straightforward (Kaiser et al., 2014). If using freely available software, it requires working on a number of different applications to cover ba-sic image pre-processing, photo-reconstruction,
georeferenc-ing and post-processgeoreferenc-ing operations. Commercial PR software generally has the ability to perform full PR workflows, but can lack detailed processing information and can restrict user interaction with intermediate and final results.
While recent UAV technologies have the capacity of sur-veying large areas of the landscape (Mathews and Jensen, 2013; Mancini et al., 2013), not all stakeholders (e.g. re-searchers, technicians and land owners) have the technical and financial resources to use such sophisticated techniques. In addition, government regulations in several countries are becoming increasingly stringent for UAV operations, which hampers the widespread application of this tool.
and technical users concerned with geomorphological pro-cesses, such as gully erosion. Fonstad et al. (2013) suggested that terrestrial PR techniques could improve their cost benefit performance by using multiple operators, poles, video cap-ture or a combination of terrestrial and aerial images. New technologies (such as lightweight cameras) and recent com-puter developments offer new opportunities to improve data collection and processing. Powerful and freely available soft-ware applications have been developed – e.g. VisualSFM for photo-reconstruction (Wu, 2013) or CloudCompare for cloud processing (Girardeau-Montaut, 2015) among others – and are being constantly improved through the valuable effort of their developers and users’ feedback.
3-D PR has been used for gully erosion assessment at the gully reach or headcut scale (Castillo et al., 2012a; Kaiser et al., 2014; Gómez-Gutiérrez et al., 2014) and ephemeral gullies (Castillo et al., 2014a), usually not more than a few metres extent. However, the full characterization of gully ero-sion requires the assessment of entire gully networks to un-derstand their geometry and dynamics and this brings several challenges for terrestrial PR:
1. morphological complexity: gullies comprise long net-works of varying size along their length;
2. valley location: gullies are deep trenches that do not fa-cilitate easy all-round image collection, hampering mul-tiple convergent perspectives;
3. linearity: gullies present very high length/width ratios making the photo-reconstruction models more vulnera-ble to systematic errors.
As an effort to facilitate the use of freely available PR soft-ware for demanding gully erosion applications, here we de-velop a combination of a rapid survey method and SF3M, a workflow software tool for the efficient processing of accu-rate 3-D models of gully networks at a reduced cost. For this purpose, (1) we present SF3M, a new graphical user inter-face to guide PR workflow carried out with existing freely available software; (2) we describe a field methodology for the rapid assessment of gully networks; and (3) we evaluate their performance and the 3-D model accuracy with a study case of gully erosion in the Campiña landscape.
2 Material and methods
2.1 SF3M: a GUI for efficient photo-reconstruction
SF3M v1.0 has been devised as a freely available tool for semi-automated 3-D PR to offer a complete workflow from the image set to the 3-D model. SF3M v1.0 is written in
Matlab®(Mathworks, Natick, MA, USA) and comprises
al-gorithms developed by the authors of this paper, a num-ber of previous scripts written by other authors (Table 1) as well as external calls to free software such as VisualSFM (Wu, 2013, 2015) and CloudCompare (Girardeau-Montaut,
2015). SF3M takes advantage of the command line possibil-ities already present in these external applications to perform key operations, such as photo-reconstruction (including SIFT features detection, bundle adjustment, sparse and dense re-construction inside the VisualSFM package) and point cloud processing (i.e. point density, filtering and merging opera-tions in CloudCompare).
The GUI is organized in three windows: main, image and display window (Fig. 1). The main window allows the user to define the operations to be performed. The image window can be used to visualize a photograph, and to enter and delete ground control point (GCP) observations. The display win-dow gives information on the stage in process, time left to finish and main results.
SF3M v1.0 use follows a sequential process including pre-preprocessing, reconstruction, georeferencing and post-processing stages. All the command options are displayed in the main window so that the user can enter the processing op-tions in advance and leave the application running automat-ically. This design is intended to keep the GUI operation as simple as possible, facilitating its use for non-trained users.
The main features of the SF3M are outlined in Table 1. For a more detailed description of SF3M v1.0 functionali-ties, the SF3M executable and instructions are available at SF3Mapp.csic.es.
2.2 Field methodology for rapid gully network assessment
We designed a methodology of field image collection for rapid gully erosion reconstruction based on four principles:
1. Automated image collection from a pole to capture high centre-perspectives of the gully from its perimeter.
2. Near-simultaneous capture of two perspectives (two cameras needed on the pole), with one vertical and the other inclined, to (1) maximize the probability of successful image matching between photographs taken from different sides of the gully, in order to achieve a single 3-D model; (2) ensure a convergent imaging ge-ometry to help minimise systematic reconstruction er-rors and model distortion.
3. Image capture from only one walking itinerary along the entire gully perimeter.
4. Use of low-cost devices and materials for image collec-tion.
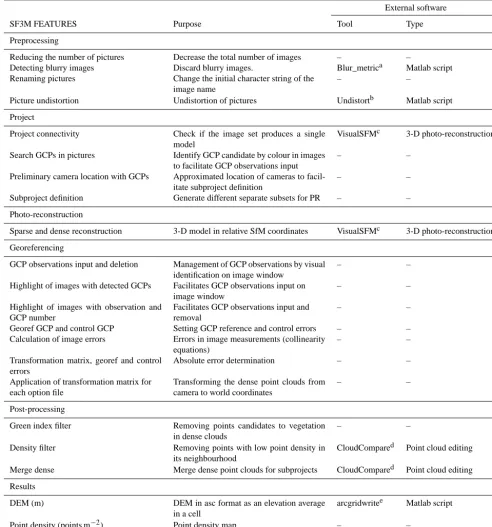
Table 1.SF3M v1.0 features showing the aim of each stage and software used.
External software
SF3M FEATURES Purpose Tool Type
Preprocessing
Reducing the number of pictures Decrease the total number of images – –
Detecting blurry images Discard blurry images. Blur_metrica Matlab script Renaming pictures Change the initial character string of the
image name
– –
Picture undistortion Undistortion of pictures Undistortb Matlab script
Project
Project connectivity Check if the image set produces a single model
VisualSFMc 3-D photo-reconstruction
Search GCPs in pictures Identify GCP candidate by colour in images to facilitate GCP observations input
– –
Preliminary camera location with GCPs Approximated location of cameras to facil-itate subproject definition
– –
Subproject definition Generate different separate subsets for PR – –
Photo-reconstruction
Sparse and dense reconstruction 3-D model in relative SfM coordinates VisualSFMc 3-D photo-reconstruction
Georeferencing
GCP observations input and deletion Management of GCP observations by visual identification on image window
– –
Highlight of images with detected GCPs Facilitates GCP observations input on image window
– –
Highlight of images with observation and GCP number
Facilitates GCP observations input and removal
– –
Georef GCP and control GCP Setting GCP reference and control errors – – Calculation of image errors Errors in image measurements (collinearity
equations)
– –
Transformation matrix, georef and control errors
Absolute error determination – –
Application of transformation matrix for each option file
Transforming the dense point clouds from camera to world coordinates
– –
Post-processing
Green index filter Removing points candidates to vegetation in dense clouds
– –
Density filter Removing points with low point density in its neighbourhood
CloudCompared Point cloud editing
Merge dense Merge dense point clouds for subprojects CloudCompared Point cloud editing
Results
DEM (m) DEM in asc format as an elevation average in a cell
arcgridwritee Matlab script
Point density (points m−2) Point density map – – SfM precision (mm) SfM error in sparse point cloud (Eq. 1) – –
aNaccari (2011). Matlab script for image blur metrics based on the blur index developed by Marziliano et al. (2004);bBoughet (2014);cWu (2013);dGirardeau-Montaut (2015); eStevens (2007).
sections. Each of the three gully branches were taken as sep-arate photo-reconstruction units in the field and processing stages. The gully network was selected for its convenient lo-cation near to Córdoba city as well as for having been filled
in during 2008, which provides a baseline to estimate recent gully erosion.
In this study, two GoPro Hero3+cameras were equipped
with non-fisheye lenses, i.e. 4.14 mm focal length, f/3.0
re-Figure 1.SF3M v1.0 with the main window on the right, image window on the upper left and display window on the bottom left. Among other SF3M features, the figure shows (1) highlighting of image listbox with detected ground control points GCPs (yellow) and with observa-tions (blue) in the observaobserva-tions window; (2) text in green colour for performed operaobserva-tions; (3) subproject listbox for subproject management; (4) GCPs table with mean georef and control errors. SF3M executable, licence and instructions can be found at the SF3Mapp.csic.es domain.
spectively (Peau Productions, CA, USA, http://www. peauproductions.com/store/). The cameras were mounted on a 6 m long pole (made from a 9 m long carbon-fibre tele-scopic fishing rod) to gain height to capture the gully dimen-sions from a centre position in time lapse capture mode (1 s interval). To reduce camera vibrations, the unused 3 m of the telescopic 9 m long fishing rod was secured with plastic cable ties at the end of the 6 m pole.
Both cameras were fixed to the pole end adjacent to each other and held in a horizontal position with the help of plastic wedges and cable ties. One camera looked down in a roughly nadir perspective (closest to the pole end for a higher ele-vation to compensate for the less deep perspective) and the other was inclined to around 10◦. This camera arrangement was intended to (a) obtain a high overlap between images taken with both cameras; (b) ensure the connectivity of the whole image set obtained from different sides of the gully: the two nadir image sets (up- and downwards itineraries) will serve as connectors and the two tilted sets will provide image convergence. Both aspects would be helpful to obtain one single 3-D model with geometric consistency. The typical overlap derived from this camera setting, the walking speed and the time-lapse interval was around 90 % for successive images taken from the same camera. As for the overlap be-tween images from different cameras, the tilted pictures en-compassed totally the scene captured by the nadir camera due to its higher position and inclined orientation (Fig. 3a and b). An uninterrupted itinerary along the gully perimeter was followed at a slow walking speed, starting from one point and ending on the opposite side of each gully branch (Fig. 3c). Forty five targets, hereafter called ground control points
(GCPs), of 20×20 cm dimensions in two colours (pink for
even numbers and yellow for odd numbers). This colour symbology was meant to differentiate georeferencing GCPs (even numbers) and error-checking GCPs (odd numbers). The first group of GCPs was used to georefer the point cloud and the second group to evaluate its errors. Different colours facilitated the operator in the deployment of the targets in the field to achieve their even spacial distribution.
2.3 Processing methodology in SF3M
The key features of the processing workflow followed using SF3M v1.0 are listed below:
1. Simplicity in the design and operation, with only one GUI window to define the array of algo-rithms to run. The typical operation for a project reconstruction would include five sequential steps: (a) pre-processing to prepare the image set (auto-mated); (b) project definition, to check the image connectivity and the number of subprojects to pro-cess (semi-automated); (c) photo-reconstruction (auto-mated); (d) georeferencing (semi-auto(auto-mated); (e) post-processing (semi-automated). Within each of these steps for a PR project, several options can be selected for successive processing, e.g. blurry images detec-tion+image undistortion or green index filter+density filter+Merge+DEM+SfM accuracy. In addition, if the batch mode is activated, the selected operations can be performed over different PR projects.
Figure 2.(a and b) Location of the study site (source: https://www.google.es/maps); (c) plan view of the gully network with indication of the
branch number for photo-reconstruction purposes from the 2011 orthophotography (Junta de Andalucía, 2015). In white dots, the location of the ground control points GCPs deployed in the gully.
point) for use with undistorted images and the fixed camera calibration mode in VisualSFM. In this work, we could not take advantage of this option because Vi-sualSFM does not allow simultaneous use of more than one camera in this mode. Therefore, the internal cam-era parameters were estimated automatically during the bundle adjustment in VisualSFM.
Furthermore, SF3M allows the user to undistort images if camera calibration data are available from the Mat-lab Calibration Toolbox (Bouguet, 2014). For our study, both cameras were calibrated using this toolbox and all images were then undistorted keeping the VisualSFM “determine radial distortion option” disabled.
3. Pair preselection: a first fast run of VisualSFM is per-formed to identify the significant matches between im-age pairs (pairs with inlier matches) by comparing all the possible pair combinations, but using only a rela-tively small number of features from each image for speed. SF3M sets a limit of 1200 features to use in the VisualSFM settings (the default value is 8192) for the project connectivity analysis. This value has proved to be sufficiently large to accurately capture the image connection, but at a minimum processing cost.
As a result of this analysis, a list of connected image pairs is generated, which will be the input to the final matching stage. This list includes generally much fewer image pairs than all the possible combinations among the pictures. The number of the possible combinations (and consequently, processing time) follows a square power law with the number of pictures, while normally the image connection is highly linear (only pictures in the neighbourhood share common features). This results
in a significant reduction in the match processing dura-tion, one of the more time-consuming stages.
4. Subproject delineation: in SF3M the project connectiv-ity analysis not only checks for the production of a sin-gle model and generates an optimal pair list but also pro-vides the approximate locations of cameras with GCPs (provided that GCP observations have been entered by the user in the image window and the search GCPs algo-rithm performed). This option allows the delineation of subprojects, which are reconstructed separately, by se-lecting the cameras to be included in the analysis with a polygon drawing tool. Overlapping areas between sub-projects are recommended to reduce the errors in the merging process. This tool is advantageous for field sur-veys where images of the same areas are taken at differ-ent times (e.g. in a gully, the upstream and downstream walks on different sides of the same gully region) and to minimise the effects of systematic errors in large image sets.
5. Photo-reconstruction: in SF3M v1.0 the
photo-reconstruction stage is carried out through a system call to VisualSFM using command line syntax to drive automated processing. The main VisualSFM commands used in our utility are extracting SIFT features, image matching, exporting match matrix, bundle adjustment and dense reconstruction (multi-view stereo PMVS2 software, Furukawa and Ponce, 2010).
pro-Figure 3. Camera operation in the gully erosion study: (a) view of the operator during the field survey; (b) closer view of the two GoPro Hero3+cameras on the 6 m pole with differential angle be-tween cameras. (c) Sketch of the image collection methodology as a walking itinerary along the gully perimeter. The rough nadir per-spective (N) corresponds to the camera close to the pole tip and the tilted perspective (T) to the camera slightly below.
vides information on the number of observations per GCP, the image errors (in pixels) and the absolute er-rors (m). The tool gives the option of selecting which GCPs are to be used for georeferencing (georef GCPs) and which others are used to evaluate errors (control GCPs).
7. Dense cloud filtering: SF3M includes two optional fil-ters to be applied to the dense point clouds. The green index filter removes those points with a green index above the threshold selected by the user, for instance, green parts of vegetation standing at the banks or gully bottom. The green index is calculated using GI=2g− b−r, wherer,bandgstand for the pixel value of each of the colour bands in the RGB image (Meyer and Neto, 2008). The density filter is intended to remove those points with a low point density in their neighbourhood, typically related to lower accuracies. It is also helpful to remove inaccurate points in overlapping areas shared by two dense point clouds which may reduce the accuracy
of pre-existent more accurate points. The density filter is performed automatically through command line calls to two CloudCompare algorithms: density calculation and filter by point value.
8. Merging dense point clouds: SF3M automatically merges all the dense point clouds belonging to a project using CloudCompare in command line. If sub-project definition is not carried out, the resulting merged file is the final dense point cloud. For multiple subpro-jects, to obtain the final point cloud, the intermediate subproject clouds need to be merged manually by the user (step 9).
9. Point cloud editing: two manual operations were per-formed fully inside CloudCompare: subproject and project merging, and non-green vegetation filtering.
The merging procedure involves the following algo-rithms: (a) distance cloud-to-cloud of adjacent clouds to determine the specific area inside the overlapping region with minimal errors; (b) cropping both point clouds along this area of minimal error to remove the overlap-ping; (c) merging the point clouds.
To filter non-green vegetation (long-standing greyish prickly weeds, in our case) the point classification al-gorithm CANUPO (Brodu and Lague, 2012) was used, through its inclusion as a ready-to-use script in Cloud-Compare. CANUPO performs a point classification into two groups (in this example, weeds and soil) after a training stage carried out by the user.
10. Results: SF3M provides the DEM (average of thez val-ues of points included in a cell of a size defined by the user), a point density map (points m−2) and an “SfM precision” map. A decimation factor can be included to speed up the processing, i.e. a factor of 10 would include only a tenth of the points in a cell for the computations, for processing large or particularly dense point clouds. We use the term “SfM precision” to describe local un-certainties in the sparse point cloud. For each point, the local uncertainty is approximated by considering (a) the camera’s focal length, (b) the camera-to-point distance in world coordinates, and (c) the maximum image error, where image error is defined as the image distance be-tween an identified feature position and the projection of the associated 3-D point in that image. This SfM er-ror is estimated with the following expression:
SfM precision (mm)=image_error (pixels)
focal_length(pixels)
·distance_point2camera (mm). (1)
a model. Nevertheless, it provides a useful quantification of photo-reconstruction error on a local basis.
Finally, SF3M v1.0 saves relevant outputs in the main folder for further edition by the user in csv, txt or ascii formats such as matching features, transformation matrices, DEM or point density map, among others. Figure 4 shows the SF3M workflow with indication of the command options to be selected in the main window.
3 Results
3.1 Field method performance
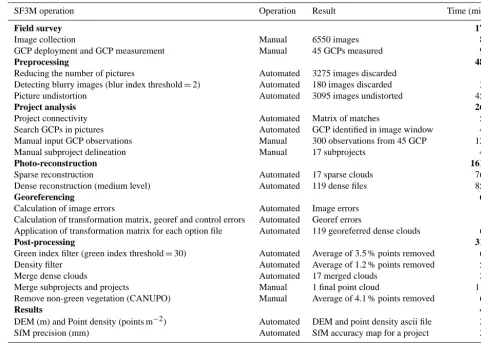
Table 2 shows the field and processing time requirements for this study. A total of 6650 images were taken in the field for the entire gully network at a rate of one picture per second and camera. Approximately 90 min of effective labour (travel to study area, pole preparation and GPS base stationing not considered) was necessary for the field survey. Image col-lection and GCP operations (deployment and measurement)
had similar time requirements, ∼90 min each. Two
opera-tors participated in the survey, one for the image capture and the other for GCP measurement, working simultaneously for efficiency purposes.
If no georeferencing had been necessary (for instance, if there is no need for several time series comparisons) a much faster approach for scaling and orientation might be fol-lowed, using levelled objects of known size, as in previous works (Castillo et al., 2014b; Kaiser et al., 2014). In highly linear models such as the gully network, simple procedures (e.g. a carefully levelled several-metres-long thin rope com-monly used in construction works) are applicable for later scaling and orientation using a point cloud editing software.
Over recently ploughed gully margins, a walking speed of
∼1.5 km h−1 (approximately a third of normal speed) was necessary to avoid undesired movement in the camera and blurred images. Despite the lightness of the selected mate-rials (pole and cameras) a short break in the image collec-tion was made after completing each of the gully branches to avoid operator fatigue. The camera height (∼5 m for the inclined 6 m long pole) was enough to capture the gully di-mensions in its larger cross section (11 m). This gully width seems the maximum achievable for the present image collec-tion design.
3.2 SF3M processing performance
With images taken at 1 s intervals, the image set could be reduced by a factor of 2 due to repetition within the pictures. The remaining 3275 images were automatically analysed for blur and 180 images with a blur index greater than 2 standard deviations above the mean value were discarded (Fig. 5a).
As expected, the project connectivity showed a multiple-matching pattern reflecting the nadir and tilted camera angles and downstream and upstream walking directions (Fig. 5b).
The match matrix diagonal corresponds to the connection be-tween consecutive images; additional lines parallel or per-pendicular to the diagonal reflect connectivity between up-stream and downup-stream image groups from the same or dif-ferent cameras.
The gully network was processed as three different PR projects (reflecting the number of gully branches) which were then merged in a single point cloud. For the com-puter used in this study (intel Core i7 2 Ghz with four cores, 8 GB RAM), a total of 2960 min was necessary to process the entire gully network, i.e.∼49 h, of which 17 % required operator assistance and 83 % only computer time. Photo-reconstruction (54.5 % of the total time) and picture undis-tortion (15.2 %) were the two most time-consuming stages.
All the processing steps were performed using SF3M v1.0 except for those specified in the methods section which re-quired point cloud editing in CloudCompare: (1) subpro-ject merging for the chunks reconstructed separately inside a gully branch to reduce model deformation; (2) project merg-ing for the three gully branches; (3) non-green vegetation fil-ter using CANUPO. Regarding the vegetation filfil-tering, firstly the automated green index filter was applied inside SF3M re-sulting in a 3.5 % of the total points in the model removed corresponding to small green weeds (Fig. 6a). The second main type of vegetation in the gully was a tall-standing grey-ish weed, which was filtered using CANUPO. The points fil-tered as this last type of vegetation amounted to 4.1 % of the total, although its detrimental effects on the model were sig-nificant at some gully bottom areas (Fig. 6b).
The final gully model had >17 million points over a plan area of 4230 m2, making a point density average of 4020 points m−2 (Fig. 6c), or approximately 1 point every
2 cm2, which was sufficient for the 3-D modelling purposes at this scale. A higher point density (roughly twice the num-ber of points) could have been achieved by selecting the max-imum density level in the pmvs2 algorithm at the cost of a longer processing time in the dense reconstruction stage (ap-proximately by a factor of 5). In many applications, higher densities might be impractical and not required for DEM construction. The final photo-reconstruction percentage (the cells with elevation values to total cells ratio) for the 0.25 m DEM was 74.25 %, due to the abundant vegetation occlusion at the gully bottom in certain areas.
3.3 3-D model accuracy
Figure 4.SF3M v1.0 workflow stages and their correspondence with command options on the SF3M main window. The dotted lines in the diagram indicate optional stages in a reconstruction project.
There is a variety of sources of error as a consequence of the inexpensive and rapid survey methodology selected in this study such as low-quality camera lenses, uncertainty in the internal camera parameters of the GoPro camera models, reduced number of perspectives from images with only two main angles and the low number of pictures per spatial unit. All these factors may contribute to error in the 3-D model both on the local scale (i.e. in the form of uncertainties in the point position) and the model scale (geometrical deforma-tions due to systematic errors accumulating over the model extent).
The discrepancy between the GCP error and the estimated SfM precision can be explained mainly as the result of the model deformation at the several-tens-of-metres scale, and is likely to reflect residual error in the camera calibrations (James and Robson, 2014). This deformation is visualized as an apparent dome effect at both extremes of each dense point cloud, with increasing error for larger distances from the point cloud centroid. Although the image collection was designed to minimise this effect by specifically including in-clined images, doming effects remain noticeable.
In this study, the most successful strategy to mitigate the model deformation was to divide the photo-reconstruction project in different subprojects for separate reconstruction using the subproject tool in SF3M. The length of each sub-project was defined by the condition of including at least four GCPs. Since a total of 45 GCPs were deployed in the
field, an average length of ∼50 m per subproject was
ob-tained. This approach was advantageous in terms of overall accuracy but implied an additional processing time for man-ually stitching and merging the 17 subprojects in
CloudCom-pare by determining the area of minimal error between adja-cent point clouds.
If the subproject definition strategy would not be ap-plied, for instance by reconstructing a several-hundred-metres gully reach in one project, the deformation errors would have been in the order of several tens of centime-tres. Similarly, James and Robson (2014) found doming de-formations of∼0.2 m over horizontal distances of∼100 m for simulations representative of UAV flights. Their recom-mendations on using fixed calibration to avoid doming errors could not be followed because VisualSFM does not include a fixed calibration option for multiple cameras.
When compared with previous studies on gully erosion as-sessment through SfM photo-reconstruction (Castillo et al., 2012a, 2014; Gómez-Gutiérrez et al., 2014; Kaiser et al., 2014) in terms of unitary efficiency (field effort per meter of gully), this work showed larger errors (roughly 2 times the average errors in those studies) but at a lower survey inten-sity (images per meter of gully) and at 1 order of magnitude lower time requirements (Table 3).
3.4 Gully erosion estimate
Table 2.Field and processing time requirements grouped by stages (in bold) for the entire gully network. Main results and type of operation are included.
SF3M operation Operation Result Time (min)
Field survey 170
Image collection Manual 6550 images 80 GCP deployment and GCP measurement Manual 45 GCPs measured 90
Preprocessing 487
Reducing the number of pictures Automated 3275 images discarded 5 Detecting blurry images (blur index threshold=2) Automated 180 images discarded 32 Picture undistortion Automated 3095 images undistorted 450
Project analysis 263
Project connectivity Automated Matrix of matches 55 Search GCPs in pictures Automated GCP identified in image window 48 Manual input GCP observations Manual 300 observations from 45 GCP 120 Manual subproject delineation Manual 17 subprojects 40
Photo-reconstruction 1615
Sparse reconstruction Automated 17 sparse clouds 765 Dense reconstruction (medium level) Automated 119 dense files 850
Georeferencing 60
Calculation of image errors Automated Image errors – Calculation of transformation matrix, georef and control errors Automated Georef errors – Application of transformation matrix for each option file Automated 119 georeferred dense clouds 60
Post-processing 318
Green index filter (green index threshold=30) Automated Average of 3.5 % points removed 68 Density filter Automated Average of 1.2 % points removed 55 Merge dense clouds Automated 17 merged clouds 25 Merge subprojects and projects Manual 1 final point cloud 110 Remove non-green vegetation (CANUPO) Manual Average of 4.1 % points removed 60
Results 47
DEM (m) and Point density (points m−2) Automated DEM and point density ascii file 25 SfM precision (mm) Automated SfM accuracy map for a project 22
2960
Table 3.Comparison between the survey intensity (number of pictures per metre of gully) and time requirements (image collection time per metre of gully) for different gully erosion studies using SfM photo-reconstruction including the present study.
Reference Gully Length Average Number Time for Survey Time feature (m) errors of image collection intensity requirements (m) pictures (min) (pictures m−1) (min m−1) Castillo et al. (2012a) Reach 7.1 0.025 191 10 26.9 1.4 Gómez-Gutiérrez et al. (2014) Headcut 6 0.048 64 NA 10.7 NA Kaiser et al. (2014) Headcut 4 – 257 30 64.3 7.5 Castillo et al. (2014) Ephemeral 30 0.036 515 90 17.2 3.0 Present study (2015) Network 750 0.069 3275 80 4.4 0.1
A total gully volume of 3484 m3 was obtained for a
drainage area of 10.9 ha at the gully network outlet. We as-sumed that the gully was filled in the summer of 2008 (com-mon period for this operation in the Campiña landscape) since the orthophotography (April 2009) shows the gully al-ready filled (Fig. 8). Also, due to the similarity in the gully network of 2011 and 2014 (present study), there is no evi-dence of further major filling operations between these dates.
Figure 5.SF3M results of the pre-processing and project analysis stages for the gully branch 2: (a) blur index for the ∼1800 im-age set with imim-age number label. Those imim-ages outside the upper 2 standard deviations interval (red line) were discarded; (b) matrix of matches with indication of the camera and direction in the image collection (in grey). The matrix of matches is symmetrical. Matches in the diagonal correspond to image sets only connected in the linear direction.
by seasons closer to the average (650 mm per year). This high value of mean gully erosion is in agreement with previ-ous assessments for similar conditions over the same period (Castillo et al., 2012b).
4 Conclusions
Three-dimensional photo-reconstruction techniques based on SfM algorithms have already demonstrated their capa-bility for producing accurate 3-D models in a range of geo-science applications. Nevertheless, research is still needed to improve efficiency in a number of challenging situations and their ease of use for workers not necessarily skilled in
pho-Figure 6.(a) View of gully branch 2 from the inclined camera
showing two ground control points GCPs; (b) digital elevation model (m) and (c) point density map (points m−2) for the entire gully network from SF3M results. Several gaps in the 3-D model can be noticed as a result of vegetation occlusion, mainly small green weeds (removed by the green index filter) and tall grey weeds (filtered by applying the point classification by CANUPO).
Figure 7.(a) Error magnitudes on the 3-D model (m) with dGPS
ground control point measurements as the reference (the 0.069 m average in red line); (b) estimated SfM local precision in mm (Eq. 1) taking into account the residuals in the image measurements and the camera-point distance for gully branch 1. The dominant dark blue colours show that average precision is around 1–2 cm.
togrammetric applications. SF3M v1.0 proved to be an effi-cient and flexible tool for 3-D photo-reconstruction in these regards, considering its simplicity and complete workflow.
op-Figure 8.Views of the gully network in the 2007, 2009 and 2011 orthophotos (Junta de Andalucía, 2015). Most probably, the gully was landfilled in the summer of 2008 and, since then, there is no evidence of having been filled again.
erator is required), in a short time span and has achieved moderate accuracies. Therefore, the survey design and pro-cessing methodology included in this study is a promising tool for gully erosion evaluation in scenarios with demand-ing budget and time constraints and reduced operator exper-tise. Moreover, SF3M provides a means for easy and fast 3-D photo-reconstruction in other geomorphological applications beyond gully erosion assessment. Future versions of SF3M will try to include new tools including improved GCPs de-tection and post-processing algorithms such as topographic analysis of the resulting DEM along with further improve-ment on the interface usability or on other aspects that might be suggested from users’ feedback.
Acknowledgements. This study was supported by Projects P08-AGR-03925 (Andalusian Government) and AGL2009-12936-C03-01 (Spanish Ministry of Science and Innovation), AGL2012-40128-C03-01 (Spanish Ministry of Economy and Competitiveness), RESEL (Spanish Ministry for Environment and Rural and Marine Affairs) and FEDER funds. This support is gratefully acknowledged. The authors would like to thank José Manuel Cabezas for his contribution in the gully survey. We also express our gratitude to all developers of freely available soft-ware for their generous contributions, especially to Changchang Wu and Daniel Girardeau-Montaut.
Edited by: M. Seeger
References
Boughet, J.: Undistortion script (Matlab Camera Calibration Tool-box), available at: http://www.vision.caltech.edu/bouguetj/calib_ doc/, last access: December 2014.
Brodu, N. and Lague, D.: Terrestrial lidar data classification of com-plex natural scenes using a multi-scale dimensionality criteria: applications in geomorphology, Journal of Photogrammetry and Remote Sensing, 68, 121–134, 2012.
Castillo, C., Pérez, R., James, M. R., Quinton, J. N., Taguas, E. V., and Gómez, J. A.: Comparing the Accuracy of Several Field
Methods for Measuring Gully Erosion, Soil Sci. Soc. Am. J., 76, 1319–1332, doi:10.2136/sssaj2011.0390, 2012a.
Castillo, C., Pérez, R., Mora, J., and Gómez, J. A.: Quantification of gully erosion in a cultivated area in Southern Spain under high rainfall conditions, EGU General Assembly, Vienna, Aus-tria, EGU2012-10976, 2012b.
Castillo, C., Taguas, E. V., Zarco-Tejada, P., James, M. R., and Gómez, J. A.: The normalized topographic method: an auto-mated procedure for gully mapping using GIS, Earth Surf. Proc. Land., 39, 2002–2015, doi:10.1002/esp.3595, 2014a.
Castillo, C., Rodríguez, A., Giráldez, J. V., and Gómez, J. A.: Mejora de la evaluación de la erosión por flujo concentrado en taludes de carreteras sobre diferentes materiales en Andalucía mediante foto-reconstrucción, Avances de la geomorfología en España, 2012–2014, 176–179, 2014b.
Fonstad, M. A., Dietrich, J. T., Courville, B. C., Jensen, J. L., and Carbonneau, P. E.: Topographic structure from motion: a new development in photogrammetric measurement, Earth Surf. Proc. Land., 38, 421–430, doi:10.1002/esp.3366, 2013.
Furukawa, Y. and Ponce, J.: Accurate, dense, and robust mul-tiview stereopsis, IEEE Trans. Pattern Anal., 32, 1362–1376, doi:10.1109/TPAMI.2009.161, 2010.
Girardeau-Montaut, D.: CloudCompare: 3D point cloud and mesh processing software, available at: http://www.danielgm.net/cc/, last access: 20 March 2015.
Gómez-Gutiérrez, A., Schnabel, S., Berenguer-Sempere, F., Lavado-Contador, F., and Rubio-Delgado, J.: Using 3D photo-reconstruction methods to estimate gully headcut erosion, Catena, 120, 91–101, doi:10.1016/j.catena.2014.04.004, 2014. James, M. R. and Robson, S.: Straightforward reconstruction of
3D surfaces and topography with a camera: Accuracy and geoscience application, J. Geophys. Res.-Earth, 117, F03017, doi:10.1029/2011JF002289, 2012.
James, M. R. and Robson, S.: Mitigating systematic error in topographic models derived from UAV and ground-based image networks, Earth Surf. Proc. Land., 39, 1413–1420, doi:10.1002/esp.3609, 2014.
Junta de Andalucía (Consejería de Medio Ambiente y Ordenación del Territorio): available at: http: //www.juntadeandalucia.es/medioambiente/site/rediam/ menuitem.aedc2250f6db83cf8ca78ca731525ea0/?vgnextoid= 0863d61d8470f210VgnVCM2000000624e50aRCRD&lr=lang_ es, last access: 20 March 2015.
Kaiser, A., Neugirg, F., Rock, G., Mueller, C., Haas, F., Ries, J., and Schmidt, J.: Small-Scale Surface Reconstruction and Vol-ume Calculation of Soil Erosion in Complex Moroccan Gully Morphology Using Structure from Motion, Remote Sensing, 6, 7050–7080, doi:10.3390/rs6087050, 2014.
Mancini, F., Dubbini, M., Gattelli, M., Stecchi, F., Fabbri, S., and Gabbianelli, G.: Using Unmanned Aerial Vehicles (UAV) for High-Resolution Reconstruction of Topography: The Structure from Motion Approach on Coastal Environments, Remote Sens-ing, 5, 6880–6898, doi:10.3390/rs5126880, 2013.
Marziliano, P., Dufaux, F., Winkler, S., Ebrahimi, T.: Perceptual blur and ringing metrics: application to JPEG2000, Signal Process.-Image Commun., 19, 163–172, doi:10.1016/j.image.2003.08.003, 2004.
Vehi-cle (UAV) Collected High Density Structure from Motion Point Cloud, Remote Sensing, 5, 2164–2183, doi:10.3390/rs5052164, 2013.
Meyer, G. E. and Neto, J. C.: Verification of color vegetation indices for automated crop imaging applications, Comput. Electron. Agr., 63, 282–293, doi:10.1016/j.compag.2008.03.009, 2008. Naccari, M.: Blur_metric script, available at: https://sites.google.
com/site/matteonaccari/software (last access November 2014), 2011.
Stevens, A.: Arcgridwrite matlab script, available at: http://www.mathworks.com/matlabcentral/fileexchange/ 16176-arcgridwrite/content/arcgridwrite.m (last access: Novem-ber 2014), 2007.
Westoby, M. J., Brasington, J., Glasser, N. F., Hambrey, M. J., and Reynolds, J. M.: “Structure-from-Motion” photogrammetry: A low-cost, effective tool for geoscience applications, Geomor-phology, 179, 300–314, doi:10.1016/j.geomorph.2012.08.021, 2012.
Wu, C.: Towards linear-time incremental structure from motion, In-ternational Conference on 3D vision publication (3DV Confer-ence, Seattle, WA, USA, June 2013), 127–134, 2013.