www.clim-past.net/6/295/2010/ doi:10.5194/cp-6-295-2010
© Author(s) 2010. CC Attribution 3.0 License.
Climate
of the Past
Patterns of millennial variability over the last 500 ka
M. Siddall1, E. J. Rohling2, T. Blunier3, and R. Spahni4 1Department of Earth Science, University of Bristol, Bristol, UK 2National Oceanography Centre, Southampton, Southampton, UK
3Centre for Ice & Climate, Niels Bohr Institute, University of Copenhagen, Copenhagen, Denmark
4Climate and Environmental Physics and Oeschger Centre for Climate Change Research, University of Bern,
Bern, Switzerland
Received: 14 January 2010 – Published in Clim. Past Discuss.: 29 January 2010 Revised: 13 April 2010 – Accepted: 22 April 2010 – Published: 5 May 2010
Abstract. Millennial variability is a robust feature of many paleoclimate records, at least throughout the last several glacial cycles. Here we use the mean signal from Antarctic climate events 1 to 4 to probe the EPICA Dome C tempera-ture proxy reconstruction through the last 500 ka for similar millennial-scale events. We find that clusters of millennial events occurred in a regular fashion over half of the time dur-ing this with a mean recurrence interval of 21 kyr. We find that there is no consistent link between ice-rafted debris de-position and millennial variability. Instead we speculate that changes in the zonality of atmospheric circulation over the North Atlantic form a viable alternative to freshwater release from icebergs as a trigger for millennial variability. We sug-gest that millennial changes in the zonality of atmospheric circulation over the North Atlantic are linked to precession via sea-ice feedbacks and that this relationship is modified by the presence of the large, Northern Hemisphere ice sheets during glacial periods.
1 Introduction
(Background) Ice-core proxy records of high latitude North-ern Hemisphere temperature reveal a distinctive pattNorth-ern of re-peated rapid warming events of 8–15◦C during Marine Iso-tope Stage 3 (MIS 3), known as Dansgaard-Oeschger (D-O) events (Dansgaard et al., 1984, 1993; Oeschger et al., 1984). These rapid warmings are interspersed with cold pe-riods such that MIS 3 is a period of substantial millennial-scale climate variability. This variability is found throughout much of the Northern Hemisphere in marine sediments and also continental records (Shackleton et al., 2000; Wang et al., 2001; Voelker et al., 2002; Rohling et al., 2003; Denton
Correspondence to: M. Siddall
et al., 2005). D-O events in MIS 3 appear in groups with a longer warm period followed by several shorter warm peri-ods, interspersed with cold periods (Bond and Lotti, 1995). These D-O groups, sometimes called Bond cycles, end in a cold culmination, expressed as a so-called Heinrich event of massive ice-rafted debris (IRD) deposition in the North Atlantic between about 40 and 50◦N (see overview in Hem-ming, 2004). Such indications of substantial iceberg release have motivated modelling studies which consider freshwater pulses into the North Atlantic as a trigger for rapid cooling during D-O variability (Stocker and Wright, 1992).
Blunier et al. (1998) and Blunier and Brook (2001) used variations in the concentration of atmospheric methane (a globally well-mixed gas) in air bubbles enclosed within the ice, to synchronise ice-core records from Antarctica and Greenland. This work showed that D-O events correspond to slower, smaller changes in Antarctica. Longer D-O sta-dials in Greenland correspond to the largest variations in Antarctic temperature (Antarctic events A1 to A4) (Stocker and Johnsen, 2003). High-resolution temperature reconstruc-tions from Antarctic ice cores have confirmed that shorter D-O events are also associated with smaller Antarctic ing events and that the magnitude of the Antarctic warm-ing is proportional to the duration of D-O stadial events (EPICA Community members, 2006). This paper is con-cerned with the larger Antarctic climate events, correspond-ing to the longer D-O stadials durcorrespond-ing MIS 3.
lantic, causing rapid cooling in Greenland and gradual warm-ing in Antarctica. In this way it is suggested that coolwarm-ing dur-ing D-O stadials, plausibly caused by iceberg release also af-fects Antarctic temperature (Hemming, 2004). Here we con-sider the link between IRD deposition in the north Atlantic and the larger Antarctic climate events over the last 500 kyr.
Although millennial-scale variability has been predomi-nantly found in high-resolution records of MIS 3, some evi-dence for it exists also in earlier intervals (Oppo et al., 1998; McManus et al., 1999). Larrasoa˜na et al. (2003) found that the occurrence of sub-Milankovitch (or sub-orbital) variabil-ity became significant from as early as∼0.95 Ma. A study of millennial events recorded in the Vostok ice core has sug-gested that broadly similar north-south phase relationships to those of MIS 3, as described in Stocker and Johnsen (2003), existed over the last four climatic cycles (Delmotte et al., 2004). Siddall et al. (2006, 2007) described very simi-lar millennial-scale relationships between temperature recon-structions in the Vostok ice core, methane concentrations and a simple model of the bipolar seesaw during MIS 8, com-pared to MIS 3. Cave speleothem records have revealed millennial-scale variability within the last several glacial cy-cles, which is similar in appearance to that of MIS 3 (Bar-Matthews et al., 2003; Yuan et al., 2004).
Several authors have suggested that millennial-scale cli-mate variability is a function of ice volume, relating periods of more intense variability to periods with increases ice vol-ume (Oppo et al., 1998; McManus et al., 1999; Siddall et al., 2006, 2007). Other work has found millennial variability during periods with reduced ice volume (Martrat et al., 2007; Desprat et al., 2009). Most recently Ganopolski et al. (2009) have linked episodes of millennial variability to the complex phase relationships between Antarctic temperature and atmo-spheric CO2concentrations during the terminations,
requir-ing millennial variability durrequir-ing periods of reduced ice vol-ume.
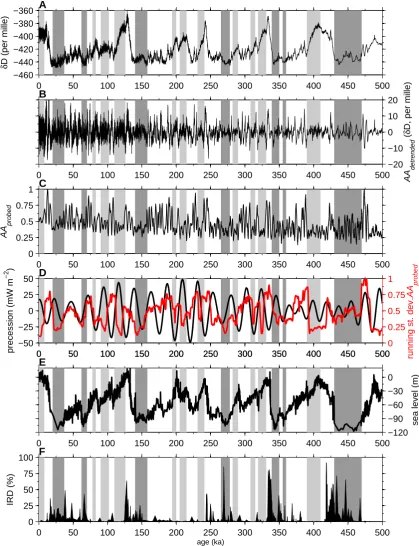
Ice core records from Antarctica extend down to 800 ka BP (EPICA Community Members 2004), although adequate res-olution to consider millennial changes only exists for the last 500 kyr. New, multi-century resolution sea-level data from the Red Sea extend down to 500 ka BP (Rohling et al., 2009). Combined with IRD data from the north Atlantic (Oppo et al., 1998; McManus et al., 1999), these data allow a sys-tematic analysis of millennial climate variability over the last 500 kyr (Fig. 1). Here we take a simple approach to analysing millennial variability over the last 500 kyr using these records. Although 800 kyr of data is available from the EPICA Dome C (EDC) ice core, we consider only the last 500 kyr for several reasons: (i) Red Sea sea-level and north Atlantic IRD data only extend to the last 500 kyr and we compare our results to these and; (ii) the resolution of the EDC deuterium record deteriorates with depth and millennial comparison is not possible much beyond 500 kyr ago.
Our method is simple but effective. Essentially we take a representative A-event (in this case the mean of A-events 1 to 4) from the MIS 3 section from the EDC ice core record as recorded in the deuterium temperature proxy, and look for similar events in the rest of the EDC record. We further vali-date our results by carrying out a series of Fast Fourier Trans-forms with overlapping windows (known as a spectrogram analysis) in addition. Our approach consists of five steps:
1. Removing the long-term trend from the EDC record We first treat the last 500 kyr of EDC deuterium data on the EDC3 time scale to remove the 6 kyr trend (Fig. 1a). We achieve this by carrying out least-square linear re-gressions on 6 kyr windows centered on each data point in turn and removing the temperature trend. We will call the detrended, evenly sampled EDC deuterium record
AAdetrended (Fig. 1b). The window length of 6 kyr is
chosen to effectively remove the trend during the glacial terminations. Sensitivity tests varying the length of this 6 kyr window by a factor of two (between 3 ky and 12 kyr) show no impact on our results.
2. Defining the probe signal
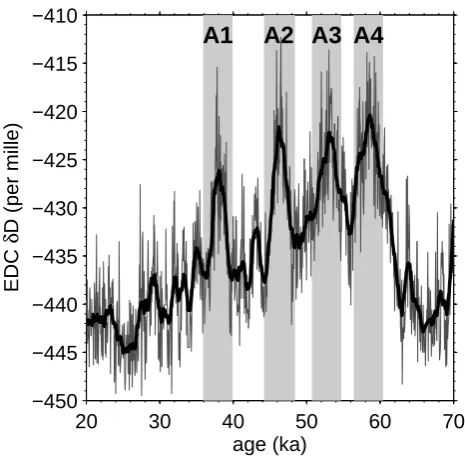
We define an average A-event and use this event to probe the rest of the signal to look for similar events. To define an average A-event we took 4 kyr windows centered around 37.9, 46.2, 52 and 58.4 kyr ago rep-resenting A-events 1 to 4, respectively (Fig. 2). The four windows were overlain around their centres and the probe signal constructed by binning the combined data using the mean over 0.1 kyr intervals. Although, in the example given here we have used an average A-event, we could have used any of the four events individually because our result is not sensitive to which of the MIS 3 A-events we use. We will call the probe signalAmean.
3. Probing AAdetrendedwithAmean
We compare AAdetrended withAmean by calculating the
standard difference between AAdetrendedandAmean for
overlapping windows separated by 0.1 kyr The standard difference is then normalised to its greatest value over the last 500 kyr. We call this result AAprobed(Fig. 1c).
4. Calculate the standard deviation of AAprobedover 8 kyr
windows
Finally, because AAprobedis sensitive to both the
pres-ence of, and the phase of, millennial variability simi-lar to that of A2, it exhibits both low (in phase) and high (out of phase) values during periods of millennial variability. Contrastingly, AAprobedshows little variation
0 50 100 150 200 250 300 350 400 450 500 −460
−440 −420 −400 −380 −360
δ
D (per mille)
A
0 50 100 150 200 250 300 350 400 450 500
−20 −10 0 10 20
AA
detrended
(
δ
D, per mille)
B
0 50 100 150 200 250 300 350 400 450 500
0 0.25 0.5 0.75 1
AA
probed
C
0 50 100 150 200 250 300 350 400 450 500
−50 −25 0 25 50
precession (mW m
−2
)
D
0 50 100 150 200 250 300 350 400 450 500
0 0.25 0.5 0.75 1
running st. dev.
AA
probed
0 50 100 150 200 250 300 350 400 450 500
−120 −90 −60 −30 0
sea level (m)
E
0 50 100 150 200 250 300 350 400 450 500
0 25 50 75 100
IRD (%)
age (ka) F
Fig. 1. Data and results discussed in the text (see text for full details). (A) EPICA Dome C deuterium data (EPICA Community members
2004) on the EDC3 time scale. (B) AAdetrended, which is the EPICA Dome C deuterium data with the trend removed across 6 kyr windows.
(C) AAprobed, which is the standard residual between AAdetrendedandAmeannormalised to the maximum value over the last 500 kyr. Periods
with alternating high and low values represent periods of millennial variability similar toAmean. (D) The standard deviation of AAprobed
over 8 kyr windows overlapped by 0.1 kyr. High values show periods of intense millennial variability similar toA2smooth, low values show
20 30 40 50 60 70 −450
−445 −440 −435 −430 −425 −420 −415 −410
A1
A2 A3 A4
EDC
δ
D (per mille)
age (ka)
Fig. 2. MIS 3 in the EPICA Dome C deuterium record (grey line).
Also shown is the record smoothed with a Gaussian window of length 1 kyr (thick black line). Vertical grey bars centered at 37.9, 46.2, 52 and 58.4 ka representing A-events 1 to 4, respectively.
This result is normalised by the maximum standard de-viation over the 500 kyr study period. The output of this calculation (Fig. 1d) is simple to interpret because where the standard deviation of AAprobed is high, the
record contains millennial signals similar toAmean.
5. Validation using a spectrogram analysis
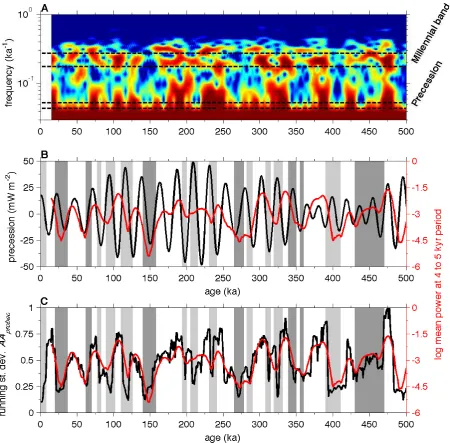
Because of the novelty of our approach, we have also carried out a more routine spectral analysis of
AAsmoothed using FFTs over 30 kyr windows with a
29.999 kyr overlap standard. The resulting spectrogram is shown in Fig. 3a, where the millennial band (3 to 5 kyr period) is highlighted. By taking the mean of the spectrogram within this millennial window of 3 to 5 kyr period, we produce a time series of the mean spec-tral power in this band. This is compared to precession forcing in Fi. 3b and the running standard deviation of
AAprobed in Fig. 3c. We note that the two approaches
in Fig. 3c give a very similar result, confirming that our result is not dependent on our novel approach.
3 Results
The results of our analysis are given in Fig. 1, where they are also compared to the Red Sea sea-level reconstruction and the IRD record of ODP 980 from the north Atlantic. The results are repeated in Fig. 3, where they are compared to our spectrogram results.
lar to that of MIS 3 is repeated throughout the last 500 kyr in the EDC deuterium record (high values in Figs. 1d and 3 and Table 1). Periods of increased variability occur with striking regularity throughout the last 500 kyr. Far from being un-usual events, they intermittently occupy approximately half of the record of the last 500 kyr.
In order to compare our results with reconstructions of ice volume, we plot the Red Sea sea-level curve (Fig. 1e). Clus-tering of millennial-scale variability is found to occur during two distinct phases within the glacial cycles, namely during periods of intermediate ice volume and extensive IRD de-position and during glacial terminations (including the early parts of interglacials) (Fig. 1e, f and Table 1). Conversely, millennial-scale variability also appears to be absent during two distinct phases within the glacial cycles, namely during periods of extensive ice-sheet growth (marked with light grey bars in Fig. 1 and referenced to periods of sea-level fall in Fig. 1e), and during glacial maxima with more than 80 m of sea-level equivalent ice volume (marked with dark grey bars in Fig. 1 and noted in Table 1).
Over the last 500 kyr, we observe twenty-four clusters of increased/decreased millennial-scale variability. These clus-ters are typically separated according to a “cycle” of∼21 kyr, a value similar to that of precession. However, the rela-tionship between precession and millennial variability is not simple. Precession is generally in phase with the presence of millennial variability during periods of intermediate ice volume (40 to 80 m sea-level equivalent) and in antiphase during periods of reduced ice volume (40 m or less sea-level equivalent) (Figs. 1d, e, f, 3 and Table 1). Between periods when clusters of millennial variability are in and out of phase with precession, there are transition intervals when preces-sion leads the millennial variability.
4 Discussion
Previous work has pointed out the links between millennial-scale variability and intermediate ice volume of around 40 to 80 m ice volume equivalent (e.g. Oppo et al., 1998; Mc-Manus et al., 1999; Siddall et al., 2007). Other work has sug-gested that the link between millennial-scale variability and ice volume may be less important (Martrat et al., 2007; De-sprat et al., 2009). Yet other work has focused on the role of millennial-scale variability in glacial terminations (Ganopol-ski et al., 2009).
Fig. 3. Alternative analysis using a windowed FFT or spectrogram technique. (A) Spectrogram of AAdetrendedusing a 30 kyr window with a 29.999 kyr overlap. Dashed lines show precession (19 and 23 kyr period) and the millennial band (4 to 5 kyr period). (B) The natural log of the mean power in the spectrogram with a period between 3 and 5 kyr. Precession forcing from Berger and Loutre (1991) is shown for
comparison. (C) The standard deviation of AAprobedover 8 kyr windows overlapped by 0.1 kyr and the natural log of the mean power in the
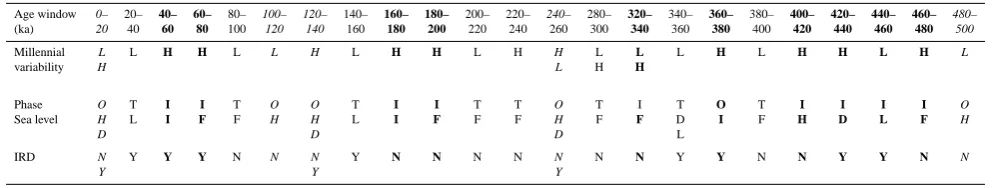
Table 1. A qualitative comparison of millennial variability, phase with respect to precession, ice volume (sea level) and IRD. These estimates
are based on Fig. 1.
Age window 0– 20– 40– 60– 80– 100– 120– 140– 160– 180– 200– 220– 240– 280– 320– 340– 360– 380– 400– 420– 440– 460– 480–
(ka) 20 40 60 80 100 120 140 160 180 200 220 240 260 300 340 360 380 400 420 440 460 480 500
Millennial L L H H L L H L H H L H H L L L H L H H L H L
variability H L H H
Phase O T I I T O O T I I T T O T I T O T I I I I O
Sea level H L I F F H H L I F F F H F F D I F H D L F H
D D D L
IRD N Y Y Y N N N Y N N N N N N N Y Y N N Y Y N N
Y Y Y
Millennial variability: H=high, L=low
Phase with respect to precession: O=out of phase, T=transition, I=in phase Sea level: H=high, L=low, D=deglaciation, F=falling
IRD: Y=yes, N=no
similarity between both classes of millennial-scale events in the EPICA Dome C deuterium records suggests that both classes reflect the same processes.
If millennial-scale variability exists for approximately half of the time during the last 500 kyr, then there is an equally important reverse question: “What characterises periods which have reduced millennial variability or for which mil-lennial variability is absent?” In Fig. 1 these periods are characterized by either ice volumes greater than∼80 m ice-volume equivalent or periods of sustained ice sheet growth. Many authors have shown evidence for millennial-scale sea-level fluctuations associated with millennial-scale climate variability during MIS 3 (Chappell 2002; Cutler et al., 2003; Siddall et al., 2003, 2008; Rohling et al., 2008; Arz et al., 2007). We suggest that sustained ice-sheet growth requires the absence of millennial variability to allow the continuous growth of ice sheets, rather than the growth and collapse of ice sheets during periods such as MIS 3. The lack of millen-nial variability at the glacial maxima may be evidence that the presence of the large ice sheets issues in a relatively sta-ble climate during those periods.
Given that only one of our classes of millennial-scale event is linked with IRD deposition, we infer that massive iceberg calving may not be the ultimate cause of millennial variabil-ity. We note that IRD events only last several centuries (less than D-O stadials, which last 1–2 kyr) and peak at the con-clusion of D-O stadials (Hemming, 2004). This suggests that IRD events are caused by the D-O stadials, rather than being the cause of D-O stadials. Hence, IRD deposition (iceberg calving) does not appear to be the driving mechanism, but merely a feature of the class of millennial-scale variability that occurs during periods of intermediate ice volume.
The above implies that another causative mechanism is re-quired to explain D-O variability. Because the recurrence interval of clusters of millennial variability is close to preces-sion any discuspreces-sion of processes explaining millennial
vari-ability needs to consider precession forcing. It has been sug-gested that changes in the zonality of atmospheric circula-tion over the North Atlantic might instead be the cause of millennial variability by switching the latitude of the polar front between different modes (Seager et al., 2002; Seager and Battisti, 2007). As noted above, the mean recurrence-period of clusters of millennial-scale variability in Fig. 1c,d is 21 kyr, similar to precession. This implies that changes in the zonality of atmospheric circulation over the North At-lantic may be linked to precessional cycles. In turn this implies zonal teleconnections in the Northern Hemisphere. Such links are indeed suggested by Wang et al. (2008) who found both strong precessional and millennial variability in Chinese speleothem records.
In order to consider the possible link between precession forcing and the occurrence of millennial variability, we com-pare our result with precession forcing in Fig. 1d. Clusters of millennial variability are in phase with precession during periods of intermediate ice volume but alter phase during glacial maxima (when there is little or no millennial vari-ability). Clusters of millennial variability then remain in an-tiphase during the glacial termination and periods of reduced ice volume. During the transition from reduced to interme-diate ice volume the phase realigns again to put the reoccur-rence of millennial variability back in phase with precession forcing. Marked changes to the atmospheric circulation due to the presence of large ice sheets and extended sea ice at the Last Glacial Maximum (LGM) have been found in atmo-spheric models (e.g. Li and Battisti, 2008). Otto-Bliesner et al. (2006) also found that atmospheric circulation was sensi-tive to the detailed configuration of the north American ice sheets at the LGM.
In summary, we speculate that the existence of ice sheet topography and albedo effects modifies the influence of pre-cession forcing on millennial variability and that this may explain the existence of two classes of millennial variabil-ity. One class of millennial variability is linked to precession forcing, the other class requires precession forcing modified by the existence of ice sheets of intermediate size. Because precession forcing affects how much insolation an entire hemisphere receives in a certain season, precession may be an important driver of changes in seasonal sea ice. We there-fore suggest that sea-ice feedbacks are the most likely candi-date for linking millennial variability to precession forcing.
5 Conclusions
It is clear from our analysis that millennial-scale variabil-ity is a much more common feature of Quaternary climate than has hitherto been realised, taking up a significant pro-portion of the variability during periods of intermediate ice-sheet growth and glacial terminations.
Millennial variability occurs during distinct periods in the glacial cycles, namely periods with ice volume equivalent to 40–80 m of sea-level lowering, and glacial terminations.
Different periods give rise to the absence of millennial variability, namely periods of extensive ice-sheet growth, and periods with ice volume equivalent to more than 80 m of sea-level lowering.
The lack of a unique relationship between ice volume and millennial-scale variability calls for a causative mechanism other than iceberg release into the north Atlantic. We suggest that changes in the zonality of atmospheric circulation over the North Atlantic may be a viable alternative (Seager et al., 2002; Seager and Battisti, 2007). Because we find the mean recurrence-period of the millennial-scale variability clusters to be∼21 kyr, we suggest that changes in the zonality of at-mospheric circulation over the North Atlantic may be linked
to precession. Because the phase relationship between pre-cession forcing and clusters of millennial variability changes over the glacial cycle, we suggest that the existence of ice sheets modifies the influence of precession forcing on mil-lennial variability. This suggestions is supported by Chinese speleothem records, which show strong precessional and mil-lennial variability over the last two glacial cycles, indicating important changes in the zonality of atmospheric circulation on these time scales (Wang et al., 2008).
If millennial variability requires preconditions with re-spect to precessional forcing, it is unlikely to occur due to natural forcing for some thousands of years from now. Acknowledgements. Mark Siddall is supported by an RCUK
research fellowship. This work has been greatly helped by
interactions taking place within the PALSEA working group, which is funded by PAGES and IMAGES. EJR acknowledges support from NERC projects NE/C003152/1, NE/E01531X/1, and NE/H004424/1.
Edited by: T. Kiefer
The publication of this article was sponsored by PAGES.
References
Arz, H. W., Lamy, F., Ganopolski, A., Nowaczyk, N., and P¨atzold, J.: Dominant Northern Hemisphere climate control over millennial-scale glacial sea-level variability, Quat. Sci. Rev., 26(3–4), 312–321, doi:10.1016/j.quascirev.2006.07.016, 2007. Ashkenazy, Y. and Tziperman, E.: A Wind-Induced
Thermoha-line Circulation Hysteresis and Millennial Variability Regimes, J. Phys. Oceanog., 37(10), 2446–2457, 2007.
Berger, A. and Loutre, M. F.: Insolation values for the climate of the last 10 million years. Quat. Sci. Rev., 10, 297–317, 1991. Bar-Matthews, M., Ayalon, A., Gilmour, M., Matthews, A., and
Hawkesworth, C. J.: Sea-land oxygen isotopic relationships from planktonic foraminifera and speleothems in the Eastern Mediter-ranean region and their implication for paleorainfall during in-terglacial intervals, Geochim. Cosmochim. Acta, 67(17), 3181– 3199, 2003.
Blunier, T. and Brook, E.: Timing of millennial-scale climate change in Antarctica and Greenland during the last glacial pe-riod, Science, 291, 109–112, doi:10.1126/science.291.5501.109, 2001.
Blunier, T., Chappellaz, J., Schwander, J., D¨allenbach, A., Stauffer, B., Stocker, T., Raynaud, D., Jouzel, J., Clausen, H. B., Ham-mer, C. U., and Johnsen, S. J.: Asynchrony of Antarctica and Greenland climate during the last glacial, Nature, 394, 739–743, 1998.
Bond, G. C. and Lotti, R.: Iceberg discharges into
the North-Atlantic on millennial time scales during
the last glaciation, Science, 267(5200), 1005–1010,
Glacial Cycle: New results from coral terraces, Quat. Sci. Rev., 21(10), 1229–1240, doi:10.1016/S0277-3791(01)00141-X, 2002.
Crowley, T. J.: North Atlantic deep water cools the Southern Hemi-sphere, Paleoceanography, 7, 489–497, 1992.
Cutler, K. B., Edwards, R. L., Taylor, F. W., Cheng, H., Adkins, J., Gallup, C. D., Cutler, P. M., Burr, G. S., and Bloom, A. L.: Rapid sea-level fall and deep-ocean temperature change since the last interglacial period, Earth Planet. Sci. Lett., 206(3–4), 253–271, doi:10.1016/S0012-821X(02)01107-X, 2003.
Dansgaard, W., Johnsen, S. J., Clausen, H. B., Dahl-Jensen, D., Gundestrup, N., Hammer, C. U., and Oeschger, H.: North Atlantic climatic oscillations revealed by deep Greenland ice cores, in: Climate Processes and Climate Sensitivity, edited by: Hansen, J. E. and Takahashi, T., Geophys. Monogr. Ser., 29, 1984.
Dansgaard, W., Johnsen, S. J., Clausen, H. B., Dahl-Jensen, D., Gundestrup, N. S., Hammer, C. U., Hvidberg, C. S., Steffensen, J. P., Sveinbjornsdottir, A. E., Jouzel, J., and Bond, G.: Evi-dence for general instability of past climate from a 250-ka ice-core record, Nature, 364, 218–220, 1993.
Delmotte, M., Chappellaz, J., Brook, E., Yiou, P., Barnola, J. M., Goujon, C., Raynaud, D., and Lipenkov, V. I.: Atmospheric methane during the last four glacial-interglacial cycles: Rapid changes and their link with Antarctic temperature, J. Geophys. Res., 109, D12104, doi:10.1029/2003JD004417, 2004.
Denton, G. H., Alley, R. B., Comer, G. C., and Broecker, W. S.: The role of seasonality in abrupt climate change, Quat. Sci. Rev., 24(10–11), 1159–1182, doi:10.1016/j.quascirev.2004.12.002, 2005.
Desprat, S., S´anchez Go˜ni, M. F., McManus, J. F., Duprat, J., and Cortijo, E.: Millennial-scale climatic variability between 340 000 and 270 000 years ago in SW Europe: evidence from a NW Iberian margin pollen sequence, Clim. Past, 5, 53–72, 2009, http://www.clim-past.net/5/53/2009/.
EPICA Members: Eight glacial cycles from an Antarctic ice core, Nature, 429, 623–628, 2004.
EPICA Community Members: One-to-one interhemispheric cou-pling of polar climate variability during the last glacial, Nature, 444, 195–198, doi:10.1038/nature05301, 2006.
Friedrich, T., Timmermann, A., Timm, O., Mouchet, A., and Roche, D. M.: Orbital modulation of millennial-scale climate variability in an earth system model of intermediate complexity, Clim. Past Discuss., 5, 2019–2051, 2009,
http://www.clim-past-discuss.net/5/2019/2009/.
Ganopolski, A. and Roche, D.: On the nature of lead-lag relation-ships during glacial-interglacial climate transitions, Quat. Sci. Rev., 37/38, 3361–3378, doi:10.1016/j.quascirev.2009.09.019, 2009.
Hemming, S. R.: Heinrich events: Massive late Pleistocene detritus layers of the North Atlantic and their global climate imprint, Rev. Geophys., 42, RG1005, doi:10.1029/2003RG000128, 2004.
Kaspi, Y., Sayag, R., and Tziperman, E.: A “triple sea-ice
state” mechanism for the abrupt warming and synchronous ice sheet collapses during Heinrich events, Paleoceanography, 19(3), PA3004, doi:10.1029/2004PA001009, 2004.
Larrasoa˜na, J. C., Roberts, A. P., Rohling, E. J., Winklhofer, M., and Wehausen, R.: Three million years of monsoon variability
Li, C. and Battisti, D. S.: Reduced Atlantic stormines during the Last Glacial Maximum: Evidence from a coupled climate model, J. Climate, 21, 3561–79, 2008.
Li, C., Battisti, D. S., Schrag, D. P. and Tziperman, E.: Abrupt cli-mate shifts in Greenland due to displacements of the sea ice edge, Geophys. Res. Lett., 32, L19702, doi:10.1029/2005GL023492, 2005.
Martrat, B., Grimalt, J. O., Shackleton, N. J., de Abreu, L., Hut-terli, M. A. and Stocker, T. F.: Four climate cycles of recurring deep and surface water destabilizations on the Iberian Margin, Science, 317, 502–507, 2007.
McManus, J. F., Oppo, D. W., and Cullen, J. L.: A 0.5 million-year record of millennial-scale climate variability in the North Atlantic, Science, 283(5404), 971–975, doi:10. 1126/ sci-ence.283.5404.971, 1999.
Oeschger, H., Beer, J., Siegenthaler, U., Stauffer, B., Dansgaard, W., and Langway, C. C.: Late glacial climate history from ice cores, in: Climate Processes and Climate Sensitivity, edited by: Hansen, J. E. and Takahashi, T., Geophysical Monograph Series, 29, AGU, Washington, DC, USA, 299–306, 1984.
Oppo, D. W., McManus, J. F., and Cullen J. L.: Abrupt climate events 500,000 to 340 000 years ago: Evidence from subpo-lar north Atlantic sediments, Science, 279(5355), 1335–1338, doi:10.1126/science.279.5355.1335, 1998.
Otto-Bliesner, B. L., Brady, E. C., Clauzet, G., Tomas, R., Levis, S., and Kothavala, Z.: Last Glacial Maximum and Holocene Climate in CCSM3, J. Climate, 19, 2526–2544, 2006.
Rohling, E. J., Mayewski, P. A., and Challenor, P.: On the timing and mechanism of millennial-scale climate variability during the last glacial cycle, Clim. Dyn., 20, 257–267, 2003.
Rohling, E. J., Grant, K., Hemleben, C., Kucera, M., Roberts, A. P., Schmeltzer, I., Schulz, H., Siccha, M., Siddall, M., and Trommer, G.: New constraints on the timing of sea level fluctuations during early to middle marine isotope stage 3, Paleoceanography, 23, PA3219, doi:10.1029/2008PA001617, 2008.
Rohling, E. J., Grant, K., Bolshaw, M., Roberts, A.P., Siddall M., Hemleben C., and Kucera M.: Antarctic temperature and global sea level closely coupled over the past five glacial cycles, Nat. Geosci., 2, 500–504, 2009.
Seager, R., Battisti, D. S., Yin, J., Naik, N., Gordon, N., Clement, A. C., and Cane, M.: Is the Gulf Stream responsible for Europe’s mild winters? Q. J. R. Meteo. Soc., 128, 2563–86, 2002. Seager, R. and Battisti, D. S.: Challenges to our understanding of
the general circulation: Abrupt climate change, in: Global Cir-culation of the Atmosphere, edited by: Schneider, T. and Sobel, A. H., 331–371, Princeton Univ. Press, Princeton, 2007. Shackleton, N. J., Hall, M. A., and Vincent, E.: Phase relationships
between millennial-scale events 64 000–24 000 years ago, Pale-oceanography, 15, 565–569, doi:10.1029/2000PA000513, 2000. Siddall, M., Rohling, E. J., Almogi-Labin, A., Hemleben, C., Meis-chner, D., Schmelzer, I., and Smeed, D. A.: Sea-level fluc-tuations during the last glacial cycle, Nature, 423, 853–858, doi:10.1038/nature01690, 2003.
Siddall, M., Stocker, T. F., Spahni, R., Blunier, T., McManus,
J. F., and Bard, E.: Using a maximum simplicity
Siddall, M., Stocker, T. F., Blunier, T., Spahni, R., Schwander, J., Barnola, J.-M., and Chappellaz, J.: Marine Isotope Stage (MIS) 8 millennial variability stratigraphically identical to MIS 3, Pale-oceanography, 22, PA1208, doi:10.1029/2006PA001345, 2007. Siddall, M., Rohling, E. J., Thompson, W. G., and Waelbroeck, C.:
MIS 3 Sea-level fluctuations: data synthesis and new outlook, Rev. Geophys., 46, RG4003, doi:10.1029/2007RG000226, 2008. Stocker, T. F. and Johnsen, S. J.: A minimum thermodynamic model for the bipolar seesaw, Paleoceanography, 18(4), 1087, doi:10.1029/2003PA000920, 2003.
Voelker, A. H. L.: Global distribution of centennial-scale records for marine isotope stage (MIS) 3: A database, Quat. Sci. Rev., 21(10), 1185–1212, doi:10.1016/S0277-3791(01)00139-1, 2002.
Wang, Y. J., Cheng, H., Edwards, R. L., An, Z. S., Wu, J. Y., Shen, C. C., and Dorale, J. A.: A high-resolution absolute-dated Late Pleistocene monsoon record from Hulu Cave, China, Science, 294(5550), 2345–2348, doi:10.1126/science.1064618, 2001. Wang, Y. J., Cheng, H., Edwards, R. L., Kong, X. G., Shao, X. H.,
Chen, S. T., Wu, J. Y., Jiang, X. Y., Wang, X. F. and An, Z. S.: Millennial- and orbital-scale changes in the East Asian monsoon over the past 224 000 years, Nature, 451, 1090–1093, 2008. Yuan, D., Cheng, H., Edwards, R. L., Dykoski, C. A., Kelly, M.