~ 125 ~ WWJMRD 2017; 3(7): 125-131
www.wwjmrd.com Impact Factor MJIF: 4.25 e-ISSN: 2454-6615
Heavendeep Kaur Department of Computer Science and Engineering, Guru Kashi University, Talwandi Sabo, India
Dr. Sandeep Kautish Department of Computer Science and Engineering, Guru Kashi University, Talwandi Sabo, India
Correspondence: Heavendeep Kaur Department of Computer Science and Engineering, Guru Kashi University, Talwandi Sabo, India
Stock data prediction using predictive data mining
techniques
Heavendeep Kaur, Dr. Sandeep Kautish
Abstract
Prediction system of stock market is very crucial and essentially important because it deals with the huge amount of money and in today‟s growing and forward time, money is the first priority. The predicted value directly affects the stock price and no one take risk to drop down in stock market index. So due to money involvement and the reputation of the shares, stock market needs to be a perfect or more accurate prediction about their upcoming market trends. Various machine learning algorithms are used for stock data set and the objective is to predict the stock market. In this research work multiple learning algorithms with NN and ensembling methods are used to predict the data from unauthorized users. To calculate True positive rate (TPR), false positive rate (FPR), Area under the curve (AUC) and accuracy parameters and compare the previous result with new results.
Keywords: FPR, AUC, TPR, Data, Prediction
Introduction
Stock market is the bone of fast emerging economies such as India. Major of capital infusion for companies across the country was made possible only through shares sold to people. So our country growth is tightly bounded with the performance of our stock market. Almost all the developing nations rely on their stock market for further strengthening of their economy. Any way in developing economies less than 10% of people are engaging themselves with stock market investment fearing the volatile nature of stock market. Many people felt that buying and selling of shares is an act of gambling which is a wrong notion. Majority of financial researchers agree that stock market is the only place where investor are getting consistent inflation beaten returns for so many years. Considering the fact of lack of knowledge and awareness across the people stock market prediction techniques plays a very crucial role in bringing more people into market as well as to retain the existing investors. Also the prediction techniques must be treated like astrology or gambling. The applied techniques must yield consistent accurate results with certain level of accuracy always in order change the mindset of passive investors. By examining the literature stock market prediction techniques can be grouped into four types [5].
1) Technical analysis approach, 2) Fundamental analysis approach, 3) Time series prediction and
4) Machine learning algorithmic methods.
Role of Data Mining
Many researchers attempts to predict stock prices by applying statistical and charting approaches. But those methods lacks behind heavily due to human biased decisions on stock market based on day to day mind set of human behaviour. By applying data mining in suitable way hidden patterns can be uncovered which was not possible by traditional approaches. Also by applying business intelligence, future price prediction with increasing accuracy levels are possible with data mining techniques. The huge amount of data generated by stock markets forced the researchers to apply data mining to make investment decisions. The following challenges of stock market can be effectively addressed by mining techniques [1] [4].
1. Future stock price prediction
2. 2) To generate effective patterns of past data for further analysis.
~ 126 ~
3. To optimally utilize the capital of shareholders. 4. For the growth of country economy.
5. To bring more investors to stock market who are lacking in analysis.
6. To stabilize the market.
7. To increase transparency in the market. 8. To check corruptive practices [5].
9. To bring more lazy and tech savvy investors into market.
All variants of prediction techniques can be classified in to five significant types:
Technical charting approach Variable model
Fundamental analysis approach
Machine learning algorithm based methods Time series prediction
Technical charting approach
The charting approach is basically categorized as technical approach. It deals with voluminous historical data of stock prices of the concerned stocks [6].
Variable Model
This approach is working on examining the selected parameters analysis to predict the future price of stocks.
Fundamental analysis approach
This approach is alternately referred as true or real price prediction which primarily focuses on fundamentals of the company instead of price movement. It gives weightage to true value prediction instead of current price movement.
Machine learning algorithms
This method attempts to predict the movement of stock prices based on training given with the past value movements.
Time Series analysis
This method considers the time as important parameter to generate series of stock price movement.
Significance of Data mining for Stock price predictions: Several works are done to predict stock price movements based on charting historical values. Many of them failed to deliver promising results since it cannot accommodate the actual movement. The data mining techniques can address such issues. The hidden patterns can be discovered by applying data mining pattern matching techniques. It serves as the preliminary stage for gathering business information to estimate future needs. Many of the conventional methods failed to deliver in this issue[6]. Data mining techniques effectively addresses the challenges in which the traditional methods failed to deliver promising results. Some of them are:
Stock price prediction
Pattern generation with historical data Effective utilization of business capital The economic development
Investor friendly analysis
Feature Selection
In order to estimate the possible influence of each of the above attributes on the predicted turnover, Boruta
algorithm in R tool [15] was used. Boruta is a machine learning algorithm used to find relevant and important features for a given dataset i.e. used to solve the minimal-optimal problem. The minimal-minimal-optimal problem is an often found situation today where most of the variables in a dataset are irrelevant to its classification. This problem gives rise to various disadvantages including over consumption of resources, slowdown of machine learning algorithms and most importantly, decrease in accuracy yielded by the same. Additionally, Boruta is a wrapper algorithm built around the Random Forest algorithm (implemented in the R package Random Forest) such that in every iteration the algorithm removes the irrelevant or less important features or attributes on the basis of the results rendered by a series of statistical tests.
The Boruta algorithm follows the following steps:
The information system is expanded by adding duplicates of all attributes. These duplicates are known as shadow attributes.
The added attributes are shuffled and the randomForest algorithm is run on the expanded information system. The resultant Z scores are noted. The Z score of every attribute is considered and the
maximum Z score among all the shadow attributes (MZSA) is estimated. Further a hit value is assigned
to every attribute that possesses a Z score better than MZSA.
For each shadow attribute with undetermined importance perform a two-sided test of equality with the MZSA is conducted.
All the attributes which have significantly lower importance than MZSA are considered to be „unimportant‟ and permanently removed them from the information system.
Similarly those attributes that having higher importance when considered alongside MZSA are considered to be important.
All duplicates from the information system are removed.
This procedure is repeated until the level of importance is assigned for all the attributes.
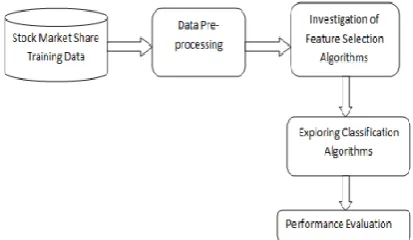
Proposed Stock Turnover Prediction Framework
The stock turnover prediction framework proposed is shown in Figure 1. The basic methodology involved Data Collection, Pre-processing, Feature Selection and Classification, each of which is explained below.
The dataset utilised for predicting the turnover was taken from www.bsc.com which included the stock market values of companies including Infosys, HDFC, Apollo Hospitals and Sintex, over the past 10 years.
~ 127 ~
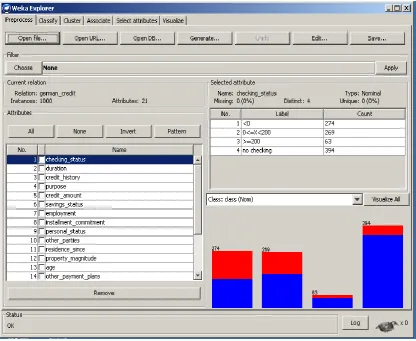
While performing any experiment it is necessary to have a dataset and a proper methodology as to how to work on that dataset so that a proper prediction could be made in lieu of future decisions to be made. In our experiment of prediction of stock market, we have a stock dataset with 21 features, 57772 data entries and target at 22nd position. It is a binary classification problem [5] with output values as 0 and 1; so therefore we have to apply classification models of machine learning [5]. Before using any model with the dataset, we must ensure that our data is pre-processed; it means that dataset should be in .csv (comma separated values) format, there should be no null values or any noisy data in the dataset. After data pre-processing [9], next step is to divide the dataset into two parts: - training
data subset and testing data subset (normally it is in the ratio 70:30 but it could be changed as per the experimenter's requirements or as per the performance of the model). Once the dataset is divided into training and testing data subsets, classification models are executed on the dataset and results are generated in the form of evaluation parameters such as H, Gini, AUC, F-measure, Sensitivity, Specificity, TPR, FPR, Error Rate, Recall, Precision, Accuracy and Time. Any of the above mentioned parameters can be chosen to compare the results, we have chosen accuracy parameter to compare the classification models and choose the best one giving the most accurate results. Confusion Error matrix show the true positive rate and false positive rate.
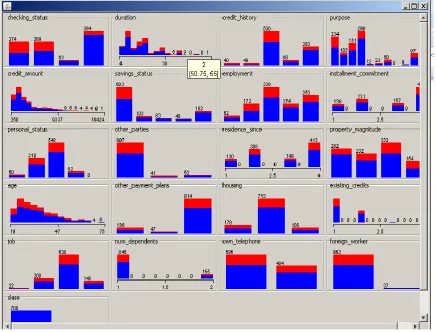
Fig. 2: Approach to solve Classification problem
Results
The final results of the research work that is to be
implemented in the weka tool. The different figures of the research works are given below.
~ 128 ~
~ 129 ~
Fig. 5: define the selection of attributes with CFsSubsetEval to select the attributes. The search method is the Greedy Step wise and the total attribute is 21 and the attribute selected is 3.
~ 130 ~
Fig. 7: Good and the bad status of the intrusion detection after the processing of the dataset.
~ 131 ~
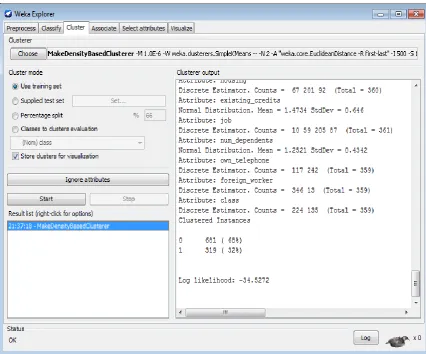
Fig. 9: Clustering dataset attributes with make density based. A method used to Estimate the density using a linear combination of pre-defined method.
Fig. 10: Good and bad status of the data Prediction after the processing of the dataset.
Conclusion
In this paper, multiple learning algorithms with NN and ensembling method are used to obtain more accurate predictive results. Experimental results are performed on Stock market data set. A comparative analysis of different feature selection methods based on stock market benchmark dataset is applied. The performance is evaluated in terms of regression, slop and Accuracy of the testing dataset. It is observed that SVM is best than NN, Because in SVM, the regression is 0, slop is less and the accuracy is 98%. But in NN slop and regression is more whether the accuracy is 99%.
For future work we would like to keep high detection rate and lowering the false alarm rate. In addition, it would also be implemented on another datasets with different compressions and methods.
References
1. Pankaj kumar et al.(2016) “Intelligent Stock Data Prediction using Predictive Data Mining Techniques” IEEE pp.-1-5.
2. G. S. Navale et al. (2016) “Prediction of Stock Market using Data Mining and Artificial Intelligence” International Journal of Computer Applications (0975 – 8887) Volume 134 – No.12, January 2016.
3. Shashaank D.S et al.(2015) “Turnover Prediction Of Shares Using Data Mining Techniques: A Case Study” IEEE,pp.-1-8
4. Ruchi Desai et al. (2014) “Stock Market Prediction Using Data Mining” IJEDR | Volume 2, Issue 2 | ISSN: 2321-9939, 2014.
5. S.Prasanna et al. (2013) “An analysis on Stock Market Prediction using Data Mining Techniques” S.Prasanna et al./ International Journal of Computer Science & Engineering Technology (IJCSET), ISSN :
2229-3345 Vol. 4 No. 02 Feb 2013.
6. Qasem A. Al-Radaideh et al.(2012) “Using Data Mining Techniques to Build a Classification Model for Predicting Employees Performance” (IJACSA) International Journal of Advanced Computer Science and Applications, Vol. 3, No. 2, 2012.
7. Shou-Hsiung Cheng, ―Forecasting the Change of Intraday Stock Price by Using Text Mining News of Stock‖, IEEE,2010.
8. Klibanoff, P., Lamont, O., and Wizman, T.A., 1998. Investor Reaction to Salient News in Closed-end Country Funds. Journal of Finance, 53(2), pp.673-699. 9. Mitchell, M.L., Mulherin, J.H., 1994. The Impact of Public Information on the Stock Market. Journal of Finance, 49(3),pp.923-950.
10. Berry, T.D., Howe, K.M., 1994. ―Public Information Arrival.‖ Journal of Finance, 49(4), pp.1331–1346. 11. Wuthrich, B., Permunetilleke, D., Leung, S., Cho, V.,
Zhang, J., and Lam, W., Daily Stock Market Forecast from Textual Web Data. In IEEE International Conference on Systems, Man, and Cybernetics (San Diego, California, October 11-14, 1998). IEEE Press, Vol.3, pp.2720-2725.