A COMPARATIVE STUDY OF PARTICLE SWARM OPTIMIZATION
AND GRAVITATIONAL SEARCH ALGORITHM IN POULTRY
HOUSE TEMPERATURE CONTROL SYSTEM
B. O. Ola1, O. O. Awodoye2* and J. P. Oguntoye2*
1
Department of Computer Engineering, Osun State Polytechnic Iree, Osun State, Nigeria.
2
Department of Computer Science and Engineering, Faculty of Engineering & Technology, Ladoke Akintola University of Technology (LAUTECH), Nigeria.
Article Received on 06/10/2019 Article Revised on 27/10/2019 Article Accepted on 17/11/2019
ABSTRACT
Low or unexpected rise in temperature is a major factor affect the effectiveness and productivity of broiler chickens. Maintaining and keeping the temperature at normal level is essential to reducing the mortality rate and increase the productivity of the poultry. Some Nature Inspired Algorithms (NIAs) which have proven to be efficient have been adopted to regulate the temperature of the poultry house. However, various studies have shown that there is no algorithm that can achieve the best solution for all optimization problems, and that some algorithms give a better solution for some problems than the others. Therefore, in this study, a comparative analysis of the Particle Swarm Optimization (PSO) and Gravitational Search Algorithm (GSA) in Poultry House Temperature Control System. The experiment results show that both PSO and GSA were able to regulated the poultry house efficiently. However, PSO proved to be more efficient than GSA in terms of cost and computational time. The PSO is able to find better solutions and converges faster compared to the Gravitational Search Algorithm. It is therefore, recommended that PSO should be adopted instead of GSA in poultry house temperature regulation systems.
World Journal of Engineering Research and Technology
WJERT
www.wjert.org
SJIF Impact Factor: 5.924
*Corresponding Author O. O. Awodoye
J. P. Oguntoye
Department of Computer
Science and Engineering,
Faculty of Engineering &
Technology, Ladoke
Akintola University of
Technology (LAUTECH),
KEYWORDS: Gravitational Search Algorithm, Nature Inspired Algorithms, Particle Swarm Optimization, Poultry House Temperature, Swarm Intelligence algorithms, Thermal Regulation.
1.0 INTRODUCTION
Poultry constitutes one of the livestock productions that contribute significantly to human source of food (Tilakasiri et al., 1988). Poultry farming involves raising of domesticated birds like chickens, ducks, turkeys and geese for the aim of farming meat or eggs for food. Several billions chickens are raised annually as a supply of food, for either meat or eggs (Sinduja et. al. 2016).
A comprehensive analysis of studies has shown that comfort satisfaction of poultry birds can be enhanced by dynamically observing various factors like temperature, relative humidity, and solar radiation in the poultry house (William, 1995). Although, it good to control all the above factors, economic considerations have suggested the control of the most important single factor, which is temperature. Adesiji et. al. (2013) stated that Ambient temperatures significantly influence the survivability and performance of the poultry production. Poultry flocks are particularly vulnerable to climate change because there is a range of thermal conditions within which animals are able to maintain a moderately steady body temperature in their behavioural and physiological activities. Hence, birds can only tolerate narrow temperature ranges to sustain the peak of their production for human consumption and any unpredictable climatic changes will therefore trigger a series of adjustment and readjustments by livestock and poultry birds in the struggle for survival which may have negative consequence on the viability of poultry production (Adesiji et. al., 2013).
Consequently, there is a need to regulate the temperature of the poultry house at every point in time to ensure optimum poultry production. Several techniques have been adopted to achieve an optimum regulation of the poultry house. The traditional methods despite being effective are time consuming, tedious and require a continuous monitoring (Czarick & Michael, 1994). A good knowledge based system that can regulated the temperature requirement of the poultry system will go a long way to overcome the shortcomings of the existing techniques.
found to be computationally efficient. In this study, a comparative analysis of the performance of Particle Swarm Optimization (PSO) and Gravitational Search Algorithm (GSA) in poultry house temperature control system will be carried out.
Particle Swarm Optimization (PSO) is a computational search and optimization technique that have been empirically shown to achieve well on several optimization problems. It is extensively used to find the worldwide optimum explanation and solution in a complex search space (Kumar, Singh & Patro, 2016). PSO is a population-based optimization technique inspired by the behaviour of schools of fish, herds of animals or flocks of birds (Eberhart & Kennedy 1995).
Gravitational Search Algorithm (GSA) is a stochastic population-based metaheuristic inspired by the interaction of masses via Newtonian gravity law. It is an optimization algorithm that is based on the law of gravity and mass interactions. In this algorithm, the searcher agents are a collection of masses, and their interactions are based on the Newtonian laws of gravity and motion (Rashedi et. al., 2010).
2.0 Literature Review
2.1 Particle Swarm Optimization (PSO)
Particle Swarm Optimization Algorithm (PSO) is one of swarm intelligence optimization algorithms. It belongs to class of random searching algorithms (Adel & Songfeng, 2016). The main idea behind PSO is originated from the sharing and updating of information among bird (particle) individuals in the process of searching food. Each individual bird can benefit from discovery and flight experience of the others. In PSO algorithms, the particle swarm is initialized randomly in searching space and each particle has initial speed and position. So the searching quality and the speed have randomness. The path of particle is updated through individual best position and the path of swarm is updated via global best location, which is found by the entire population. This makes particles move to the optimal solution (Zhang et. al., 2013). Each particle updates its velocity and position according to equation (1) and (2) respectively (Attiya & Zhang, 2017):
(1)
(2)
Where , velocities of particle at iterations , , positions of particle at iterations . is inertia weight to be employed to control the impact of the previous history of velocities. denotes the iteration number, is the cognition learning factor, is the social learning factor, and are random numbers uniformly distributed in [0, 1].
The Stepwise procedure of the PSO algorithm are presented below (Alam et. al., 2015): 1. Set parameter , , and of PSO
2. Initialize population of particles having positions and velocities 3. Set iteration k = 1
4. Calculate fitness of particles and find the index of the best particle b
5. Select and 6.
7. Update velocity and position of particles
9. Update of population
If then else
10. Update of population
If then and set else
11. If then and goto step 6 else goto step 12 12. Output optimum solution as .
2.2 Gravitational Search Algorithm (GSA)
Gravitational search algorithm (GSA) is a simple well known meta-heuristic search algorithm based on the law of gravity and the law of motion (Rashedi et. al., 2009). It is a swarm intelligence type algorithm that is inspired by the Newton’s physics concept gravitational force and motion of individuals in nature. Like many other nature-inspired algorithms, it needs refinements to maximize its performance in solving various types of problems. In addition to the problem encoding that sometimes can be a challenge, fine tuning its parameters play a significant role balancing the search time versus solution quality (Taisir & Al Qasim, 2013). GSA is an optimization algorithm and provides proper balancing between exploitation and exploration capabilities. So in this algorithm, heavier masses individuals are responsible for exploitation whereas lighter masses individuals are responsible for the exploration of the search area (Aditi et. al., 2017). When searching process start lighter masses (individuals are far from the optimum solutions) individuals move with large step size (exploration) and after this when individuals converge to the optimum solutions i.e. higher masses individuals move with comparative small step size (exploitation).
The GSA algorithm is described by the following steps (Rashedi et. al., 2009):
Step 1: Agents initialization:
The positions of the N number of agents are initialized randomly.
(3)
represents the positions of the agent in the dimension, while is the space dimension.
Step 2: Fitness evolution and best fitness computation:
For minimization problems best and worst fitness are:
(4) (5) For maximization problems best and worst fitness are:
(6) (7) represents the fitness value of the agent at iteration , and represents the best and worst fitness at iteration t.
Step 3: Gravitational constant (G) computation:
The gravitational constant G(t) is computed using the equation below.
(8)
and are initialized at the beginning and will be reduced with time to control the search accuracy. T is the total number of iterations.
Step 4: Calculation of the Masses of the agents:
Gravitational and inertia masses for each agent are calculated at iteration t. Masses in GSA depend upon the fitness value of agents.
(9)
Where and are inertia and passive gravitational masses of agent respectively and is active gravitational mass of agent. is the fitness value of agent.
Step 5: Calculation of Agent‟s Accelerations:
The acceleration of agents are calculated using the equation below:
(12) is the total force acting on agent calculated as:
Force on agent by agents mass during iteration is computed using the following equation:
is the Euclidian distance between two agents and at iteration . is the gravitational constant calculated using equation 8 while is a small constant.
Step 6: Velocity and positions of agents:
The velocity update equation for agents is defined as
(15)
is random variable in interval [0,1]. and are the velocity of individual during the iteration and respectively. The position update equation for individuals is defined as:
(16)
and are the position of individual during the iteration and respectively. Velocity of individuals is updated during each iteration. Due to changes in the velocity every individual updates its position.
Step 7: Repeat steps 2 to 6
Steps 2 to 6 are repeated until the iterations reach their maximum limit. The best fitness value at the final iteration is computed as the global fitness while the position of the corresponding agent at specified dimensions is computed as the global solution of that particular problem.
2.3 GSA versus PSO
In both GSA and PSO the optimization is achieved by agent’s movement in the search space, nevertheless the movement strategy is different. Some significant differences are as follows
(Rashedi et. al., 2009):
1. In PSO the direction of an agent is calculated using only two best positions, pbesti and gbest. But in GSA, the agent direction is calculated based on the overall force obtained by all other agents.
3. PSO uses a kind of memory for updating the velocity (due to pbesti and gbest). However, GSA is memory-less and only the current position of the agents plays a role in the updating procedure.
4. In PSO, updating is performed without considering the distance between solutions while in GSA the force is reversely proportional to the distance between solutions.
5. Finally, note that the search ideas of these algorithms are different. PSO simulates the social behavior of birds and GSA inspires by a physical phenomenon (Rashedi et. al.,
2009).
3.0 MATERIAL AND METHODS
In this study, a comparative analysis of GSA and PSO for optimal control of poultry house temperature is presented. Each of the techniques is developed to either activate or deactivate either the air conditioning system or the heater as the case may be at a point in time. Red, Green and Yellow light indicate the state of temperature in the poultry house. The red signal indicate that the temperature is below or above the normal temperature. The green signal indicates that the temperature is normal while the yellow signal indicates warning signal that the temperature is either tending above or below the normal temperature. RT, GT and YT represent the red timer, green timer and yellow timer respectively. “R”, “Y” and “G” are the
red, yellow and green signals respectively (ola et. al. 2017).
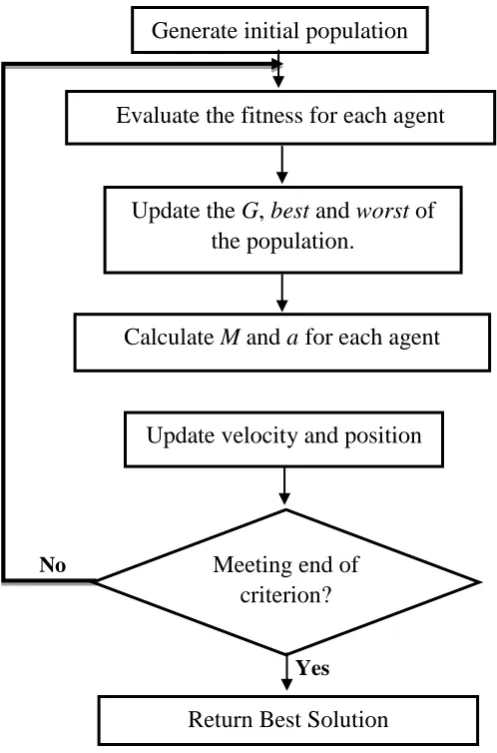
Figure 1: General principle of GSA.
Three variables used to represent levels of temperature include: Below NT, NT and Above NT which represent Below Normal Temperature, Normal Temperature and Above Normal Temperature respectively.
No
Yes
Generate initial population
Update the G, best and worst of the population.
Evaluate the fitness for each agent
Calculate M and a for each agent
Update velocity and position
Return Best Solution Meeting end of
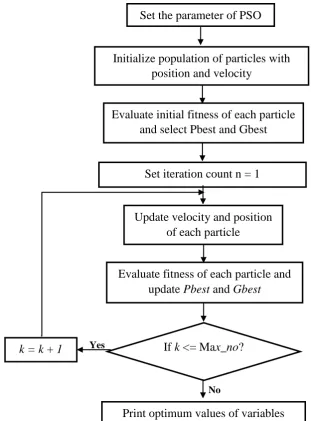
Figure 2: Particle Swarm Optimization Process.
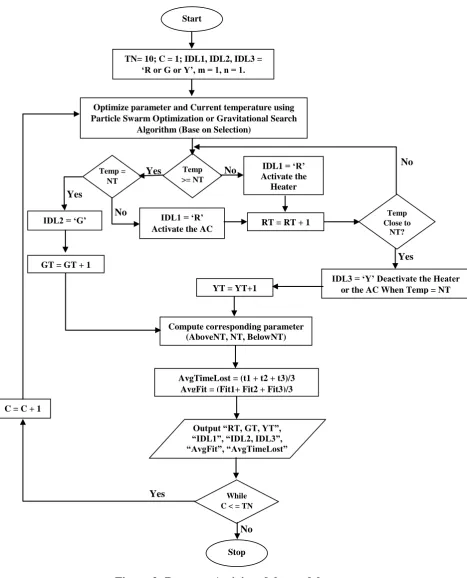
The flow diagram of the program activity is shown in Figure 3. The inputs which includes the current temperature and various parameters needed to control the temperature of a broiler chickens in a poultry farm were initialized. These inputs include: “TN”which indicates the total number of cycles and is initialized to be 10. “C” is the counter for the total number of
cycles and is initialized to be 1. RT, GT and YT represent the red timer, green timer and yellow timer respectively. “k” is the counter for the iteration and it is set to 1. “R”, “Y” and
“G” are the red, yellow and green signals respectively. These parameters were presented as
inputs to either GSA or PSO algorithm for optimization. The optimized parameter from either GSA or PSO regulate the thermal requirement of a poultry house.
Set the parameter of PSO
No
Evaluate initial fitness of each particle and select Pbest and Gbest Initialize population of particles with
position and velocity
Set iteration count n = 1
Yes
Evaluate fitness of each particle and update Pbest and Gbest
Update velocity and position of each particle
Print optimum values of variables If k <= Max_no?
k = k + 1
and update Pbest and
Figure 3: Program Activity of the model.
When the current temperature is greater than the normal temperature (NT) i.e. (Temp = AboveNT) the AC is activated to lower the temperature; the red indicator “R” becomes ON
and the red timer is increased. Similarly, when the current temperature is less than the normal
No Yes
Yes No
No IDL1 = „R‟
Activate the AC Yes
Yes No
Output “RT, GT, YT”, “IDL1”, “IDL2, IDL3”, “AvgFit”, “AvgTimeLost” Temp
>= NT
TN= 10; C = 1; IDL1, IDL2, IDL3 = „R or G or Y‟, m = 1, n = 1.
Compute corresponding parameter (AboveNT, NT, BelowNT)
IDL1 = „R‟ Activate the
Heater
RT = RT + 1 IDL2 = „G‟
AvgTimeLost = (t1 + t2 + t3)/3 AvgFit = (Fit1+ Fit2 + Fit3)/3
While C < = TN
Stop C = C + 1
Optimize parameter and Current temperature using Particle Swarm Optimization or Gravitational Search
Algorithm (Base on Selection)
Temp = NT
Temp Close to NT?
YT = YT+1 GT = GT + 1
temperature (NT) i.e. (Temp = BelowNT) the Heater is activated to raise the temperature; the red indicator “R” becomes ON and the red timer is increased as well (ola et. al. 2017).
At a point when the temperature is very close to the normal temperature as a result of heating or air-conditioning the warning signal is ON i.e. the yellow indicator “Y” and the yellow
timer is increased. However, when the temperature become normal either the AC or the heater is deactivated. When the temperature is normal i.e. (Temp = NT) the AC and heater will be deactivated while the green indicator “G” becomes ON and the green timer is
increased.
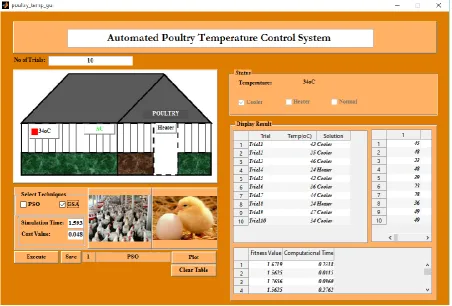
Figure 4: The GUI Application.
Random Access Memory and 500GB hard disk drive was used to implement the proposed work. An interactive Graphic User Interface (GUI) application was developed to ensure easy interaction and understanding as shown in figure 4.
4.0 RESULT AND DISCUSSION
The experiment was carried out for each technique for poultry house temperature regulation. The results obtained by the two techniques i.e. GSA and PSO were presented below. Table 1 and 2 shows the results obtained by the application PSO and GSA respectively.
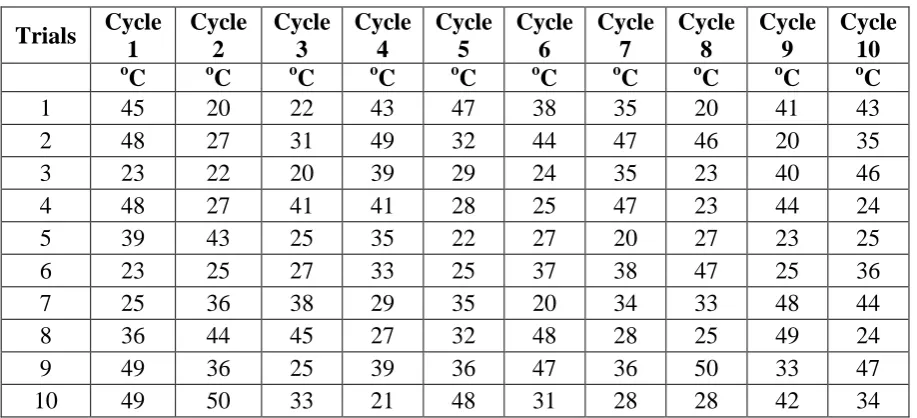
Table 1: PSO Result for Poultry House Temperature Regulation.
Trials Cycle 1 Cycle 2 Cycle 3 Cycle 4 Cycle 5 Cycle 6 Cycle 7 Cycle 8 Cycle 9 Cycle 10 o
C oC oC oC oC oC oC oC oC oC
1 45 20 22 43 47 38 35 20 41 43 2 48 27 31 49 32 44 47 46 20 35 3 23 22 20 39 29 24 35 23 40 46 4 48 27 41 41 28 25 47 23 44 24 5 39 43 25 35 22 27 20 27 23 25 6 23 25 27 33 25 37 38 47 25 36 7 25 36 38 29 35 20 34 33 48 44 8 36 44 45 27 32 48 28 25 49 24 9 49 36 25 39 36 47 36 50 33 47 10 49 50 33 21 48 31 28 28 42 34
Table 2: GSA Result for Poultry House Temperature Regulation.
Trials Cycle 1
Cycle 2
Cycle 3
Cycle 4
Cycle 5
Cycle 6
Cycle 7
Cycle 8
Cycle 9
Cycle 10 o
C oC oC oC oC oC oC oC oC oC
1 44 48 48 37 47 45 45 50 22 47 2 47 30 36 20 34 42 48 49 46 34 3 22 40 25 24 46 45 23 35 30 23 4 42 48 32 28 37 42 48 44 35 38 5 27 42 22 42 22 39 39 24 28 24 6 44 25 48 35 45 33 23 33 26 46 7 32 45 30 26 37 28 28 48 39 50 8 24 25 47 46 27 24 36 44 40 37 9 46 32 35 39 38 43 49 49 41 28 10 44 22 45 32 30 32 49 24 33 48
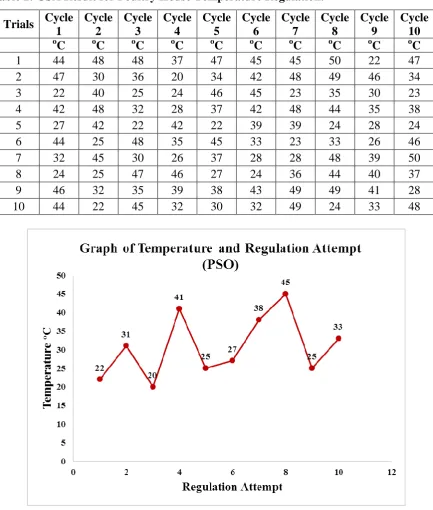
Figure 6: Graph of Temperature against Regulation Attempt for GSA.
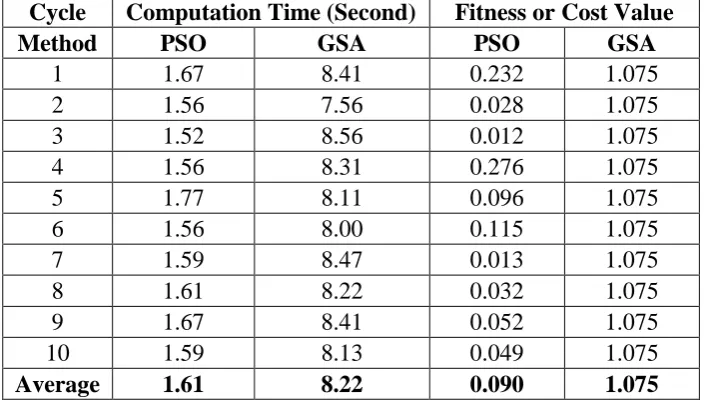
Table 3: Simulated PSO and GSA results Showing Fitness Value and Computation Time.
Cycle Computation Time (Second) Fitness or Cost Value
Method PSO GSA PSO GSA
1 1.67 8.41 0.232 1.075 2 1.56 7.56 0.028 1.075 3 1.52 8.56 0.012 1.075 4 1.56 8.31 0.276 1.075 5 1.77 8.11 0.096 1.075 6 1.56 8.00 0.115 1.075 7 1.59 8.47 0.013 1.075 8 1.61 8.22 0.032 1.075 9 1.67 8.41 0.052 1.075 10 1.59 8.13 0.049 1.075
Average 1.61 8.22 0.090 1.075
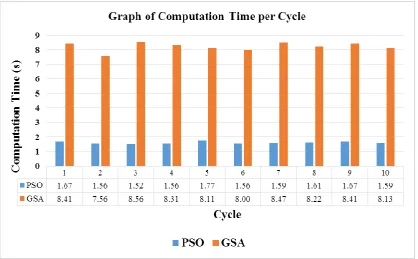
Figure 7: Graph of Computation Time per Cycle.
Figure 8: Graph of Fitness Value per Cycle.
CONCLUSION
optimum production. However, PSO was found to be more efficient than GSA in terms of cost and computational time. It is therefore, recommended that PSO should be adopted instead of GSA in poultry house temperature regulation systems. Other techniques like Artificial Immune Systems (AIS), Ant Colony Optimization (ACO) can be applied and compared with Particle Swarm Optimization (PSO) to determine their computational efficiency in the regulation of temperature requirement for poultry house.
REFERENCES
1. Adel H. A. & Songfeng L. U. (2016). “A Particle Swarm Optimization Algorithm Based on Uniform Design.” International Journal of Data Mining & Knowledge Management Process (IJDKP) 6(2): 1-6.
2. Adesiji, G. B., Tyabo. I. S., Bolarin, O. Ibrahim, M. & Baba, S. T. (2013). “Effects of Climate Change on Poultry Production in Ondo State, Nigeria.” Ethiopian Journal of Environmental Studies and Management, 6(3): 2-4.
3. Aditi G., Nirmala S., & Harish S. (2017). “Exploitative Gravitational Search Algorithm.” Proceedings of Sixth International Conference on Soft Computing for Problem Solving, Advances in Intelligent Systems and Computing 546, DOI 10.1007/978-981-10-3322-315.
4. Alam M. N., Das B. & Pant V. (2015). “A comparative study of metaheuristic optimization approaches for directional overcurrent relays coordination.” Electric Power Systems Research,128: 39-52.
5. Attiya I. & Zhang X. (2017). “A Simplified Particle Swarm Optimization for Job Scheduling in Cloud Computing.” International Journal of Computer Applications 163(9): 34-41.
6. Bansal, J. C., Sharma, H., Arya, K.V., Deep, K., Pant, M. (2014). “Self-Adaptive Artificial Bee Colony. Optimization 63(10): 1513–1532.
7. Cheng Y. M., Li L. et al (2007). “Performance studies on six heuristic global optimization methods in the location of critical slip surface.” Computers and Geotechnics. 34(6): 462-484.
9. Eberhart R. C, Kennedy J. (1995). “A New Optimizer Using Particle Swarm Theory. In Proceedings of the 6th International Symposium on Micro-machine Human Science.” 1995: 39–43.
10.Engelbrecht A. P. (2005). “Fundamentals of computational swarm intelligence.” John Wiley & Sons, Ltd.
11.Kumar A., Singh B. K. & Patro B. D. K. (2016). “Particle Swarm Optimization: A Study of Variants and Their Applications.” International Journal of Computer Applications, 135(5): 24-30.
12.Ola B. O, Oguntoye J. P. and Awodoye O. O. (2017). “Performance Evaluation of Particle Swarm Optimization on Poultry House Temperature Control System.” IOSR Journal of Computer Engineering (IOSR-JCE) e-ISSN:2278-0661, p-ISSN:2278-8727. In press.
13.Rashedi E., Nezamabadi-pour H. & Saryazdi S. (2010). “BGSA: Binary Gravitational Search Algorithm”, Natural Computing, 9(3): 727-745.
14.Rashedi, E., Nezamabadi-Pour, H., Saryazdi, S. (2009). “GSA: A Gravitational Search Algorithm.” Information sciences, 179(13): 2232-2248.
15.Sinduja K., Sofia Jenifer S., Sri Abishek M. & Sivasankari B. (2016). “Automated Control System for Poultry Farm Based On Embedded System.” International Research Journal of Engineering and Technology (IRJET)3(3): 620 -624.
16.Taisir E. & Al Qasim R. (2013). “On The Performance of the Gravitational Search Algorithm.” International Journal of Advanced Computer Science and Applications (IJACSA).4(8):74-78.
17.Tilakasiri, S. L. & Vidanapathirana, U. (1988). “Economics of poultry farming – a case study.” Economic Review, 13(9): 22-25.
18.William J., (1995), “Extension Poultry Specialist”, Iowa State University, Ames.