Crisis in microfinance institutions: identifying problems
Abstract
This article empirically analyses the reasons for crises in microfinance institutions (MFIs), using a sample of 832 MFIs from 74 countries for the period 2003-2011. The methodology used is logit analysis with panel data. The main results show that both internal and external factors influence the probability of a crisis. We find different factors that reduce the likelihood of a crisis (company’s performance, country’s economic growth, political stability and existence of a private credit bureau). On the other hand, excessive liquidity, a higher proportion of deposits over loans and more loans per employee all increase the probability of a crisis.
Keywords: Microfinance, crisis, panel data. JEL Classification: G21, O12.
1. Introduction
Microfinance institutions (MFIs) are a fundamental part of many countries’ financial systems. This activity, which began giving loans to people on low incomes based on little more than a joint guarantee, has evolved into a major industry offering a wide range of financial products and services such as loans, transfers, deposits and microinsurance.
Because of the importance that this activity has gained1, many studies have analysed the achievements of the most successful microfinance institutions (Ahlin et al., 2006; Kaboski, 2005; Khandker, 2005; Patten et al., 2001). These studies seek to identify models to be replicated and activities that microfinance institutions should follow, since not all have followed the same successful path. Some have become big and provided services to a large number of clients, such as Grameen Bank, while others are operating on a smaller scale or have even disappeared.
In the study of MFIs’ performance, we can distinguish between two different approaches: the financial sustainability on one hand and the social impact (such as poverty reduction or female empowerment) on the other (Armendáriz and Morduch, 2010). However, although studying the successful experiences is extremely important, an analysis of failed institutions2 is essential, especially when large MFIs have failed and disappeared even after following the best practices and recommendations gleaned from the most satisfactory experiences. The past examples of the institutions that have disappeared, as well as those that have managed to survive after encountering difficulties, are of enormous help in avoiding making the same mistakes again today. Studying failure is even more relevant today because the crisis has changed microfinance institutions’ structures and business model. Despite the importance of this, there have been few studies that have analysed the failure of microfinance institutions. The few that exist focus on
1 According to data from the Microcredit Summit Campaign, on 31 December 2011, the 3,703 microfinance institutions that reported data had reached 195 million customers worldwide.
2 In the study of MFIs’ failure, we have also two different approaches: the lack of financial sustainability on one hand and the absence of social impact on the other.
3 a descriptive study of specific cases. Although these provide very relevant information, they cannot be easily generalized. Stegee (1998) discusses the failure of the Colombian Corposol institution and how its inadequate growth and structure led it to an unsustainable situation. Marulanda et al. (2010) analysed 10 microfinance institutions in Latin America that failed. Out of all of the lessons he gleans, he stresses that the way the institution’s management team addresses the issues is critical in these situations. Rozas (2011) extends the previous work done by Marulanda, making an in-depth analysis of the failure of 10 other microfinance institutions located in different parts of the world. The main recommendations he puts forward are to face the problems with determination, avoid panic and seek external advice.
In this context, the main contribution from our work is to carry out, for the first time, a study to identify the factors leading to the failure of microfinance institutions, by using an econometric analysis of the probability of MFI crisis. This probability of crisis is defined as the possibility that an institution may have financial problems. The second contribution from this work is that the analysis is carried out on a large number of MFIs, and not only for specific cases. That allows comparing healthy MFIs with those that are in crisis. Unlike previous studies, this study also analyses the effect that the macroeconomic and institutional situation of the countries in which the MFIs operate has on the probability of a crisis, thereby giving us the third contribution from this work. The econometric analysis and the large sample size enable the results obtained to be generalized easily, which did not occur in previous works that addressed only specific cases. The innovation proposed in the paper is to suggest early warning systems which microfinance organisations and regulatory authorities can use to minimise the likelihood of a crisis occurring, by analogy with the early warning systems proposed for banks and national governments (e.g. special issue of 'Journal of Economic Perspectives', April 1998; special issue of 'Journal of International Development' (vol 25 no 8), December 2013).
The empirical analysis is carried out on a sample of 832 MFIs from 74 countries during the period 2003-2011. By choosing this large sample size, it is possible to analyse both the specific characteristics of the microfinance institutions themselves and the macroeconomic variables and institutional characteristics of the country in which they are located. To carry out the empirical analysis, a panel data logit regression is applied. The main results of the study show that the institutions with greater profitability are less likely to have difficulties. Moreover, institutions with greater liquidity, higher proportion of deposits over loans and more loans per employee are more likely to have a crisis. Additionally, the economic growth of the country in which the MFI operates, political stability and the existence of a private credit bureau reduce the probability of a crisis.
The rest of the work is organized as follows. In section 2, the factors influencing the failure of MFIs are explained. In section 3, the sample is defined, the methodology used in the study is explained, and the results obtained are presented. The study ends with the conclusions and bibliographical references.
2. The difficulties of microfinance institutions
When we analyse the success of an MFI, we should consider the ultimate goals of a MFI: the first one is to serve as many poor people as possible and the second one is its own financial sustainability. The debate between the two approaches has not been concluded yet, although the most recent microfinance paradigm seems to favour the financial approach (Hermes and Lensink, 2007). In addition, it is difficult to establish a definition of failure that appears as a result of a failure to achieve financial and social results at the same time. For this reason, the existing studies focused, as we are doing in this one, on the achievement of financial results (Marulanda et al. 2010; Rozas, 2011). In this regard, the financial failure of these institutions may be caused by internal and external factors (Navajas and Villacorta, 2012).
5
Internal factors refers to the very characteristics of MFIs, such as their organizational design, staffing structure, products sold, and so on. These factors are often the most decisive in determining an MFI’s financial position, but they are also relevant because they are controlled by the institutions themselves. Below, we review the main factors that reflect the status and structure of an MFI and which may influence their probability of crisis.
– Size of loan: The average size of loans granted by an institution is indicative of its customers’ average income. The smaller the loan, the lower its customers’ income level will be. The relationship between this variable and the probability of crisis in an MFI can be either positive or negative. On the one hand, a lower average loan size is expected to lead to higher risk. In other words, granting microloans for very small amounts can attract customers with greater difficulties in repaying the loans (Roslan and Karim, 2009). On the other hand, a bigger average loan size is also expected to lead to a higher risk. This is because borrowers who bear higher repayment instalments are more likely to default (Guttman, 2008, Eze and Ibekwe, 2007). In this regard, Sharma and Zeller (1997) explain that if a project fails, the borrower bearing higher repayment instalments will have more difficulty in meeting their repayment obligations.
– Excess liquidity: Greater liquidity provides greater security, but too much can lead to higher risk loans. An MFI with high liquidity may be tempted to encourage rapid growth, especially in terms of the number of borrowers per branch (González, 2010). A rapid rise in microloans, driven by excess liquidity, may relax restrictions on granting these loans. This easing of restrictions will cause an increase in the default rate (Cermeño et al., 2011). Therefore, it is expected that excess liquidity will be positively related to the probability of crisis in a MFI.
– Deposit-loan ratio: Lenders will increase disbursements of credit and/or relax credit constraints if they perceive an increase in deposits over total loans, which could increase the probability of a crisis (Cermeño et al., 2011).
– Interest rate applied by the institution: The relationship between this variable and the probability of crisis in an MFI can be either positive or negative. On the one hand, at a higher interest rate, customers will have more difficulties in repaying their loans, and this will result in higher default rates (Cermeño et al., 2011). On the other hand, MFIs can avoid the problem of adverse selection by charging high interest rates (González, 2007). In this case, if the interest rate increases, the risk of default decreases; that is, the probability of failure decreases.
– Number of borrowers per employee: This variable is used to approximate the MFI staff’s workload. The higher the staff’s workload, the less time they have to study each customer, which will increase the risk in these transactions and therefore lead to a greater probability of crisis in the institution (González, 2007; González, 2010; Wilhelm, 2000).
– Profitability: Increased profitability is the result of better management, best practices, lower costs, and so on. Thus, higher profitability leads to less probability of crisis. In the microfinance sector, profitability is usually achieved after years of hard work that enable management techniques to be honed and adapted to the target market (Marulanda et al., 2010).
– Size of the MFI: The effect of size on the probability of crisis can be twofold. Firstly, the size of the institution may be a reflection of its success and good practices. This is because the institutions that are better managed with lower costs are able to attract more customers and increase their market share (Demsetz, 1973; Peltzman, 1976). Therefore, larger institutions have a lower probability of crisis as a result of their better
7 management. On the other hand, growth that is too fast can lead to major imbalances within an MFI (Steege, 1998, Marulanda et al., 2010). These imbalances may lead to less efficiency, unsuitable loans being granted, and a lack of control over these. Therefore, a large size may also increase the probability of an MFI crisis.
2.2- External factors
The context in which a microfinance institution operates is also an important factor that can affect its financial health. The crisis in an MFI is a complex event whose interpretation is hampered by numerous external factors. Previous literature has found that the macroeconomic and institutional characteristics of the country in which it is located, as well as local events or factors of contagion, are often crucial to the survival of an MFI (Vanroose and D’Espallier, 2013; Ahlin et al., 2011; Chen et al., 2010; Reille, 2009; Patten et al., 2001).
Below, we review the main factors that may influence the probability of failure, grouped into macroeconomic variables and institutional variables.
Macroeconomic variables
– Region: Certain characteristics of MFIs vary depending on the geographic region where they are located (Pereira and Mourao, 2012; Bogan, 2012, Ahlin et al., 2011, Vanroose and D’Espallier, 2013). Maturities, the average loan, the profit margin, the number of borrowers per institution and the percentage of women tend to be different depending on the geographic region being studied. These differences can be of significant importance in business models of MFIs and also in their financial health.
– Economic growth: Economic growth is a good indicator of the economic health of a country and its technological and institutional progress (Vanroose and D’Espallier, 2013; Ahlin et al., 2011; González, 2010; Kappel et al., 2010.). In this sense, the incomes of companies and families are higher in favourable economic situations, so that
economic growth will reduce the probability of a microfinance institution failing due to a drop in defaults.
– Remittances: Households receiving remittances have a higher income to cope with their microcredit repayments, so a greater flow of remittances lowers the default rate that microfinance institutions have to bear (Ahlin et al., 2011; Kappel et al., 2010). Institutional variables
– Level of competition in the microfinance sector: the microfinance sector has low barriers to entry. If there is a lot of competition it will be difficult to maintain customers’ loyalty and payment incentives. Thus, competition could lead to excessively high loans being granted and a relaxation of the criteria for granting loans in order to avoid losing customers. Such actions will increase clients’ indebtedness and therefore the portfolio at risk and the write-off of MFIs (Wilhelm, 2000; Chen et al., 2010; and Vogelgesang, 2003).
– Depth of the financial system: The depth of the financial system may have a positive or negative effect on the MFIs’ situation. On the one hand, greater depth in the financial system complements the microfinance sector because it fosters incentives to keep up good credit records and opens up ways for micro-companies to go further than microcredit (Ahlin et al., 2011). On the other hand, a greater depth in the financial system may make it difficult for the microfinance sector to develop because the two sectors will enter into direct competition. This competition would lead to lending with fewer restrictions and for greater amounts, which in turn would lead the customers to greater indebtedness and therefore to an increase in the rate of default (Vanroose and D’Espallier, 2013).
– Governance indicators: Political instability and corruption may shorten planning horizons and affect borrowers’ ability and capacity to pay loans back (Kappel et al.,
9 2010). In other words, countries with political instability and high levels of corruption may create disincentives for customers to pay back loans.
– Information exchange system: This is measured as a private credit bureau, that is, the number of people and companies listed in a private credit registry. The existence of efficient systems for exchanging information about the indebtedness of borrowers improves the control that MFIs have over their loans. Moreover, these systems also improve the quality of portfolios with outstanding debt (Padilla and Pagano, 2000; Jappelli and Pagano, 2000; Luoto et al., 2007; Ahlin et al., 2011). This requires the time it takes a lender to access information about the borrower not to be too long, because otherwise the system’s effectiveness is reduced (Kappel et al., 2010). In addition, information exchange systems have a disciplinary effect on borrowers, creating incentives to repay loans (Padilla and Pagano, 2000). If borrowers are aware of the existence of a credit information system, they will be more likely to repay loans (Kappel et al., 2010).
– Strength of legal rights: Generally, greater protection of the legal rights of borrowers and lenders helps reduce failed loans from MFIs. So, MFIs operating in these countries are less likely to have a crisis. However, Ahlin et al. (2011) found that in some cases, greater legal protection can encourage lending to higher risk customers. This could lead to an increase in bad debts, so this variable could also have a negative effect on the probability of an MFI crisis.
3. Empirical analysis 3.1- Sample
The sample used for the empirical analysis consists of 4,463 observations of 832 MFIs from 74 countries between 2003 and 2011, which have at least three consecutive years of data.
Given the variety of factors considered, four different databases have been used in this study. On the one hand, Microfinance Information Exchange (MIX) provides information to create specific variables for microfinance institutions. On the other hand, World Development Indicators, World Governance Indicators and Doing Business provide macroeconomic and institutional variables.
Table 1 shows how the MFIs used in our analysis are mostly in Asia and Latin America, whereas Table 2 shows that the institutions most prevalent in the market are Non-Governmental Organizations (NGOs) and Non-Banking Financial Institutions (NBFIs), with 39.65 percent and 34.79 per cent respectively.
TABLES 1 & 2 3.2- Methodology
In this study we perform an analysis to test the effect that each of the factors analysed has on the probability of a crisis. To do this, a qualitative response model for discrete dependent variables is applied, since this type of data does not allow the classical regression model to be used.
The model is approached in terms of probability and is estimated using a logit analysis with panel data. The presence of unobserved heterogeneity may lead to biased results in the coefficients if a traditional estimation is made for maximum likelihood. To overcome this limitation, in this study an estimation is made using panel data, which is robust in the presence of unobserved heterogeneity and thus allows more efficient results to be obtained. In addition, discrete choice panel data models removed the bias of omitted variables that appears when unobserved individual effects are correlated with the explanatory variables (Pindado et al., 2008).
11 This study presents different models through a logit analysis with random effects, using the effect of the internal variables of the MFIs, the macroeconomic variables, and the institutional variables. The generic form of the models used is as follows:
𝐿𝑂𝐺 ( 𝑃(𝐶𝑅𝐼𝑆𝐼𝑆)
𝑃(𝑁𝑂 𝐶𝑅𝐼𝑆𝐼𝑆)) = 𝛽0+ 𝛽𝑗𝑀𝐹𝐼𝑖𝑡+ 𝛽𝑘𝑀𝐴𝐶𝑅𝑂𝑖𝑡+ 𝛽𝑙𝐼𝑁𝑆𝑇𝑖𝑡+ 𝑑𝑡+ 𝜂𝑖+ 𝜐𝑖𝑡 (1) Where β0, βj, βk, βl are the coefficients of the model, MFIit the internal variables of each
microfinance institution each year, MACROit the macroeconomic variables for each country
each year, INSTit the institutional variables for each country each year, dt the time-specific
effect, ηi the individual effect, and υit the random error.
Hence, the complete model follows this specification:
𝐿𝑂𝐺 (𝑃(𝑁𝑂 𝐶𝑅𝐼𝑆𝐼𝑆)𝑃(𝐶𝑅𝐼𝑆𝐼𝑆) ) = 𝛽0+ 𝛽1𝑆𝐼𝑍𝐸𝑖𝑡+ 𝛽2𝐿𝑆𝐼𝑍𝐸𝑖𝑡+ 𝛽3𝐿𝐼𝑄𝑖𝑡+ 𝛽4𝐷𝐸𝑃𝐿𝑂𝐴𝑁𝑆𝑖𝑡+
𝛽5𝑌𝐼𝐸𝐿𝐷𝑖𝑡+ 𝛽6𝐵𝑂𝑅𝑆𝑇𝐴𝐹𝐹𝑖𝑡+ 𝛽7𝑅𝑂𝐴𝑖𝑡+ ∑6𝑘=1𝛾𝑘𝑅𝐸𝐺𝐼𝑂𝑁𝑖𝑡+ 𝛽8𝐺𝑅𝑂𝑊𝑇𝐻𝑖𝑡+
𝛽9𝑅𝐸𝑀𝐼𝑇𝑖𝑡+ 𝛽10𝐶𝑂𝑁𝐶𝐸𝑁𝑖𝑡+ 𝛽11𝑃𝐶𝑅𝐸𝐷𝐼𝑇𝑖𝑡+ 𝛽12𝑆𝑇𝐴𝐵𝑖𝑡+ 𝛽13𝐶𝑂𝑅𝑅𝑈𝑃𝑖𝑡+
𝛽14𝐼𝑁𝐹𝑂𝑅𝑖𝑡+ 𝛽15𝐶𝑅𝐼𝐺𝐻𝑇𝑆𝑖𝑡+ 𝑑𝑡+ 𝜂𝑖+ 𝜐𝑖𝑡 (2) The dependent variable takes the value 1 if an MFI is in crisis in year t, and 0 otherwise. In the microfinance sector, there is no commonly accepted, explicit definition of failure or crisis.
However, several authors have tried to define it. Firstly, Marulanda et al. (2010) uses the term
failed experiences when an MFI is suffering serious financial losses that threaten its solvency and it needs to capitalize, merge, restructure or close. Secondly, Rozas (2011) uses a more technical definition to determine what institutions are in crisis Such institutions in crisis would be microfinance institutions with a portfolio at risk for more than thirty days (PAR 30) and
write-off ratio higher than 20 per cent3. The latter definition will be used in this paper to select MFIs that are in crisis.
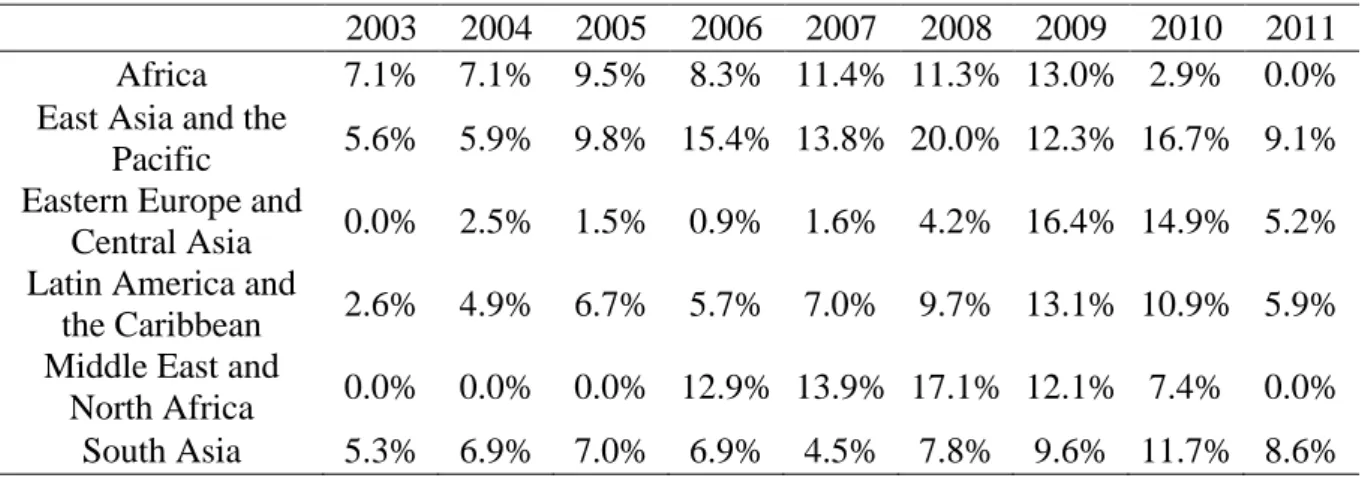
Table 3 shows the percentages for institutions in crisis compared to the total sample by region and year. We can see the effect the financial crisis has had on the microfinance sector.
TABLE 3
The independent variables are those that may have an influence on the probability of a crisis, according to the previous literature. These variables, which have previously been explained in the review of the literature, are divided into three categories: internal variables, macroeconomic variables and institutional variables. Table 4 shows the definition of each variable used in the model.
TABLE 4 Internal variables
LSIZE is the natural logarithm of the ratio gross loan portfolio over total number of active borrowers (Christen et al., 1995., Christen, 2001; Copestake; 2007; Cull et al., 2007; Cull et al., 2009, Gutiérrez-Nieto et al., 2007a).
LIQ refers to the excess liquidity as measured by the bank cash ratio over total assets (Kappel et al., 2010, Cermeño et al., 2011).
DEPLOANS refers to total deposits over the gross loan portfolio (Cermeño et al., 2011). YIELD refers to the interest rate applied by the institution. It is calculated by adding income from the interest and commissions associated with the loans with respect to the gross loans
3 PAR 30 (portion of portfolio with payments more than 30 days overdue) = ((balance of loans overdue > 30 days) + (renegotiated portfolio)) / gross loan portfolio. Write-off ratio = Value of loans written off / average gross loan portfolio.
13 portfolio average, taking into account inflation (Gutiérrez, 2012; Ahlin et al., 2011; Rosenberg et al., 2009).
BORSTAFF represents the number of borrowers each employee is responsible for as measured by the number of active borrowers divided by the total staff of the MFI (González, 2007; Jansson, 2003). The number of active borrowers refers to individually identifiable borrowers who have at least one outstanding loan with the institution. The number of borrowers is used in the numerator instead of loans because the number of people served determines the workload better than the loans granted (Gutiérrez, 2012). Total staff is defined as the total number of people working full time in an MFI.
ROA is the return on assets calculated as net operating income less taxes, divided by the institution’s total assets (Vanroose and D’Espallier, 2013; Rosenberg et al., 2009).
SIZE is the natural logarithm of total assets of an MFI (Vamroose and D’Espallier, 2013; Gutiérrez, 2012; Gutiérrez-Nieto et al., 2007b; Mersland and Strom, 2010).
Macroeconomic variables
REGION refers to dummy variables of the region in which the MFI operates. The sample is divided into six geographic regions (Africa; East Asia and Pacific; Eastern Europe and Central Asia; Latin America and the Caribbean; the Middle East and North Africa; and Southern Asia). GROWTH is the annual GDP growth per capita of the country in which and MFI operates (Ahlin et al., 2011; Ahlin and Lin, 2006; Vanroose and D’Espallier, 2013).
REMIT refers to workers' remittances and compensation of employees as a percentage of GDP per capita (Ahlin et al., 2011; Kappel, et al., 2010).
CONCEN represents the degree of competition in the microfinance sector. It is measured using the Herfindahl-Hirschman index, which measures the level of concentration in the sector4.
PCREDIT represents the depth of the financial system measured as domestic credit to the private sector as a percentage of GDP (Ahlin et al., 2011; Demirgüç-Kunt and Levine, 2004; King and Levine, 1993; Rajan and Zingales, 1998; Westley, 2001). This ratio represents the credit granted by financial institutions to the private sector as a percentage of GDP, excluding the credit given by the central bank and development banks, or credit granted to the public sector, publicly owned companies and back-to-back loans between groups of intermediaries. STAB is the political stability index from the World Governance Indicators database, ranging from -2.5 to 2.5; that is, low to high stability (Ahlin et al., 2011).
CORRUP represents the lack of corruption index from the World Governance Indicators database. This indicator ranges from -2.5 to 2.5; in other words, from high to low corruption (Ahlin et al., 2011).
INFOR measures the coverage of the private credit bureau that reports on the number of individuals and companies with data in a private credit agency for the last five years of the loan history, calculated as a percentage of the adult population, obtained from Doing Business database (Ahlin et al., 2011).
CRIGHTS is the index representing the strength of legal rights from Doing Business database. It measures the extent to which laws protect the rights of borrowers and lenders, thus facilitating lending. This indicator varies between 0 and 10; that is, low to high protection of the rights of borrowers and lenders. (Ahlin et al., 2011).
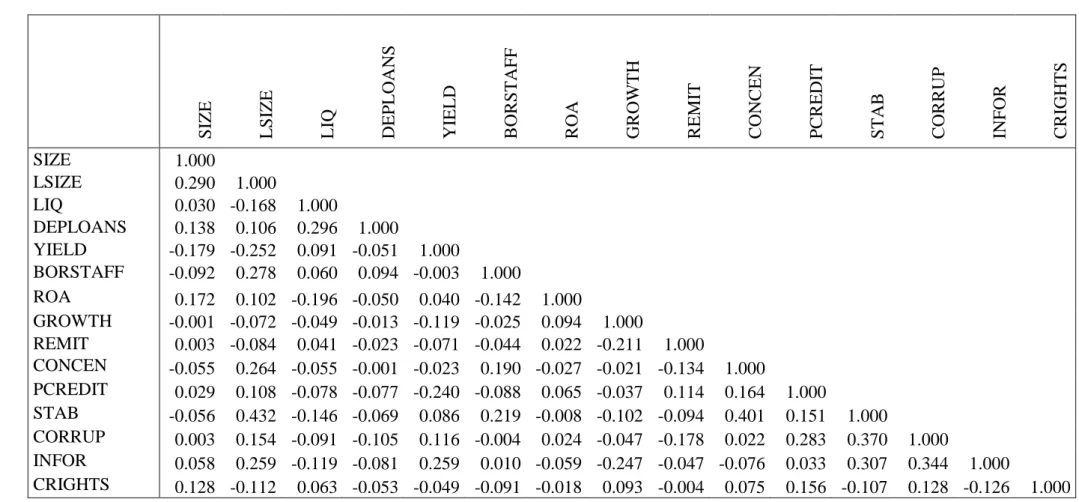
Tables 5 and 6 show the descriptive statistics and correlations between the variables.
4 The Herfindahl-Hirschman Index (HHI) is a measurement of concentration in a market. The higher the index, the more concentrated it is and therefore the less competitive the market.
15 TABLES 5 & 6
The sample size varies depending on the variables that are being used, due to the heterogeneity of the databases used.
3.3 RESULTS
The empirical analysis is carried out by estimating four models. The first one only takes into account the internal variables of the MFI; in the second, the macroeconomic variables are added to the previous model; and in the third and fourth, the institutional variables are included5. Table
7 shows the results of the four models through logit regression with random effects.
Regarding the internal variables, the results show that the ROA has a marginal effect that is significant and negative in the four estimated models. So, a high return on assets indicates a high return in the loan portfolio and that this portfolio is of better quality. This thus also leads to lower default rates and less probability of crisis. Both excess liquidity and the ratio of deposits to total loans have a positive and significant influence on the probability of crisis in the four models. Thus, increases in both variables may cause an increase in lending and/or relaxation of credit restrictions, which would increase the rate of defaults. A positive and significant relationship is also seen in all the models between the percentage of borrowers per employee and crises in microfinance institutions. Institutions with more borrowers per employee will have a poorer credit procedure and higher default rates. Finally, a positive and significant influence is seen only in model 1, between the average loan size and the probability of failure. In this sense, larger loans give a higher probability of default.
Regarding to macroeconomic and institutional variables, the results show a significant and negative relationship in models 2, 3 and 4, between economic growth and the probability of
5 The institutional variables are divided into two models. The first one includes the "political stability" and "lack of corruption" variables, which are taken from the World Governance Indicators, with observations for 2003-2011. The second includes "private credit bureau coverage" and "legal rights" variables, which are taken from Doing Business with observations only for 2005-2011.
crisis in the MFIs. If an economy of a country has a high rate of growth, companies have higher rates of profitability and borrowers have more resources to deal with the loan. There is a negative and significant relationship in models 3 and 4 between a country’s political stability and the likelihood of an MFI crisis. This indicates that microfinance institutions experience lower default rates in countries with high political stability. There is a negative and significant relationship in model 4 between the private credit bureau and the likelihood of a crisis. This relationship shows us the need to build better systems of credit information so as to prevent over-indebtedness among borrowers and thus reduce the probability of crisis in microfinance institutions. Finally, there is a positive and significant influence only in model 2, for the region and the probability of crisis, indicating a slight influence from the geographic region on the probability of an MFI crisis.
4. Conclusions
This study analyses the factors that influence the probability of a crisis in MFIs. Despite the great expansion of microfinance, there are hardly any studies on these institutions’ crises. This study analyses these crises for the first time from an econometric perspective, comparing the situation of healthy institutions to those that have problems. It also analyses macroeconomic and institutional factors that influence the financial health of these institutions.
The results indicate that the failure of an MFI, measured in terms of a Portfolio at risk and loans written-off, is significantly affected not only by internal variables but also by external factors, macroeconomic or institutional.
Regarding the internal factors, the probability of an MFI crisis is negatively related to profitability and positively to an excess of resources (too much liquidity and/or too many deposits). A high return on assets indicates high returns in a loan portfolio, and thus a better quality portfolio. That is, if the institution is managing its loan portfolio properly, this will be clearly reflected in its profitability. As for an excess of resources, if there is excess liquidity or
17 a high proportion of deposits compared to total loans, this may cause an increase in credit disbursements and/or a relaxation of credit constraints. Therefore, MFIs should bolster their mechanisms for granting and managing credit, establishing objective criteria to avoid an increase in defaults.
In addition, the number of borrowers per employee plays an important part in the probability of crisis of an MFI. An overworked staff with too many borrowers spends less time studying and checking on each client, leading to failures in lending and an increase in the default rate. For this reason, it is necessary to have risk control methods adapted to the microfinance sector in order to help these organizations’ staff manage their clients and take decisions about lending, enabling economies of scale.
Regarding external factors, the results show that the probability of crisis in a microfinance institution is lower, the higher the country’s economic growth. This is because high growth leads to higher returns in microcompanies and higher incomes for families, reducing non-payment of loans. Furthermore, new market niches and opportunities for micro-companies appear as a result of the increased demand that comes with economic growth. Lastly, growth brings with it better institutions, technological advances and increases in physical and human capital. As well as economic growth, political stability is a factor that positively affects MFIs’ financial health.
Finally, information exchange regarding the indebtedness of borrowers helps reduce the probability of crises, whether this is due to better control by the MFIs or due to a disciplinary effect on the borrowers. Unfortunately, data on credit information exchange systems in developing countries are often misleading due to the limitations of any official system over informal and semi-formal loans (Jappelli and Pagano, 2000; Luoto et al., 2007). For this reason, it is necessary to work on building better credit information systems to help study the borrowers,
preventing the latter from becoming too indebted, improving MFIs’ loan portfolios, and creating incentives for borrowers to pay back.
These findings add another element to the debate over the performance of microfinance institutions. However, this paper is based on a quantitative perspective, but it would be essential to continue with the study of microfinance institutions failure adding qualitative elements to the analysis. Although there are some empirical evidence that outreach to the poor is negatively related to efficiency of MFIs (Hermes, Lensink and Meesters, 2011), a more in deep analysis of the relationship between MFIs social goals and their success is needed. One future line of research on this topic is the analysis of the effect that loyalty has on the performance of MFIs, taking into account that customer loyalty is the primary driver of long-term financial success of a MFI (Churchill, 2000).
REFERENCES
Ahlin, C. and J. Lin. 2006. “Luck or Skill? MFI Performance in Macroeconomic Context.”
BREAD Working Paper 132.
Ahlin, C., J. Lin and M. Maio. 2011. “Where does microfinance flourish? Microfinance institutions performance in macroeconomic context.” Journal of Development Economics
95: 105-120.
Armendáriz, B. and J. Morduch. 2010. The Economics of microfinance. 2ª edn. MIT Press. Boston.
Bogan, V. L. 2012. “Capital structure and sustainability: An empirical study of microfinance institutions.” Review of Economics and Statistics 94 (4): 1045-1058.
19 Cermeño, R., J. León and G. Mantilla. 2011. Determinantes de la morosidad: un estudio panel para el caso de las cajas municipales de ahorro y crédito del Perú 2003-2010. Centro de Investigación y Docencia Económicas. División de Economía.
Chen, G., S. Rasmussen, and X. Reille. 2010. “Growth and vulnerabilities in microfinance.”
CGAP Focus Note 61.
Christen, R. 2001. “Commercialization and mission drift. The transformation of microfinance in Latin America.” CGAP Occasional Paper 5.
Christen, R. P., E. Rhyne, R. C. Vogel and C. Mckean. 1995. “Maximizing the Outreach of Microenterprise Finance: an analysis of successful microfinance programs.” USAID Program and Operations Assessment Report 10.
Copestake, J. 2007. “Mainstreaming Microfinance: Social Performance Management or Mission Drift?” World Development 35 (10): 1721-1738.
Cull, R., A. Demirgüç-Kunt and J. Morduch. 2007. “Financial Performance and Outreach: a Global Analysis of Leading Microbanks.” Economic Journal 117: 107-133.
Cull, R., A. Demirgüç-Kunt and J. Morduch. 2009. “Microfinance Tradeoffs. Regulation, Competition and Financing.” World Bank Policy Research Working Paper 5086.
Demirgüç-Kunt, A. and R. Levine, R. 2004. Financial structure and economic growth: A cross-country comparison of banks, markets, and development. The MIT press. Cambridge. Demsetz, H. 1973. “Industry structure, market rivalry, and public policy.” Journal of Law &
Economics. 16: 1-9.
Eze C.C. and U.C. Ibekwe. 2007. “Determinants of loan repayment under the indigenous financial system in Southeast Nigeria.” The Social Sciences 2 (2): 116-120.
González, A. 2007. “Resilience of Microfinance Institutions to National Macroeconomic Events: An Econometric Analysis of MFI Asset Quality.” Microfinance Information Exchange 1: 1-25.
González, A. 2010. “Is Microfinance Growing Too Fast?” MIX Data Brief 5.
Gutiérrez, J .2012. “Las Microfinanzas en el Marco de la Financiación del Desarrollo: compatibilidad y/o conflicto entre objetivos sociales y financieros.” Universidad del País
Vasco.
Gutiérrez-nieto, B., C. Serrano-Cinca and C. Mar-Molinero. 2007a. “Microfinance institutions and efficiency.” Omega International Journal of Management Science 35 (2): 131-142. Gutiérrez-Nieto, B., C. Serrano-Cinca and C. Mar-Molinero. 2007b. “Social efficiency in
microfinance institutions.” Journal of the operational research society 60 (1): 1047-119. Guttman, J. M. 2008. “Assortative matching, adverse selection, and group lending.” Journal of
development Economics 87(1): 51-56.
Hermes, N., and R. Lensink 2007. “The empirics of microfinance: what do we know?”. The Economic Journal 117(2): 1-10.
Hermes, N., R. Lensink and A. Meesters. 2011. “Outreach and efficiency of microfinance institutions”. World Development 39(6): 938-948.
Jansson, T. 2003. Indicadores de desempeño para instituciones microfinancieras. BID, Washington, D. C.
Jappelli, T. and M. Pagano. 2000. “Information Sharing in Credit Markets: A Survey.”
University of Salerno: CSEF Working Paper 36.
Kaboski, J.P. and R.M. Townsend. 2005. “Policies and impact: An analysis of village-level microfinance institutions.” Journal of the European Economic Association 3 (1): 1-50.
21 Kappel, V., A. Krauss and L. Lontzek 2010. “Over-Indebtedness and Microfinance -
Constructing an Early Warning Index.” UMM Workshop Report.
Khandker, S.R. 2005. “Microfinance and poverty: Evidence using panel data from Bangladesh.” World Bank Economic Review 19 (2): 263-286.
King, R. G. and R. Levine. 1993. “Finance and growth: Schumpeter might be right.” The quarterly journal of economics 108 (3): 717-737.
Luoto, J., C. McIntosh and B. Wydick. 2007. “Credit information systems in less developed countries: A test with microfinance in Guatemala.” Economic Development and Cultural Change 55 (2): 313-334.
Marulanda, B., L. Fajury, M. Paredes and F. Gomez. 2010. Taking the good from the bad in microfinance: lessons learned from failed experiences in Latin America. Calmeadow. Mersland, R. and R.O. Strom. 2010. “Microfinance mission drift?” World Development 38 (1):
28-36.
Morduch, J. 1999. “The microfinance promise.” Journal of Economic Literature 37 (1): 569-614.
Navajas, S. and O. Villacorta. 2012. “La sombra del trabajo: liquidaciones, quiebras y reorganizaciones de microfinancieras.” Revista de Microfinanzas y Banca Social 1: 53-66. Padilla, A. J. and M. Pagano. 2000. “Sharing default information as a borrower discipline
device.” European Economic Review 44 (10): 1951-1980.
Patten, R.H., J. K. Rosengard and D. E. Johnston. 2001. “Microfinance success amidst macroeconomic failure: The experience of Bank Rakyat Indonesia during the East Asian crisis.” World Development 29 (6): 1057-1069.
Peltzman, S. 1976. "Toward a More General Theory of Regulation." The Journal of Law and Economics 19: 211-240.
Pereira, S. and P. Mourao. 2012. “Why does the microcredit borrowing rate differ across countries? A cross-country study.” International Journal of Social Economics 39 (8): 536-550.
Pindado, J., L. Rodrigues and C. Torre. 2008. “Estimating financial distress likelihood.”
Journal of Business Research 61 (9): 995–1003.
Rajan, R. G. and L. Zingales. 1998. “Financial dependence and growth.” American Economic Review 88 (3): 559–586.
Reille, X. 2009. “The rise, fall and recovery of the microfinance sector in Morocco.” CGAP Brief. Washington D.C.
Rosenberg, R., A. Gonzalez and S. Narain. 2009. “The New Moneylenders: are the poor being exploited by high microcredit interest rates?” CGAP Occasional Paper 15.
Roslan, A. H., and M. Karim .2009. “Determinants of microcredit repayment in Malaysia: the case of Agrobank.” Humanity & Social Sciences Journal 4 (1): 45-52.
Rozas, D. 2011. Weathering the Storm: Hazards, Beacons and life lessons in microfinance crisis survival from those who have been there. Center for Financial Inclusion 11: 1-37. Sharma, M. and M. Zeller. 1997. “Repayment performance in group-based credit programs in
Bangladesh: An empirical analysis.” World development 25 (10): 1731-1742.
Stegee, J. 1998. The Rise and Fall of Corposol: Lessons Learned from the Challenges of Managing Growth. ACCION International.
Valenzuela, I. E. 2011. “Profundidad de alcance en un contexto de comercialización de las microfinanzas en el Perú.” Economía 34 (68): 33-63.
Vanroose, A. and D’Espallier, B. 2013. “Do microfinance institutions accomplish their mission? Evidence from the relationship between traditional financial sector development
23 and microfinance institutions’ outreach and performance.” Applied Economics 45: 1965-1982.
Vogelgesang, U. 2003. “Microfinance in times of crisis: the effects of competition, rising indebtedness, and economic crisis on repayment behavior.” World Development 3 (12): 2085-2114.
Westley, G. D. 2001. “Can financial market policies reduce income inequality?” Inter-American Development Bank 41498.
Wilhelm, U. 2000. Identificando los principales riesgos en las microfinanzas. Standard and Poor’s América Latina. México.
TABLES
Table 1. Sample distribution by region.
Total Africa East Asia and the Pacific Eastern Europe and Central Asia Latin America and the Caribbean Middle East and North Africa South Asia N (Observations) 4463 389 516 826 1812 224 696 n (MFIs) 832 78 102 152 319 37 144 Table 2. Sample distribution by legal status.
Total Bank Credit Union /
Cooperative NBFI NGO
Rural Bank N (Observations) 4463 396 509 1553 1770 235
n (MFIs) 832 66 110 278 325 53
Table 3. MFIs in crisis by region and year.
2003 2004 2005 2006 2007 2008 2009 2010 2011 Africa 7.1% 7.1% 9.5% 8.3% 11.4% 11.3% 13.0% 2.9% 0.0% East Asia and the
Pacific 5.6% 5.9% 9.8% 15.4% 13.8% 20.0% 12.3% 16.7% 9.1% Eastern Europe and
Central Asia 0.0% 2.5% 1.5% 0.9% 1.6% 4.2% 16.4% 14.9% 5.2% Latin America and
the Caribbean 2.6% 4.9% 6.7% 5.7% 7.0% 9.7% 13.1% 10.9% 5.9% Middle East and
North Africa 0.0% 0.0% 0.0% 12.9% 13.9% 17.1% 12.1% 7.4% 0.0% South Asia 5.3% 6.9% 7.0% 6.9% 4.5% 7.8% 9.6% 11.7% 8.6%
25 Table 4. Variable definitions.
Variable Description
SIZE Size: log (total assets)
LSIZE Loan size: log (gross loan portfolio / number of active borrowers) LIQ Liquidity: cash and banks / total assets
DEPLOANS Deposits / gross loan portfolio
YIELD Yield real: (yield on gross portfolio (nominal) – inflation rate ) / (1 + inflation rate)
BORSTAFF Borrowers per staff: Log (number of active borrowers / number of personnel)
ROA Return On Assets: (Net operating income – taxes) / average total assets REGION
Dummy variables that identify the region of the MFI (Africa, East Asia and the Pacific, Eastern Europe and Central Asia, Latin America and The Caribbean, Middle East and North Africa, South Asia)
GROWTH Annual growth in real GDP per capita (%)
REMIT Workers’ remittances and compensation of employees (% GDP) CONCEN Concentration index: Herfindahl Hirschman Index (sum of the market
shares of the MFIs squared).
PCREDIT Domestic credit to private sector (% GDP)
STAB Political stability index: Political stability and absence of violence/terrorism (-2.5 to 2.5)
CORRUP Lack of corruption index: Control of corruption (-2.5 to 2.5)
INFOR Private credit bureau coverage: Number of individuals and firms listed in a private credit bureau (% adult population)
CRIGHTS Credit rights index: legal rights of borrowers and lenders (0 to 10) Table 5. Descriptive statistics.
Variable Obs Mean Std. dev. Min Max
SIZE 4463 16.075 1.774 10.682 22.267 LSIZE 4463 6.311 1.300 -5.174 12.260 LIQ 4463 0.154 0.125 -0.019 0.891 DEPLOANS 4463 1.013 3.615 0.000 69.054 YIELD 4463 0.248 0.168 -0.247 1.209 BORSTAFF 4463 3.379 2.965 -0.707 16.276 ROA 4463 0.017 0.086 -0.894 0.526 GROWTH 4370 4.112 4.296 -16.586 33.030 REMIT 4370 7.032 7.457 0.036 49.290 CONCEN 4170 0.282 0.222 0.038 1.000 PCREDIT 4170 34.181 17.448 2.839 161.980 STAB 4170 -0.780 0.618 -2.474 1.163 CORRUP 4170 -0.556 0.351 -1.525 0.709 INFOR 3712 24.671 27.174 0.000 100.000 CRIGHTS 3712 5.050 2.226 0.000 10.000
Table 6. Correlation Matrix. S IZ E LS IZ E LI Q DE P LO AN S YI ELD B ORS TA F F R OA GROW TH R EMIT C ON C EN P C R ED IT S TA B C ORR UP IN F OR C R IG HT S SIZE 1.000 LSIZE 0.290 1.000 LIQ 0.030 -0.168 1.000 DEPLOANS 0.138 0.106 0.296 1.000 YIELD -0.179 -0.252 0.091 -0.051 1.000 BORSTAFF -0.092 0.278 0.060 0.094 -0.003 1.000 ROA 0.172 0.102 -0.196 -0.050 0.040 -0.142 1.000 GROWTH -0.001 -0.072 -0.049 -0.013 -0.119 -0.025 0.094 1.000 REMIT 0.003 -0.084 0.041 -0.023 -0.071 -0.044 0.022 -0.211 1.000 CONCEN -0.055 0.264 -0.055 -0.001 -0.023 0.190 -0.027 -0.021 -0.134 1.000 PCREDIT 0.029 0.108 -0.078 -0.077 -0.240 -0.088 0.065 -0.037 0.114 0.164 1.000 STAB -0.056 0.432 -0.146 -0.069 0.086 0.219 -0.008 -0.102 -0.094 0.401 0.151 1.000 CORRUP 0.003 0.154 -0.091 -0.105 0.116 -0.004 0.024 -0.047 -0.178 0.022 0.283 0.370 1.000 INFOR 0.058 0.259 -0.119 -0.081 0.259 0.010 -0.059 -0.247 -0.047 -0.076 0.033 0.307 0.344 1.000 CRIGHTS 0.128 -0.112 0.063 -0.053 -0.049 -0.091 -0.018 0.093 -0.004 0.075 0.156 -0.107 0.128 -0.126 1.000
Table 7. Results (1) (2) (3) (4) SIZE -0.078 -0.068 -0.097 -0.090 (-0.97) (-0.80) (-1.09) (-0.95) LSIZE 0.220* 0.160 0.219 0.178 (1.92) (1.07) (1.33) (1.02) LIQ 1.882** 1.457* 1.752** 1.750** (2.54) (1.87) (2.15) (2.00) DEPLOANS 0.080*** 0.068*** 0.063** 0.072** (3.10) (2.63) (2.39) (2.56) YIELD 0.196 0.178 0.724 1.096 (0.28) (0.23) (0.88) (1.25) BORSTAFF 0.068* 0.069* 0.079** 0.077* (1.88) (1.85) (2.06) (1.93) ROA -11.763*** -11.864*** -12.390*** -12.379*** (-10.18) (-9.59) (-9.62) (-9.15) REGION 10.36* 5.10 4.80 GROWTH -0.126*** -0.127*** -0.151*** (-5.46) (-5.25) (-5.80) REMIT -0.016 -0.019 0.003 (-0.77) (-0.74) (0.12) CONCEN -0.150 -0.012 (-0.23) (-0.02) PCREDIT 0.013 0.011 (1.34) (1.06) STAB -0.834*** -0.771** (-2.97) (-2.58) CORRUP -0.128 0.368 (-0.28) (0.75) INFOR -0.014** (-2.10) CRIGHTS 0.035 (0.46) CONSTANT -5.266 -4.154 -5.843 -5.609 (-3.90) (-2.87) (-3.60) (-3.17) N (Observations) 4463 4370 4170 3712 N (MFIs) 832 812 783 753 LR chi2(16) 137.65 151.84 153.09 145.17 Prob > chi2 0.000 0.000 0.000 0.000 (***) indicates a level of significance of 0.01 (**) indicates a level of significance of 0.05 (*) indicates a level of significance of 0.1 (t statistic between brackets)
Region: Wald’s test of the joint significance of the region's dummy variables. Distributed as a chi-square under the null hypothesis of lack of relationship.