DESIGN AND IMPLEMENTATION OF A SOFTWARE DEVELOPMENT PROCESS MEASUREMENT SYSTEM
A THESIS SUBMITTED TO
THE GRADUATE SCHOOL OF NATURAL AND APPLIED SCIENCES OF
THE MIDDLE EAST TECHNICAL UNIVERSITY
BY
ÖZGÜR ERALP
IN PARTIAL FULFILLMENT OF THE REQUIREMENTS FOR DEGREE OF MASTER OF SCIENCE
IN
THE DEPARTMENT OF ELECTRICAL AND ELECTRONICS ENGINEERING
Approval of the Graduate School of Natural and Applied Sciences
_________________________ Prof. Dr. Canan Özgen
Director
I certify that this thesis satisfies all the requirements as a thesis for the degree of Master of Science.
_________________________ Prof. Dr. Mübeccel Demirekler
Head of Department This is to certify that we have read this thesis and that in our opinion it is fully adequate, in scope and quality, as a thesis for the degree of Master of Science.
_________________________ Prof. Dr. Semih Bilgen
Supervisor Examining Committee Members
Prof. Dr. Uğur Halıcı _________________________
Prof. Dr. Semih Bilgen _________________________
Assoc. Prof. Dr. Onur Demirörs _________________________
Asst. Prof. Dr. Cüneyt Bazlamaçcı _________________________
Levent Alkışlar (Ms.) _________________________
ABSTRACT
DESIGN AND IMPLEMENTATION OF A SOFTWARE DEVELOPMENT PROCESS MEASUREMENT SYSTEM
ERALP, Özgür
MSc. , Department of Electrical and Electronic Engineering Supervisor: Prof. Dr. Semih BİLGEN
January 2004, 142 pages
This thesis study presents a software measurement program. The literature on software measurement is reviewed. Conditions for an effective implementation are investigated. A specific measurement system is designed and implemented in ASELSAN, Inc. This has involved organizational as well as technical work. A software tool has been developed to assist in aggregating measurements obtained from various CASE tools in use. Results of the implementation have started to be achieved. Lots of useful feedbacks have been returned to the organization as a result of analyzing of the measurement data.
Keywords: Software Measurement, Software Metric, PSM, GQM
ÖZ
YAZILIM GELİŞTİRME SÜRECİ İÇİN BİR ÖLÇÜM SİSTEMİ TASARIMI VE GERÇEKLEŞTİRİLMESİ
ERALP, Özgür
Yüksek Lisans, Elektrik ve Elektronik Mühendisliği Bölümü Tez Yöneticisi: Prof. Dr. Semih BİLGEN
Ocak 2004, 142 sayfa
Bu tez çalışması, bir yazılım ölçüm programını sunmaktadır. Yazılım ölçümü ile ilgili literatür incelenmiş, ve etkili bir uygulama için şartlar araştırılmıştır. ASELSAN AŞ özelinde bir ölçüm sistemi tasarlanmış ve organizasyonda uygulanmıştır. Bu, hem organizasyonel hem de teknik çalışmayı içermektedir. Kullanımdaki çeşitli CASE araçlarından elde edilen ölçüm verilerinin analizini kolaylaştırmak amacı ile bir yazılım aracı geliştirilmiştir. Uygulanan ölçüm programının sonuçlarına erişilmeye başlanmıştır. Verilerin analiz edilmesiyle, organizasyona birçok yararlı bilgi geri dönüşü gerçekleşmektedir.
Anahtar Kelimeler: Yazılım Ölçüm, Metrik, PSM, GQM
ACKNOWLEDGEMENTS I would like to thank the following people:
• Prof. Dr. Semih Bilgen, for his help, professional advice and valuable supervision during the development and the improvement stages of this thesis. This thesis would not be completed without his guidance and support.
• The members of PAT-G team in MST Division of ASELSAN Inc. that are Levent Alkışlar, Ayşın Zaim, Özgü Özköse Erdoğan, Güliz Aykut, Aydan Doğru, Zühre Yılmazer, for their contributions on this study.
• My parents, Avni and Semahat Eralp; my brother, Arda Eralp, for their great encouragement and continuous morale support.
TABLE OF CONTENT ABSTRACT ...iii ÖZ... iv ACKNOWLEDGEMENTS ... v TABLE OF CONTENT.. ... vi LIST OF FIGURES ... ix LIST OF TABLES ... xi
LIST OF ABBREVIATIONS AND ACRONYMS... xv
CHAPTER 1. INTRODUCTION...1
1.1. Measurement Process ...1
1.2. The Purpose and Scope of the Study...5
1.3. Basic Measures...6
1.4. Types of Metrics ...8
1.5. Outline ...9
2. INITIATION STAGE ...11
2.1. The Organizational Goals ...11
2.2. How? ...13
2.3. Applications At Industry ...15
2.4. At the Organization ...16
3. ANALYSIS STAGE...19
3.1. Introduction to Analysis Stage...19
3.2. Identify Project Issues...21
3.3. Prioritize Issues ...24
3.4. Mapping to Common Issues...27
3.5. Measurement Scope...30
4. DESIGN STAGE ...31
4.1. Introduction to the Design Stage ...31
4.2. Issue Measure Mapping ...33
4.3. Schedule Measures...37
4.4. Product Quality Measures ...48
4.5. Resource and Cost Measures...53
4.6. Size and Stability Measures ...59
4.7. Roles and Responsibilities ...67
4.8. Tailoring ...69
5. BUILD STAGE...71
5.1. Introduction to Build Stage...71
5.1.1. Characterize Environment...73
5.1.2. Identify Measurement Opportunities ...74
5.1.3. Specify Measurement Implementation Requirements ...75
5.2. Measurement Plan For System41 Project...77
5.2.1. Introduction ...77
5.2.2. Project Description ...77
5.2.3. Measurement Roles and Responsibilities ...77
5.2.4. Description of Project Issues...77
5.2.5. Measurement Specifications ...80
5.2.6. Reporting Mechanisms and Periodicity...97
6. IMPLEMENTATION STAGE ...98
6.1. User’s Guide for The YazOlc-Yardim Tool ...98
6.2. Historical Data Collection...99
6.2.1. Reports of Problem Report Status Measurement ...99
6.2.2. Overview of the Problem Report Status Measurement...103
6.2.3. Reports of Defects Measurement...105
6.2.4. Overview of the Defects Measurement ...110
6.2.5. Review Status Measurement ...112
6.2.6. Overview of the Review Status Measurement ...113
6.2.7. Source File and Complexity Measurements...114
7. DISCUSSION AND CONCLUSIONS ...119
REFERENCES ...127
APPENDICES ...129
A - YAZOLC-YARDIM ...129
B - MEASUREMENT REPORT ...142
LIST OF FIGURES Figure
1 - Measurement Process Life-Cycle ..………... 2 - Basic Measures ……… 3 - Types of Metrics ……….………. 4 - The Issue Identification Model ………….………... 5 – Selecting Measures ……….……… 6 – Measurement Selection Mechanism ……….………... 7 – The Three Components of a Measurement Program ………... 8 - Evolution of Project Issues ……… 9 - Sub-Tasks of Build Stage ………... 10 - An Overview of the Measurement Process……….…….. 11 - System11 Measurement Result ……….……….. 12– System60 Measurement Result ………... 13 – System20 Measurement Result ……….. 14 – Histograms of All Measurement Results ……….………. 15 – System20 Defects Measurement Results …...………... 16 – System37 Defects Measurement Results ……...……...
2 6 8 22 32 33 69 71 72 79 100 101 102 103 106 108 ix
17 – DSP SCU Measurement Result …………..……….... 18 – Control SCU Measurement Result ……..……….. 19 – DSP SCU Measurement Result ……..…..………..
113 116 118
LIST OF TABLES Table
1 - The Goals and Issues Relations………...………... 2 - The Organizational Goals and Issue(s)……..…………..……… 3 - Issue Prioritization …………..………..………. 4 - Goal and Common Issue Relation ……….………... 5 – Common and Related Issues ………….………...…… 6 – Prioritized Goals ………...……... 7 – Measurement Categories and Related Questions………...…... 8 - Common Issue Mapping to Categories….………..…… 9 - Related Issues and Measurement Categories …………...…….. 10 - I-C-M Mapping ………...…….. 11 - Schedule Measurement Candidates ….…..………..…….. 12– The Milestone Dates Measure …………...…………...………... 13 – The Requirements Status Measure ………...……….. 14 – The Problem Report Status Measure ……….…………..……. 15 – The Review Status Measure ………...………..……... 16 – The Change Request Status Measure ……...………...……... 17 – The Component Status Measure ……….………..……....
14 25 26 27 29 29 34 35 35 36 38 41 42 43 44 45 46 xi
18 – The Test Status Measure ………...………..…….. 19 – Product Quality Measurement Candidates …………..….….. 20 - The Defects Measure ………...………. 21 - The Technical Performance Measure ……..………...…..…….. 22– The Cyclomatic Complexity Measure ……….…………... 23 – Resource and Cost Measurement Candidates ………...…….. 24 – The Effort Measure ………...…………. 25 – The Staff Experience Measure ………...………... 26 – The Staff Turnover Measure ……….…...……... 27 – Product Size and Stability Measurement Candidates……... 28 – The Database Size Measure ………..……….. 29 – The Components Measure ………..………….….. 30 - The Interfaces Measure ………...………. 31 - The Source File Measure ……..………..….…..…….. 32– The Requirements Measure ………...………..………... 33 – Data Sources in MST Division ………..………...….. 34 – Common and Related Issues ……….…………. 35 – Prioritized Goals ………...……...………... 36 – Milestone Dates Specification ………..……..………...……... 37 – Requirements Status Specification………..………... 38 – Problem Report Status Specification …....…………...………..
47 48 50 51 52 54 56 57 58 60 62 63 64 65 66 75 78 78 80 81 82 xii
39 – Review Status Specification ………...…..….….. 40 - Change Request Status Specification……….. 41 - Component Status Specification ………...…..……..…….. 42– Test Status Specification ………...…..………...………... 43 – Defects Specification ………..……...….. 44 – Technical Performance Specification ………...…..……. 45 – Cyclomatic Complexity Specification ………...….…... 46 – Effort Specification ………...…...……... 47 – Staff Experience Specification………..………... 48 – Staff Turnover Specification ………...…………...…….. 49 – Database Size Specification ………...………..….….. 50 - Components Specification …………...………..………. 51 - Interfaces Specification ……..………..…..…….. 52– Source File Specification ………...…..………..………... 53 – Requirements Specification ………...…...….. 83 84 85 86 87 88 89 90 91 92 93 94 95 96 97 xiii
LIST OF ABBREVIATIONS AND ACRONYMS ASELSAN Military Electronics Industry in Turkey CASE Computer Aided Software Engineering CMM Capability Maturity Model
COTS Commercial Off-The-Shelf DSP Digital Signal Processing
GQM Goal Question Metric GUI Graphical User Interface I-C-M Issue - Category - Measure
IEC International Electrotechnical Commission ISO International Organizational for Standardization KALDER Turkish Quality Association
LOC Line of Code
MST
Microwave and System Technologies Division in ASELSAN Inc.
NASA National Aeronautics and Space Administration PAT-G One of Process Action Teams in YİE, called G PSM Practical Software Measurement
QA Quality Assurance
QIP Quality Improvement Paradigm SCU Software Configuration Unit SDD Software Design Document SDP Software Development Plan
SEL Software Engineering Laboratory SIDD Software Interface Design Document SLOC Source Lines of Code
SRS Software Requirement Specification WBS Work Breakdown Structure
YİE Software Process Group in ASELSAN Inc.
YMM Software Engineering Department in ASELSAN Inc. YT Software Test Department in ASELSAN Inc.
CHAPTER 1
INTRODUCTION
1.1. Measurement Process
Software measurement plays an important role in whole software development activities. Paul Goodman, writer of Practical Implementation of Software Metrics, claims that the role of software metrics is to enable engineers and managers to survive in today’s business environment [9]. Measures that are obtained as a result of measurement are the numbers used to create the metrics, and the metrics are the numbers turned into information. Managers need a basis for evaluating product quality and analyzing issues or problems, and a foundation for quantitative control of the project management and engineering processes. In addition, measurement provides the insight a manager needs to make decisions critical to project success [5]. Effective measurement programs help and succeed them by enabling to develop achievable plans.
In 1987 Gabriel Pall defined a process as the logical organization of people, materials, energy, equipment, and procedures into work activities designed to produce specified end results [6].
The Figure 1 indicates measurement process life-cycle ([3],[5],[9]). The stages very resemble well-known software development life-cycle steps. This fact should not be surprising, because before starting implementation, analysis and design are fundamental stages in software engineering.
Figure 1 - Measurement Process Life-Cycle
The first stage of measurement process, called “Initiation”, is described in Chapter 2 in detail. In this stage, the analyst, who can be a person or group, should understand all organizational goals clearly, since the analyst tailors measurement process in direction of these goals. If the costume is not
suitable, the organization can not put it on. Besides understanding, the analyst should obtain organizational support and required equipments for measurement program must be provided.
According to the KALDER survey in Turkey about difficulties in software measurement, the most encountered difficulties are in data collection process, organizational participation and support. The other difficulties are in analysis of the gathered data and the measurement plan [7].
In the “Analysis” stage, which is described in Chapter 3 in detail, project issues must be identified and prioritized. Also, the measurement scope should be well-defined according to project(s), and phase(s) of software life-cycle. Not excess, only adequate measures should be implemented to address those issues.
In the “Design” stage, which is described in Chapter 4 in detail, selecting appropriate measures is very critical for the measurement process. Only required and applicable measures should be implemented based on the issues and objectives of the organization. The roles and responsibilities are also identified in this stage.
The measurement roles and responsibilities bring additional costs to budget. The source of data brings 2 %, analysis and packaging brings 7 %, and technical support brings 4 % additional costs over budget approximately [4].
The output of the “Build” stage is a Measurement Plan. This plan is actively used at rest of the measurement process. This stage is described at Chapter 5 in details.
The last stage of software measurement process, called “Implementation”, is described at Chapter 6 in details. There are 3 sub-tasks in this stage.
• Collect Data: At first, the data or information should be taken from source (Access Data), then ensure that the accessed data is relevant to requirements (Verify Data), finally normalize them to use in analysis (Normalize Data) [5].
• Analyze Issues: This sub-task has some direct relations with technical adequacy, development performance, growth and stability, resources and cost, schedule and progress and product quality. Estimation produces projections of software size, effort, schedule and quality. Feasibility Analysis deals with the technical accuracy and realism of plans, estimates or assumptions. Performance Analysis determines if the project is meeting targets and goals.
• Make Decision: It includes reporting, alternative selection and action. Not every analysis result requires action [5]. The one important point is that people are the most significant factor in software measurement success [11]. While making a decision, this point should not be disregarded.
1.2. The Purpose and Scope of the Study
In this thesis study, a software measurement program has been designed, and then implemented in order to provide a software development process measurement system at YMM Departments of MST Division in ASELSAN Inc. The objective of the study is to demonstrate the viability of software measurement process life-cycle in an existing organization.
There are three key reasons for implementing a software measurement program [4].
• Understanding: The fundamental requirement is to gather information about what organization does and how it operates. Better understanding leads to better management of software projects and improvements in process. It supports the managers make correct decisions.
• Management: Measurement is intended to help the project manager, to make a reasonable decision, not to make an automatic decision. Measurement also assists management processes such as planning, estimating, tracking and validating.
• Guiding Improvement: The primary objective of any software engineering organization is to produce a high-quality product within schedule and budget. This goal can be achieved by improving the software development process. Process improvement can be accomplished by modifying managerial or technical
processes. By measurement program, the organization can find weak points in its processes.
Different levels within the same organization have different information needs. Executive managers usually make investment decisions with respect to software process technology and tools. Project managers make decisions about specific technologies and resources to best satisfy project objectives. As a result, the reason for applying software measurement usually depends on information needs.
1.3. Basic Measures
In Figure 2, the core measures and their application phases are shown clearly. The important attributes in each type of measure are addressing the three key reasons (Understanding, Managing, and Guiding Improvement) and being easy to collect and achieve.
Figure 2 - Basic Measures [4]
The basic measures are cost, errors, process characteristics, project dynamics and project characteristics [4].
• Cost: It can be used for understanding and managing software processes and products. Its scope depends on the organization’s goal. Measurement frequency is at least monthly or more frequently if needed.
• Errors: A better understanding of characteristics of software defects is necessary to reach higher quality and greater reliability. This measurement should be applied whenever the controlled unit is modified.
• Process Characteristics: It is applied at the end of acceptance testing phase. It is used for investigation of the effectiveness of various software engineering methods and techniques.
• Project Dynamics: It can be used for controlling the project dynamics that are changes in product requirements and source code. Measurement frequency can be weekly, biweekly or monthly. • Project Characteristics: It is applied at the end of acceptance testing phase. It can be broken down into 5 categories. The first is “Development Dates” which includes beginning and ending of each life-cycle phase and final project completion date. The second is “Total Effort” which includes hours used by programmers, managers and support services. The third is “Project Size” which includes total size of software product and the total number of components within the product. The fourth is “Component
Information” which includes collecting size and origin information for software components and defines components as separately compliable units. And the last is “Software Classification” as Business/Administrive, Scientific/Engineering, Embedded/Non-Embedded, Real Time/Non-Real Time, and Secure/Nonsecure.
1.4. Types of Metrics
Based on their intended use, software metrics can be classified as [3]
• Process Metrics for improving the software development and maintenance process,
• Product Metrics for improving software product, • Project Metrics for tracking and improving project.
In Figure 3, the types of quality metrics and their relationships are shown based on the ISO/IEC 9126.
Figure 3 - Types of Metrics [2]
The internal metrics can be applied to a software product during its development stages and they provide features to measure the intermediate
deliverables, and predict final product. The external metrics can only be used during the testing stage of the life cycle process and during any operational stages. The quality in use metrics measure the level of product meets the specified needs and the specified goals. This type of metrics can be used in a realistic system environment [2].
1.5. Outline
Rather than the traditional approach of separating the literature study and the description of specific application, presentation of the approach taken in a specific project realized at ASELSAN Inc. right after a review of the literature on each stage of the measurement process has been preferred in this report.
Hence, this thesis is organized as follows; each chapter is presenting a brief review of related literature, followed by a description of how each stage has been realized in ASELSAN Inc.:
• In Chapter 2, the INITIATION stage of measurement process is described in detail.
• In Chapter 3, the ANALYSIS stage of measurement process is
described in detail.
• In Chapter 4, the DESIGN stage of measurement process is described in detail.
• In Chapter 5, the BUILD stage of measurement process is described in detail.
• In Chapter 6, the IMPLEMENTATION stage of measurement process is described in detail.
• Finally, some discussion and concluding remarks are given in Chapter 7.
CHAPTER 2
2.
INITIATION STAGE
2.1. The Organizational Goals
The first stage of measurement process life-cycle is INITIATION. At this stage, the key activities are understanding organizational goals and obtaining organizational support. At the end of this stage, everyone in the organization should understand what measurement process is, and why a measurement program is required. In order to do that, a briefing was given in MST division of ASELSAN Inc.
The prerequisites for applying a software measurement program can be enumerated. These are [13]
• A cost accounting system,
• A software configuration management system, and • A problem reporting/corrective action system.
In ASELSAN Inc., the Rational’s ClearCase tool is actively used for software configuration management, and the Rational’s ClearDDTS tool is actively used for problem reporting/corrective action.
What about the reflections of these prerequisites in software industry in Turkey?
The KALDER survey has impressive results and one of them is about the software configuration management system [7]. From this survey, in approximately 35% of the firms, written procedures and standards are deployed but they are partly applied into the process. In addition, approximately 30% of the firms apply some rules but they are not written anywhere. The responsibility of software configuration management is given to project managers in approximately 70% of the firms.
The typical organizational goals are: • Increasing functionality, • Reducing cost,
• Reducing time to market (improve timing in schedule), and • Improving product quality [6].
Apart from that, the organization specific goals can be declared according to its specific structure.
Understanding the organizational goals consists of goals, objectives, and expectations.
2.2. How?
There are two studies that have terrifying results about software projects and measurement process. First was carried out in 1995 by Standish Group and included software projects status. The Standish Survey was applied over 800 software projects and the results were:
• 52.7 % were completed but incurred cost and schedule overruns, • Average cost overrun was 189%,
• Average schedule overrun was 222%, and • 31.1% of all projects were cancelled [3].
These results indicate that the software development process must be controlled anyway, and one method is measuring.
The second survey was done by Howard Rubin. The result is
• Within the 610 measurement programs in 1998, only 140 survived after two years [11].
In other words, only one of the five started measurement programs had been survived within two years.
At the first stage of measurement process life-cycle, the organizational goals and objectives are defined. At the second stage, project issues that depend on these defined goals are identified and prioritized. After doing that the appropriate measures are selected. As a result, the measures are selected by goals, objectives, and issues. To make a correct decision about measures, the organizational goals and objectives should be defined correctly at the fist
stage. Table 1 shows a vision of these stages. It can be very useful while defining goals.
Table 1 - The Goals and Issues Relations [6]
One of the most important points is that each one of the selected measures should be matched with at least one or more of the organizational goals, objectives, and issues. Conversely, each organizational goal, objective, or issue should be matched with corresponding measure(s).
GQM is one of the popular methods for selecting appropriate metrics. This method starts with defining organizational goals and objectives. The goals constitute questions. Finally, the answers of questions form the metrics. In this method, the goals must have some information about object, purpose, quality focus, viewpoint, and environment [12]. In short view,
A GOAL → [object] [purpose] [quality focus] [viewpoint] [environment]
2.3. Applications in the Industry
First application example is from Motorola [13]. They use metrics for both process improvement and in-process project control. For Motorola, measurement is not a goal; the goal is improvement with measurement, analysis, and feedback [13]. They adopt GQM model to select appropriate metrics for their measurement program.
An example of use of GQM model for defining metrics is from [13]: Goal: Decrease Software Defect Density
Question1: What is the currently known effectiveness of the defect detection process prior to release?
Metric 1: Total Defect Containment Effectiveness.
Question 2: What is the currently known containment effectiveness of faults introduced during each constructive phase of software development for a particular software product?
Metric 2: Phase Containment Effectiveness for phase i.
Second application example is from Nokia [14]. They have derived “Nokiaway” metrics program from GQM method. There are some differences between GQM and Nokiaway. GQM identification goals include characterizing projects and organizations, and identifying improvement of both measurement and GQM goals. Nokiaway uses a quality metrics library instead of defining a new set of metrics for each project. In GQM method, person who takes part in the operative tasks in measurement program is a
full-time employee, on the other hand, he is a part-time employee in Nokiaway method [14].
Each organization has special objectives and goals. The author’s opinion is that it is too hard to implement the popular methods, which are GQM and PSM, without modification. The mixture of methods can be used in the measurement program. The goal identification stage of GQM is very powerful, and the GQM goal definition, which is mentioned at the previous part, should be used. However, the selection of appropriate measures becomes very easy by using the PSM guide.
In KALDER Survey 2001 in software industry, names of the applied software measures are asked to the firms [7]. Approximately 50% of the answers contain the number of requirements, approximately 45% contain realized effort (person-hours), and approximately 40% contain software errors.
Another important question in the survey is about the obstacles in adopting the measurement process. Approximately 65% of the answers indicate big work-load and approximately 40% refer to the reluctance of staff [7].
2.4. At the Organization
ASELSAN Inc. is the biggest military electronics industry firm in Turkey; in addition the MST Division has mostly system projects. These projects include huge software components. The process and standards that contain managing and engineering activities are well defined in the organization. As
a result of the investigation in 2002 done by Undersecretariat for Defense Industries (Savunma Sanayi Müsteşarlığı), ASELSAN Inc. has obtained “Class-A” software organization qualification.
The error tracking and configuration management systems are actively used at the organization. However, the author thinks that the collected data should be analyzed more effectively. One reason of the scheduling problems in organization is lacking of detailed both software estimation and risk management. The absence of sufficient productivity analysis may be another reason. The effort is measured only as person-month, but systematic calculation of lines of code or module number hasn’t been done yet except some projects. The product performance and reliability are important points, so organizational managers indicate that they want to work on these issues and improve them.
In order to realize deployment of software measurement process in MST Division, the process action team PAT-G has been formed in organization. The members are
• L. A., Headmaster of Software Engineering Department, • A. Z., Headmaster of Software Engineering Department, • Ö. Ö. E., Technical Leader in Software Engineering, • G. A., Technical Leader in Software Testing Department, • A. D., Principal Engineer in Product Quality Department, • Z. Y., Senior Engineer in Product Quality Department,
• Ö. E., Engineer in Software Engineering Department.
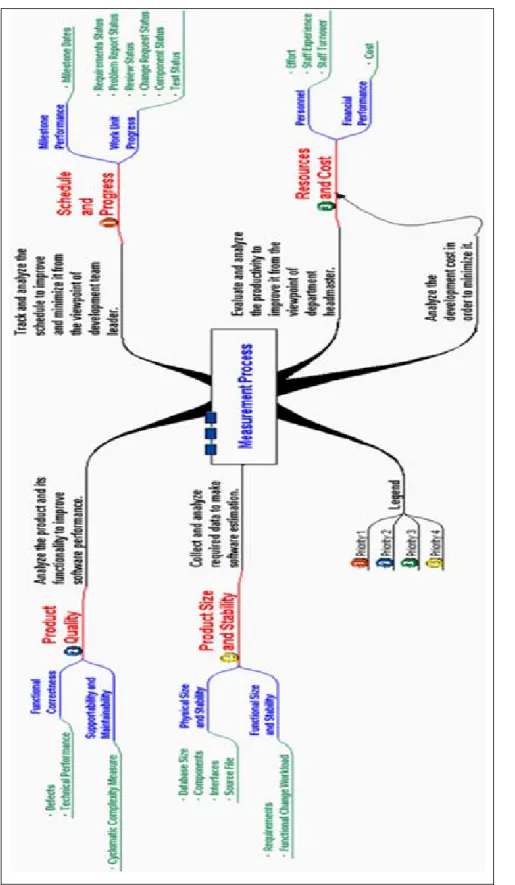
The organizational goals have been listed and prioritized respectively by members of PAT-G,
1. Track and analyze the schedule to improve and minimize it from the viewpoint of software development team leader,
2. Analyze the software product and its functionality to improve the performance,
3. Analyze the development cost in order to minimize it,
4. Evaluate and analyze the productivity to improve it from the viewpoint of department manager, and
5. Collect and analyze required data to make software estimation. Measurement is a tool to illuminate the project situation to managers [15]. This tool can be more useful and effective when one first understand exactly what one want to accomplish. The defined organizational goals contain this information.
CHAPTER 3
3.
ANALYSIS STAGE
3.1. Introduction to Analysis Stage
Quality Improvement Paradigm (QIP) is defined by V.R. Basili, famous software engineering expert, based on the reusing experience [18]. Experience can be more useful when it is recorded and suitably packaged. The Quality Improvement Paradigm is identified by steps as
1. Characterize the project and its environment,
2. Set quantifiable goals for successful project performance and improvement,
3. Choose the appropriate process model and supporting models, 4. Execute the process, construct the products, collect and validate the prescribe data, and analyze it to provide real-time feedback for corrective action,
5. Analyze the data to evaluate the current practices, determine problems, record findings, and make recommendations for future projects,
6. Package the experience in the form of updated and refined models and save it in an experience base to be reused on future projects [18].
Software measurement is a necessary component for developing experience and retrieving knowledge on software development in the Quality Improvement Paradigm.
In ASELSAN Inc., the measurement program will be firstly deployed in detail, so one of the outcomes of this thesis will be the starting point of metric-experience database.
At analysis stage, issues must be identified and prioritized. Also, the scope of measurement program should be defined.
The organizational goals and issues are related to each other tightly. In order to define project issues, it is necessary to understand what can be an issue. A problem, a risk, or a lack of information can be an issue [5].
• A problem: As an example, development team has some newly graduated members who lack sufficient skills about the project area. • A risk can be noticed but it is not certain. A risk is a potential problem. As an example, as a result of the slower than estimated speed of project development, slipping in the schedule can occur. • A lack of information means that the available information is inadequate; e.g., the lack of information about project size to be developed.
It is obvious that not all defined issues are problems. In addition, issue identification and tracking operation may protect the project from probable problems. These issues can vary from project to project, and also change over time within a given project. As a result, besides the issues defined at the beginning of the project, new issues may appear while the project carries on. Furthermore, the list of issues should be revisited periodically during the project life cycle.
In ISO 15939, accepting of requirements for measurement activity includes a clear statement that the scope of measurement shall be identified [1]. At this point, the effective questions which should be answered are:
• Which projects should be included in the organization’s measurement program?
• Which phases of the software life cycle should be included? The answers to these two questions may be a single project, two projects, and one phase of software life cycle.
• Which elements of the project staff should be included?
For example, the effort of one or more level managerial support (i.e., department manager, software development team leader) can be considered as an answer.
3.2. Identify Project Issues
In Figure 4, the model which is derived from Practical Software and Systems Measurement (version 4.0b) is shown. The difference between PSM model
and the derived model is the direct usage of defined organizational goals in the derived model. It has filtering properties in order to prevent unnecessary measures and provide measures within appropriate scope. As emphasized in the previous parts, measurement programs should be driven by organizational goals.
Figure 4 - The Issue Identification Model [5]
When performing the issue identification process, there are useful sources that can help to reveal the correct ones. The sources are [5]
• Risk Assessments: Risk assessment may point to potential requirements, technology, process, cost, and schedule issues. Risk may be identified informally in the absence of structured risk management process. Identify Project Issues Prioritize Issues Risk Assessments Map to Common Issues Constraints and Assumptions Product Acceptance Criteria Required Software Technologies External Requirements Experience The Organizational Goals 22
• The developer’s and manager’s experience with similar past projects.
• Product Acceptance Criteria: If there is a doubt about the systems capability to meet defined acceptance criteria, then satisfaction of these criteria should be marked as an issue.
• Required Software Technologies: Entire risk assessment can find out this type of issue.
• External Requirements
• Constraints and Assumptions: For example, the lack of
information about effort and schedule estimates should be treated as issues. Schedules and budgets are usually inflexible constraints so if some deviations threaten the project success then they are also issues.
The source of identified issues is mostly the lack of information to determine the state. In the relation of the identified goals at previous stage, the issues can be listed as follows.
The risks are
1. The intensive project schedule, 2. Unstable requirements,
3. Constant budget, and
4. Staff experience.
The lack of information about
5. Whether project going on schedule or not, 6. Whether scheduled milestones meeting or not, 7. Whether software product ready to delivery or not, 8. Whether all identified problems resolved or not, 9. Whether staff effort is adequate or not,
10. Whether the number of staff is adequate or not, 11. How much the requirements are changing, and 12. How much the product size is changing,
13. How much difficult the software is to maintain.
In ISO 15939, the requirement of prioritization of the identified information needs is stated clearly. The identified information needs are based on goals, constraints, risks, and problems of the organizational unit. Another important statement is that the selected measures should reflect the priority of the information needs [1].
3.3. Prioritize Issues
In Table 2, the relations between the identified organizational goals listed in Section 2.4 and issues are shown.
Table 2 – The Organizational Goals and Issue(s)
The issues have two important properties, namely their probability and impact according to [5]. Probability contains information about how likely it will result in a problem. The probability of occurrence can be expressed on a scale of 0 to 1. In addition, the impact contains information about what impact it will have on project success if occurs. A scale of 1 to 10 can be used for the impact of an issue [5].
The prioritization formula is from PSM methodology [5] as Priority = [Probability x Impact].
Table 3 is formed with average of given values from members of the PAT-G.
Goal # Related Issue(s) 1
The risk of the intensive project schedule.
The lack of information about whether project going on schedule or not. The lack of information about whether scheduled milestones meeting or not.
2
The lack of information about whether software product ready to delivery or not.
The lack of information about whether all identified problems resolved or not. The lack of information about how much difficult the software is to maintain. 3 The risk of constant budget.
4
The risk of staff experience.
The lack of information about whether staff effort is adequate or not.
The lack of information about whether the number of staff is adequate or not. 5
The risk of unstable requirements.
The lack of information about how many the requirements are changing. The lack of information about how much the product’s size is changing.
Table 3 - Issue Prioritization
ISSUE PROBABILITY IMPACT TOTAL
The intensive project
schedule 0,9 8 7,2
Unstable requirements 0,8 7 5,6
Constant budget 0,5 4 2,0
Staff experience 0,6 6 3,6
Whether project going
on schedule or not 0,7 7 4,9 Whether scheduled milestones meeting or not 0,6 7 4,2 Whether software product ready to delivery or not 0,6 7 4,2
Whether all identified problems resolved or not 0,6 X 7 = 4,2 How much difficult
the software is to
maintain 0,7 0,6 4,2
Whether staff effort is
adequate or not 0,9 8 7,2
Whether the number of staff is adequate or
not 0,6 6 3,6
How much the requirements are
changing 0,7 7 4,9
How much the product’s size is
changing 0,4 3 1,2
3.4. Mapping to Common Issues
The defined organizational goal and common issue relation is exhibited by using [5] in Table 4.
Table 4 - Goal and Common Issue Relation [5]
In Practical Software and Systems Measurement Guide, there are seven “common issue areas” which contains the most project-specific software issues based on experiences [5]. The seven common software issues are as follows:
Goal # Related Common Issue Questions Addressed
1 Schedule and Progress
-Is the project meeting scheduled milestones? -Are critical tasks or delivery dates slipping? -Is capability being delivered as scheduled in incremental builds and releases?
2 Product Quality
-Is the product good enough for delivery? -Are identified problems being resolved? -How difficult is it to maintain?
-Does the target system make efficient use of system resources?
-To what extent can the functionality be re-hosted on different platforms?
-Are operator errors within acceptable bounds? -Are failure rates within acceptable bounds? 3 Resources and Cost -Is project spending meeting budget and
schedule objectives?
4 Resources and Cost -Is effort being expended according to plan? -Is there enough staff with the required skills? 5 Product Size and Stability
-How much is the product’s size, content, physical characteristics, or interfaces changing? -How much are the requirements and
associated functionality changing?
1. Schedule and Progress issue relates to the achievement of major milestones and individual work units.
2. Resources and Cost issue relates to the balance between the work to be performed and personnel resources assigned to the project.
3. Growth and Stability issue relates to the stability of the functionality or capability required of the software.
4. Product Quality issue relates to the ability of the delivered software product to support the user’s needs without failure.
5. Process or Development Performance issue relates to the capability of the developer and the life cycle processes relative to project needs.
6. Technology Effectiveness or Technical Adequacy issue relates to the viability of the proposed technical approach.
7. Customer Satisfaction issue relates to the customer’s perception of product value.
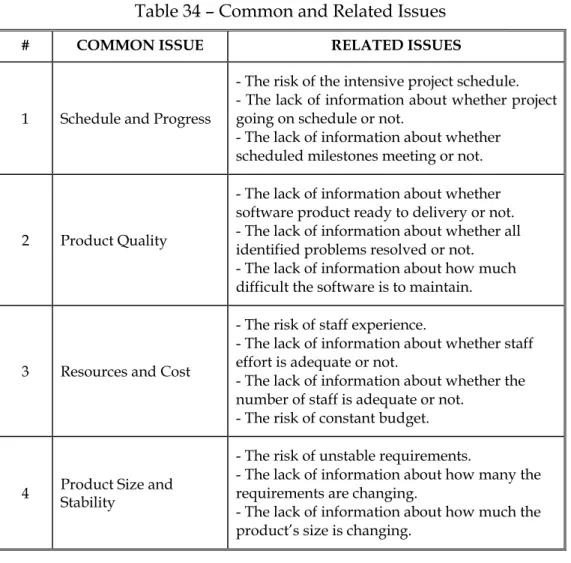
After combining prioritized issues with common issues, the Table 5 is constructed. It shows the particular relations between organizational and common issues. Table 6 relates organizational goals to common issues.
Table 5 – Common and Related Issues
Table 6 – Prioritized Goals
# COMMON ISSUE RELATED ISSUES
1 Schedule and Progress
- The risk of the intensive project schedule.
- The lack of information about whether project going on schedule or not.
- The lack of information about whether scheduled milestones meeting or not.
2 Product Quality
- The lack of information about whether software product ready to delivery or not.
- The lack of information about whether all identified problems resolved or not.
- The lack of information about how much difficult the software is to maintain.
3 Resources and Cost
- The risk of staff experience.
- The lack of information about whether staff effort is adequate or not.
- The lack of information about whether the number of staff is adequate or not.
- The risk of constant budget.
4 Product Size and Stability
- The risk of unstable requirements.
- The lack of information about how many the requirements are changing.
- The lack of information about how much the product’s size is changing.
priority GOAL Priority Common Issue
1
Track and analyze the schedule to improve and minimize it from the
viewpoint of development team leader. 5,4
Schedule and Progress
2 Analyze the product and its functionality to improve software performance. 4,2 Product Quality 3 Analyze the development cost in order to minimize it. 4,1 Resources and Cost
4
Evaluate and analyze the productivity to improve it from the viewpoint of
department headmaster. 4,1 Resources and Cost 5 Collect and analyze required data to make software estimation. 3,2 Product Size and Stability
3.5. Measurement Scope
The three questions that can be informative about which projects should be included at which phases of the software life cycle with which elements of the project staff, have been listed above in section 3.1. With the scope of this activity, all stakeholders, individuals or organizations who sponsor measurement, provide data, and use results, should be identified [5].
Two rules from [6] which can help in defining scope are “focus locally” and “start small”. It means that the answers to the questions should be as short as possible.
In ASELSAN Inc., starting one project from analysis stage of software development life cycle is considered on account of the two important rules mentioned above. In addition, the stakeholders are identified as PAT-G team and the software development team leader of the selected project.
CHAPTER 4
4.
DESIGN STAGE
4.1. Introduction to the Design Stage
The important step in establishing a measurement program is selecting the measures to be used. [4]
One of the common measurement problems is “No Measurement Plan/Design”. [19] Furthermore, measurement success critical factors are listed in [20] as following:
• Collect meaningful, valid, reliable measures, • Use consistent measures,
• Management must require and use the derived measurement information,
• Management must be willing to change the process.
The measures, which have these properties, should be clearly defined according to the related to goals. In addition, the required source data should be available [20].
When selecting measures, the next important rule is “make sure the measures apply to the goals”. They should directly relate to the defined goals of the organization. For example, if there is no goal to relate with a selected measure, it is a waste of time and effort to collect data about this measure.
Another rule is “keep the number of measures to a minimum” [4].
Steps of selecting and specifying project measures are shown in Figure 5.
Figure 5 – Selecting Measures [5]
After the analysis stage of measurement life-cycle, the issues and the common issue areas are identified and prioritized. The first step of design stage, which is identifying measurement categories, should be realized by using outputs of the previous stage. While implementing all three steps shown in Figure 5, various types of tables may be used. The tables and included information are critical elements of success of the design stage.
4.2. Issue Measure Mapping
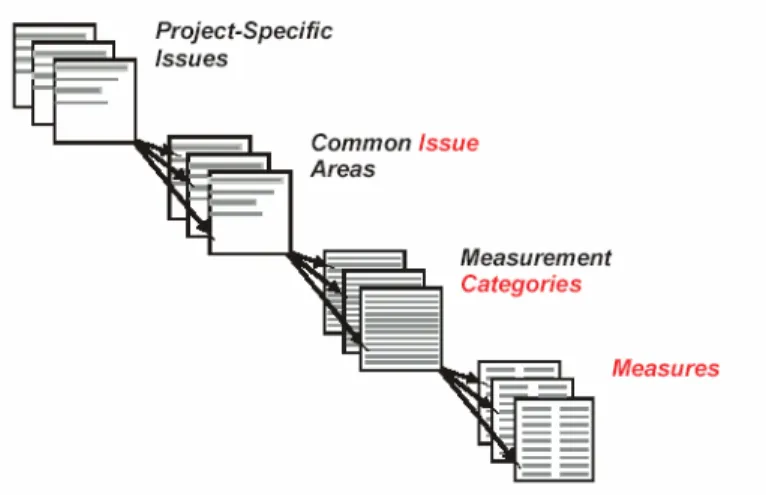
Figure 6 shows the relationship among project issues, common issue areas, measurement categories, and measures. Selecting a common issue area narrows the range of categories; also selecting a category narrows the range of measures that should be considered.
Figure 6 – Measurement Selection Mechanism [5]
One way to determine a category, which addresses an issue, is to consider the table of measurement categories and related questions as shown in Figure 7. For critical or high-priority issues, selecting more than one measurement category should be considered. This will lead to different types of measures, allowing for more effective analysis.
Using Table 5 from the previous stage and Table 7 below, common issues are mapped to measurement categories as shown in Table 8. These tables provide a link between the goals, issues or information needs and the candidate measures.
Table 7 - Measurement Categories and Related Questions [5]
Table 8 - Common Issue Mapping to Categories
# COMMON ISSUE MEASUREMENT CATEGORY
1 Schedule and Progress Milestone Performance Work Unit Progress
2 Product Quality Functional Correctness Supportability and Maintainability 3 Resources and Cost Personnel Financial Performance
4 Product Size and Stability Physical Size and Stability Functional Size and Stability
In Table 9, the relationship between the project issues and measurement category is shown and it is formed by using Table 8 and Table 5.
Table 9 - Related Issues and Measurement Categories
ISSUE MEASUREMENT CATEGORY
- The risk of the intensive project schedule. - The lack of information about whether project going on schedule.
- The lack of information about whether scheduled milestones meeting or not.
Milestone Performance Work Unit Progress
- The lack of information about whether software product ready to delivery or not. - The lack of information about whether all identified problems resolved or not. - The lack of information about how much difficult the software is to maintain.
Functional Correctness
Supportability and Maintainability
- The risk of staff experience.
- The lack of information about whether staff effort is adequate.
- The lack of information about whether the number of staff is adequate or not.
- The risk of constant budget.
Personnel
Financial Performance
- The risk of unstable requirements.
- The lack of information about how many the requirements are changing.
- The lack of information about how much the product’s size is changing.
Physical Size and Stability Functional Size and Stability
In Table 10, the whole relationship among common issues, measurement categories, and measures is shown clearly. List of the measures corresponding to selected categories is also given [5]. Description tables, where the properties of a measure are listed in detail, are very useful and suitable for a measurement program.
Table 10 – I-C-M Mapping [5]
4.3. Schedule Measures
In the previous section as shown in Table 8, the Milestone Performance and the Work Unit Progress measurement categories are selected for Schedule and Progress common issue.
The Milestone Performance measures provide basic schedule and progress information for key development activities and events. The measures also help to identify and assess dependencies among development activities. Monitoring schedule changes helps to assess the risk in achieving future milestones. This category is applicable to all types and sizes of projects, and all process models. The measures of this category do not address the amount of effort to complete a scheduled activity [5]. The measures of Milestone Performance category are shown in Table 10.
Work Unit Progress measures address progress, based on the completion of hardware and/or software work units. If objective completion criteria are defined, Work Unit Progress measures are very effective for assessing progress at any point in the project. This category is applicable to all types and sizes of projects, and all product-oriented process models [5]. The measures of Work Unit Progress category are shown in Table 10.
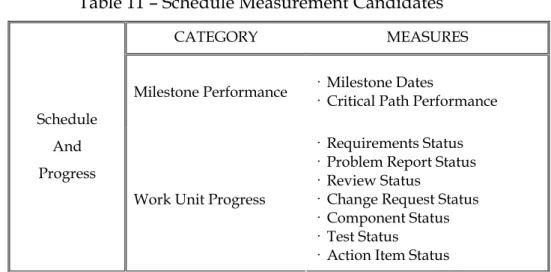
The list of candidate measures for Schedule and Progress common issues is presented in Table 11.
Table 11 – Schedule Measurement Candidates
The following decisions about candidate measures are made by the author:
CATEGORY MEASURES Milestone Performance · Milestone Dates · Critical Path Performance
Schedule And Progress
Work Unit Progress
· Requirements Status · Problem Report Status · Review Status
· Change Request Status · Component Status · Test Status
· Action Item Status
• The Milestone Dates Measure is selected as one of measures in the software measurement program, since required data for this measurement can be obtained easily from MS Project tool which is actively used at the MST-YMM departments of ASELSAN Inc. On account of the structural properties of software development process in ASELSAN Inc., the data items for this measure will be collected for each SCU (Software Configuration Unit) of project.
• In the Critical Path Performance Measure, all schedule
dependencies, and assumptions and causes of dependency between activities should be identified in order to determine and track dependent activities. Because of the decision to “focus locally and start small”, the Critical Path Performance Measure is excluded from the measurement program.
• The Requirements Status Measure is selected on grounds of applied test activities both in YMM and software test departments of MST division.
• The Problem Report Status Measure is selected on grounds of the fact that in the MST Division the most projects use a problem reporting system, whose name is ClearDDTS.
• The Review Status Measure is selected since review activities in software development process are in use at entire organization. Due to properties of the process in organization, the description and data items in PSM table may need changes.
• The change request system is actively in use at most projects in the MST Division of ASELSAN. Therefore, the Change Request Status Measure is selected.
• The Component Status Measure is selected since the necessity of configuration management system is provided in YMM departments. The required data can also be obtained from documentation process in the development.
• The Test Status Measure is selected due to similar reasons in the selection of the Requirements Status Measure. Both YMM and YT departments are applied test activities with procedural manner. • A process for identifying, handling, and tracking action items is partially available in organization, so the requirement of the
Action Item Status Measure is not achieved completely. As a result, this candidate measure is not selected.
Detailed information about the measures is given in description tables. • Table 12 contains The Milestone Dates Measure,
• Table 13 contains The Requirements Status Measure, • Table 14 contains The Problem Report Status Measure, • Table 15 contains The Review Status Measure,
• Table 16 contains The Change Request Status Measure, • Table 17 contains The Component Status Measure, • Table 18 contains The Test Status Measure,
In tables:
• Typical Data Items identifies typical data that is collected in the measure,
• Typical Attributes are characteristics or properties used to
categorize the data,
• Typical Aggregation Structure is the levels used to aggregate
data to the system levelincluding component, function,or activity,
• Counts Actuals Based On identifies typical exit criteria used to
determine when a measure is counted as an actual.
Table 12 - Milestone Dates Measure [5]
Description: Milestone Dates measures the start and end dates for activities, events, and products. The measure provides a view of scheduled activities. Comparison of plan and actual milestone dates provides insight into significant and repetitive schedule changes at the activity level.
Selection Guidance Project Application
Applicable to all sizes and types of projects. Included in most government and industry measurement practices.
Process Integration
Required data is generally obtained from project scheduling systems and/or documentation.
Detailed milestones provide a better indication of progress and allow earlier identification of problems.
If activities or events are re-planned to occur at a different time, the original dates should be retained to observe planned schedule changes.
Usually Applied During Project Planning (Estimates)
Requirements Analysis (Estimates and Actuals)
Design (Estimates and Actuals)
Implementation (Estimates and Actuals) Integration and Test (Estimates and Actuals)
Operations and Maintenance (Estimates and Actuals)
Specification Guidance Typical Data Items
Start date of activity or event End date of activity or event Typical Attributes
Activity or event name Version of the plan Increment
Typical Aggregation Structure Component
Activity
Count Actuals Based On Documents base lined Milestone review held
Successful completion of tasks
This measure answers questions such as: Is the current schedule realistic?
How many activities are concurrently scheduled?
How often has the schedule changed? What is the projected completion date for the project?
What activities, events, or products are on time, ahead of schedule, or behind schedule?
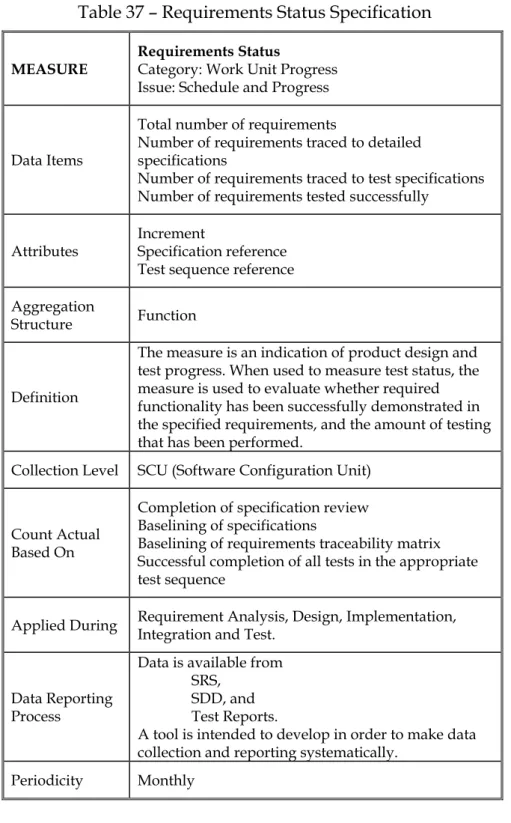
Table 13 - Requirements Status Measure [5]
Description: It counts the number of defined requirements that have been allocated to test cases, and the number that have been successfully tested. The measure is an indication of product design and test progress. When used to measure test status, the measure is used to evaluate whether required functionality has been successfully demonstrated against the specified requirements, and the amount of testing that has been performed. The measure provides excellent test coverage and is also known as "Breadth of Testing.”
Selection Guidance Project Application
Generally applicable to all sizes and types of projects with a requirements or design activity.
Process Integration
Requires disciplined requirements traceability and testing processes for successful implementation. Allocated requirements should be testable and mapped to test sequences.
Some requirements may not be testable until late in the testing process. Others are not directly testable. Some may be verified by inspection.
Usually Applied During
Requirements Analysis (Estimates) Design (Estimates and Actuals)
Implementation (Estimates and Actuals) Integration and Test (Estimates and Actuals)
Specification Guidance Typical Data Items
Total number of requirements
Number of requirements traced to detailed specifications
Number of requirements traced to test specifications
Number of requirements tested successfully Typical Attributes
Increment
Specification reference Test sequence reference Typical Aggregation Structure Function
Count Actuals Based On
Completion of specification review Baselining of specifications
Baselining of requirements traceability matrix
Successful completion of all tests in the appropriate test sequence
This measure answers questions such as: Are the requirements being tested as scheduled?
Is implementation of the requirements behind or ahead of schedule?
Table 14 - Problem Report Status Measure [5]
Description: Problem Report Status counts the number of hardware or software problems reported and resolved. This measure provides an indication of product maturity and readiness for delivery. The rates at which problem reports are written and resolved can be used to estimate product completion. This measure can also indicate the quality of the problem resolution process, based on the average age of reported problems and the average time to resolve them.
Selection Guidance Project Application
Applicable to all sizes and types of projects. Process Integration
Data is generally available, since most projects have an established problem reporting system.
On development projects, data is generally available during integration and test. Problem report data is more difficult to collect earlier (during requirements analysis, design, and implementation) because a formal problem reporting system is usually not in place and enforced.
When this data is available, it provides good progress information. An inspection or peer review can provide this information.
Projects may track the phase or source where the problem was injected and detected.
Usually Applied During
Requirements Analysis (Estimates) Design (Estimates and Actuals)
Implementation (Estimates and Actuals) Integration and Test (Estimates and Actuals)
Operations and Maintenance (Actuals)
Specification Guidance Typical Data Items
Number of problem reported Number of problem resolved Average age of problems
Average time between assignment and resolving
Average time between submission and opening
Typical Attributes Increment
Typical Aggregation Structure Component
Count Actuals Based On Problem reported
Problem resolved
This measure answers questions such as: Are open problem being closed at a sufficient rate to meet the test completion date?
Is the product maturing? When will testing be complete?
What components have the most problem reports?
Table 15 - Review Status Measure [5]
Description: The measure provides an indication of progress in completing review activities. The Review Status measure also counts the number of types of review items determined during the review process. The relationship between total identified numbers in review and total page number of reviewed software product can be established by using the results of this measure.
Selection Guidance Project Application
Used on medium to large projects. Process Integration
Easy to collect if formal reviews are a part of the development process.
Usually Applied During
Requirements Analysis (Estimates and Actuals)
Design (Estimates and Actuals)
Implementation (Estimates and Actuals) Integration and Test (Estimates and Actuals)
Specification Guidance Typical Data Items Number of reviews
Number of reviews completed successfully Number of “important” items
Number of "minor" items
Number of “incomprehensible” items Number of “total” items
Number of items which are not agreed on at meeting.
Typical Attributes
Name of the component being reviewed Increment
Typical Aggregation Structure Component
Alternatives to Reviews Include Inspections
Walkthroughs
Count Actuals Based On Completion of review
Resolution of all associated action items This measure answers questions such as: What types of review items are determined?
Table 16 - Change Request Status Measure [5]
Description: The Change Request Status measure counts the total number of change requests that affect a product. The measure provides an indication of the amount of rework that has been performed or will be required. This measure only identifies the number of changes; it does not report on the functional impact of changes or the amount of effort required to implement them.
Selection Guidance Project Application
Applicable to all sizes and types of projects. Often used on operations and maintenance programs.
Process Integration
Data should be available from most projects that put Change Requests under
configuration control. Usually Applied During
Requirements Analysis (Actuals) Design (Actuals)
Implementation (Actuals) Integration and Test (Actuals)
Operations and Maintenance (Actuals)
Specification Guidance Typical Data Items
Number of change requests generated Number of change requests resolved Typical Attributes
Increment Priority
Change classification (defect correction, enhancement)
Valid/Invalid
Typical Aggregation Structure Function
Component
Count Actuals Based On Change Request Approval Change Request Implemented Change Request Integrated Change Request Tested
Alternatives to Change Requests Include: Enhancements
Corrective Action Reports Engineering Change Proposals
This measure answers questions such as: How many change requests have impacted the product?
Are change requests being implemented at a sufficient rate to meet the schedule?
Is the trend of new change requests
decreasing as the project nears completion?
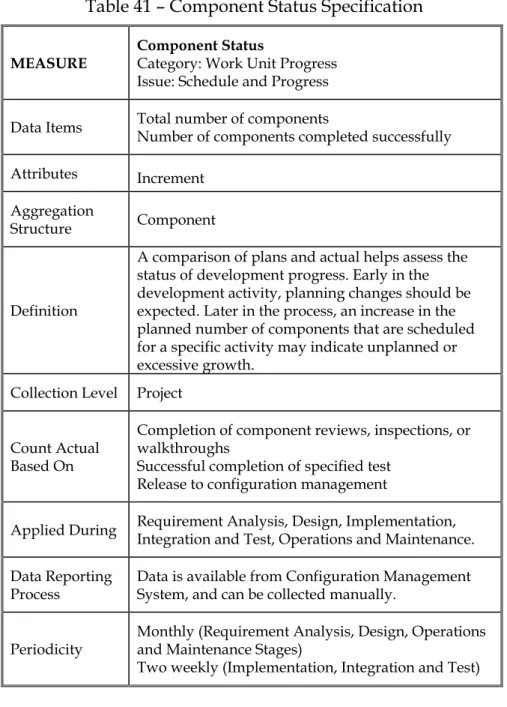
Table 17 - Component Status Measure [5]
Description: The Component Status measure counts the number of hardware or software components that complete a specific activity. A comparison of plans and actual helps assess the status of development progress. Early in the development activity, planning changes should be expected. Later in the process, an increase in the planned number of components that are scheduled for a specific activity may indicate unplanned or excessive growth. Selection Guidance
Project Application
Usually used on medium to large projects. Process Integration
Easier to collect if formal reviews,
inspections, or walkthroughs are included in the development process.
Data is sometimes available from configuration management systems or development tools.
Data is generally available if there is a mature and disciplined development process.
Component status during system test activities is generally one of the more difficult Work Unit Progress measures to collect since most integration and test activities are based on requirements or functions instead of components. Usually Applied During
Requirements Analysis (Estimates) Design (Estimates and Actuals)
Implementation (Estimates and Actuals) Integration and Test (Estimates and Actuals)
Operations and Maintenance (Estimates and Actuals)
Specification Guidance Typical Data Items
Total number of components Number of components completed successfully
Typical Attributes Increment
Typical Aggregation Structure Component
Additional Information
Progress can be measured for individual processes such as preliminary design, detailed design, implementation, component test.
Count Actuals Based On
Completion of component reviews, inspections, or walkthroughs
Successful completion of specified test Release to configuration management This answers questions such as:
Are components completing development activities as scheduled?
Is the planned rate of completion realistic? What components are behind schedule?
Table 18 - Test Status Measure [5]
Description: The Test Status measure counts the number of test cases that have been attempted and the number that have been completed successfully. This measure can be used with the Requirement Status measure to evaluate test progress. This measure helps assess product quality based on the proportion of attempted test cases that have been successfully executed.
Selection Guidance Project Application
Applicable to all sizes and types of projects. Especially important to those projects with high reliability requirements, security implications, or catastrophic failure potential.
Process Integration
Disciplined test planning and tracking processes are needed to implement this measure successfully.
There should be a mapping between defined test cases and requirements to analyze which functions are passing test and which ones are not.
Easy to collect if projects define and allocate a quantifiable number of test cases to each product test sequence.
Can utilize design or architecture information, concentrating on interfaces among components or configuration items. Usually Applied During
Integration and Test (Estimates and Actuals)
Operations and Maintenance (Estimates and Actuals)
Specification Guidance Typical Data Items Total number of test cases Number of test cases attempted Number of test cases passed Typical Attributes
Increment Test environment Test configuration
Typical Aggregation Structure Component
Count Actuals Based On
Successful completion of each test case in the appropriate test sequence
Alternatives to Test Cases Include: Test procedures
Test threads Logical paths
This measure answers questions such as: Is test progress sufficient to meet the schedule?
Is the planned rate of testing realistic? What functions have been tested or are behind schedule?
![Table 1 - The Goals and Issues Relations [6]](https://thumb-us.123doks.com/thumbv2/123dok_us/9674432.2455681/29.892.242.718.246.607/table-goals-issues-relations.webp)
![Figure 5 – Selecting Measures [5]](https://thumb-us.123doks.com/thumbv2/123dok_us/9674432.2455681/47.892.206.754.470.753/figure-selecting-measures.webp)
![Figure 7 – The Three Components of a Measurement Program [4]](https://thumb-us.123doks.com/thumbv2/123dok_us/9674432.2455681/84.892.226.745.237.725/figure-components-measurement-program.webp)
![Figure 9 - Sub-Tasks of Build Stage [5]](https://thumb-us.123doks.com/thumbv2/123dok_us/9674432.2455681/87.892.191.771.468.720/figure-sub-tasks-of-build-stage.webp)