PlateSpin
®
Recon 4.1
User Guide
Legal Notice
THIS DOCUMENT AND THE SOFTWARE DESCRIBED IN THIS DOCUMENT ARE FURNISHED UNDER AND ARE SUBJECT TO THE TERMS OF A LICENSE AGREEMENT OR A NON-DISCLOSURE AGREEMENT. EXCEPT AS EXPRESSLY SET FORTH IN SUCH LICENSE AGREEMENT OR NON-DISCLOSURE AGREEMENT, NETIQ CORPORATION PROVIDES THIS DOCUMENT AND THE SOFTWARE DESCRIBED IN THIS DOCUMENT "AS IS" WITHOUT WARRANTY OF ANY KIND, EITHER EXPRESS OR IMPLIED, INCLUDING, BUT NOT LIMITED TO, THE IMPLIED WARRANTIES OF MERCHANTABILITY OR FITNESS FOR A PARTICULAR PURPOSE. SOME STATES DO NOT ALLOW DISCLAIMERS OF EXPRESS OR IMPLIED WARRANTIES IN CERTAIN TRANSACTIONS; THEREFORE, THIS STATEMENT MAY NOT APPLY TO YOU.
For purposes of clarity, any module, adapter or other similar material ("Module") is licensed under the terms and conditions of the End User License Agreement for the applicable version of the NetIQ product or software to which it relates or interoperates with, and by accessing, copying or using a Module you agree to be bound by such terms. If you do not agree to the terms of the End User License Agreement you are not authorized to use, access or copy a Module and you must destroy all copies of the Module and contact NetIQ for further instructions.
This document and the software described in this document may not be lent, sold, or given away without the prior written permission of NetIQ Corporation, except as otherwise permitted by law. Except as expressly set forth in such license agreement or non-disclosure agreement, no part of this document or the software described in this document may be reproduced, stored in a retrieval system, or transmitted in any form or by any means, electronic, mechanical, or otherwise, without the prior written consent of NetIQ Corporation. Some companies, names, and data in this document are used for illustration purposes and may not represent real companies, individuals, or data.
This document could include technical inaccuracies or typographical errors. Changes are periodically made to the information herein. These changes may be incorporated in new editions of this document. NetIQ Corporation may make improvements in or changes to the software described in this document at any time.
U.S. Government Restricted Rights: If the software and documentation are being acquired by or on behalf of the U.S. Government or by a U.S. Government prime contractor or subcontractor (at any tier), in accordance with 48 C.F.R. 227.7202-4 (for Department of Defense (DOD) acquisitions) and 227.7202-48 C.F.R. 2.101 and 12.212 (for non-DOD acquisitions), the
government’s rights in the software and documentation, including its rights to use, modify, reproduce, release, perform, display or disclose the software or documentation, will be subject in all respects to the commercial license rights and restrictions provided in the license agreement.
© 2014 NetIQ Corporation and its affiliates. All Rights Reserved.
Contents
About This Guide 9
About NetIQ Corporation 11
1 Introduction 13
1.1 PlateSpin Recon Features . . . 13
1.2 Planning Module Features . . . 14
1.3 Supported Platforms. . . 14
1.3.1 Supported Inventory and Data Collection Platforms . . . 15
1.3.2 Supported PlateSpin Portability Suite Consolidation Sources and Targets . . . 17
1.4 Application Scenario . . . 18
1.5 PlateSpin Recon Terminology . . . 21
2 Overview of PlateSpin Recon Client Views 23 2.1 Data Center Explorer . . . 23
2.2 Report Explorer . . . 24
2.3 Projects Explorer . . . 25
2.4 Raters Explorer . . . 26
2.5 Chart Viewer. . . 27
2.6 Job Explorer . . . 27
2.7 Scheduled Job Explorer . . . 28
2.8 Log Explorer . . . 29
3 Working with Data Center Explorer 31 3.1 Understanding the Data Center Explorer . . . 31
3.2 Discovering and Inventorying Data Center Resources . . . 32
3.2.1 Inventory and Discovery Methods . . . 32
3.2.2 Inventory Credentials . . . 40
3.2.3 Inventory Options. . . 42
3.2.4 Discovery Options . . . 43
3.2.5 Viewing Inventory Data and Monitoring Servers . . . 43
3.3 Working with Filters . . . 47
3.4 Working with Groups . . . 47
3.4.1 Creating a Group . . . 47
3.4.2 Copying Servers to a Group . . . 47
3.4.3 Deleting a Server from a Group . . . 47
3.5 Working with Sites . . . 48
3.5.1 Adding a Site . . . 48
3.5.2 Deleting a Site . . . 49
3.5.3 Modifying a Site . . . 49
3.6 Working with PlateSpin Recon Snapshots . . . 49
3.6.1 Exporting a PlateSpin Recon Snapshot . . . 50
3.6.2 Importing a PlateSpin Recon Snapshot . . . 51
3.7 Working with Remote Data. . . 51
3.10.1 Using Formulas to Convert Metrics to Counters . . . 55
3.10.2 Example Formulas . . . 56
3.10.3 Working with HP Reporter Data. . . 57
3.11 Using Performance Data Import to Import Generic Data into PlateSpin Recon . . . 58
3.11.1 Performance Data Import Tables Data Structure . . . 58
3.11.2 Preparing Data for Import into PlateSpin Recon . . . 59
3.12 Collecting Disk Utilization Counters for Windows Machines . . . 61
3.12.1 Deploying an Add-On . . . 61
3.12.2 Undeploying an Add-On . . . . 63
3.12.3 Using Windows Disk Counters Add-on . . . 64
3.12.4 Using WindowsBlockBasedDiskCounters Add-on . . . 64
4 PlateSpin Recon Server and Client Tools 67 4.1 Server and Client Options . . . 67
4.2 Credentials Manager . . . 67
4.2.1 Creating a Credential . . . 68
4.2.2 Deleting a Credential . . . 69
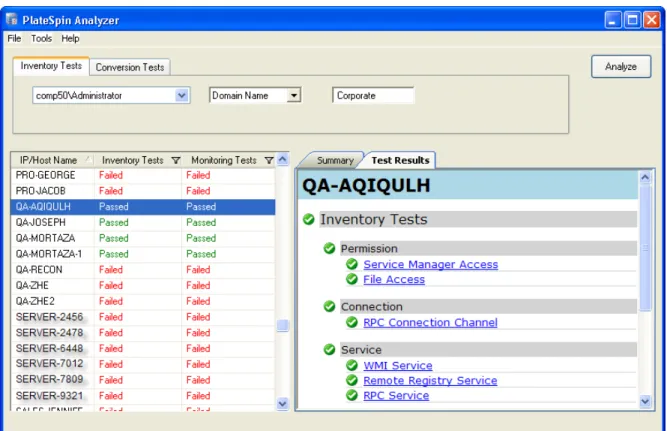
4.3 PlateSpin Analyzer . . . 69
4.3.1 Using PlateSpin Analyzer . . . . 69
4.3.2 Inventory and Monitoring Tests . . . 71
4.3.3 Conversion Tests . . . 72
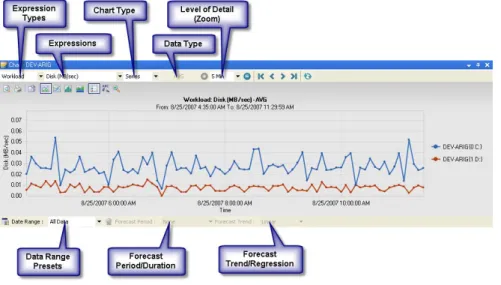
5 Generating and Viewing Charts and Reports 73 5.1 Chart Viewer. . . 73
5.1.1 Chart Controls and Commands . . . 74
5.1.2 Expression Types . . . 75
5.1.3 Level of Detail . . . 75
5.1.4 Data Type Statistics . . . 76
5.1.5 Server Instance . . . 76
5.1.6 Date Range Presets. . . 76
5.1.7 Forecasting . . . 76
5.2 Report Explorer . . . 77
5.2.1 Report Explorer Template Nodes. . . 77
5.2.2 Commands . . . 80
5.2.3 Analysis Reports . . . 81
5.2.4 VM Disk Partition Alignment Reports. . . 81
5.2.5 Working with Report Templates . . . 84
5.3 Editing Report Templates . . . 85
5.3.1 Report Template Option Tabs . . . 85
5.3.2 Chargeback Report Templates . . . 91
5.3.3 Consolidation Report Templates . . . 91
5.3.4 Consolidation Project Samples Report Templates. . . 92
5.3.5 Diagnostics Report Templates . . . 92
5.3.6 Disk Report Templates. . . 92
5.3.7 Inventory Report Templates . . . 93
5.3.8 Reclamation Report Templates . . . 93
5.3.9 Software Report Templates . . . 93
5.3.10 Virtual Infrastructure Report Templates . . . 93
5.3.11 Volume Report Templates . . . . 94
5.4 View Customization . . . 94
5.4.1 Creating and Editing Report Views . . . 94
5.4.2 Histogram Charts . . . 96
5.4.3 Scatter Charts . . . 97
5.4.4 Usage Charts . . . 98
5.5 Generating Reports . . . 98
5.6.1 Commands . . . 102
5.6.2 Customizing Reports . . . 103
5.6.3 Viewing Reports. . . 106
5.6.4 Printing and Exporting Reports . . . 107
5.6.5 Copying Servers from a Report to a Group . . . 108
6 Server Consolidation 109 6.1 About Server Consolidation . . . 109
6.2 Creating Projects . . . 110
6.3 Creating and Editing Server Templates . . . 111
6.3.1 Creating a New Server Template . . . 111
6.3.2 Editing an Existing Server Template . . . 114
6.3.3 Copying a Server Template . . . 116
6.4 Identifying Consolidation Candidates . . . 116
6.5 Working with Consolidation Scenarios . . . 116
6.5.1 Determining the Minimum Number of Servers. . . 117
6.5.2 Specifying the Number of Servers . . . 119
6.5.3 Results of Consolidation Scenarios . . . 121
6.5.4 Editing Scenarios . . . 122
6.5.5 Deleting Scenarios. . . 123
6.6 Generating Inventory Reports . . . 123
6.6.1 Finding Servers That Meet the Consolidation Criteria . . . 123
6.6.2 Selecting Candidates for Consolidation . . . 123
6.7 Viewing Consolidation Reports . . . 124
6.7.1 Project Report . . . 125
6.7.2 Scenario Summary Report . . . 125
6.7.3 Workload Assignment Report . . . 127
6.7.4 Unconsolidated Workload Report . . . 128
6.7.5 Unprotected Workload Report . . . 128
6.8 Implementing Scenarios with Portability Suite . . . . 129
6.8.1 Implementing Phantom or Existing Target Servers . . . 130
7 IT Chargeback 131 7.1 Understanding Chargeback . . . 131
7.2 Using Raters . . . 131
7.2.1 Rater Resources . . . 132
7.2.2 Rater Charges . . . 133
7.2.3 Virtual Server Rater Methods. . . 133
7.3 Managing Raters . . . 134
7.3.1 Creating a Rater . . . 134
7.3.2 Deleting a Rater . . . 135
7.3.3 Editing a Rater . . . 135
7.3.4 Attaching Raters to Machines . . . 136
7.3.5 Detaching a Rater from a Machine . . . 137
7.4 Chargeback Reporting . . . 137
7.4.1 Generating a Report to Calculate IT Chargeback Cost . . . 137
7.4.2 Deriving the Calculated Cost . . . 137
8 Virtual Infrastructure Management 141 8.1 Virtual Center Inventory and Monitoring. . . 141
8.2 VM Sprawl Reporting . . . 143
A Troubleshooting 145
B Technical Reference 165
B.1 Features . . . 165
B.2 How PlateSpin Recon Collects Data . . . 165
B.2.1 Discovery . . . 166
B.2.2 Inventory . . . 166
B.2.3 Monitoring . . . 167
B.3 Data Collection . . . 168
B.4 Charts and Formulas . . . 169
B.4.1 Chart Data . . . 169
B.4.2 Utilization . . . 173
B.4.3 Workload . . . 174
B.5 Calculations . . . 176
B.5.1 24-Hour Profile. . . 176
B.5.2 Dual-Core and Multi-Core Machines . . . 177
B.5.3 Hyper-Threading . . . 178
B.5.4 Effective Speed . . . 178
B.5.5 Power and Cooling . . . 179
B.5.6 CO2 Emission . . . 179
B.5.7 Disk Block Writes . . . 179
B.6 CPU Normalization. . . 179
B.6.1 SPEC Data . . . 180
B.6.2 Normalization Speed . . . . 180
B.7 PlateSpin Recon VM CPU Inventory . . . 180
B.8 Inventory and Monitoring Commands for AIX, Linux, Solaris and Windows . . . 181
B.8.1 Inventory Commands for AIX. . . 181
B.8.2 Inventory Commands for Linux . . . 182
B.8.3 Inventory Commands for Solaris . . . 183
B.8.4 Inventory and Monitoring Commands for Windows . . . 184
B.8.5 Monitoring Commands for AIX. . . 184
B.8.6 Monitoring Commands for Linux and Solaris . . . 185
B.8.7 Text Processing . . . 185
B.9 Sudo Configuration to Inventory and Monitor Linux Machines. . . 186
B.10 Managing Credentials . . . 186
C Schedule Options 187 C.1 Later . . . 187
C.2 Recurrence. . . 187
D Quick Reference to PlateSpin Recon Icons and Commands 189 D.1 Data Center Explorer . . . 189
D.1.1 Data Center Icons . . . 189
D.1.2 Data Center Icon Status Indicators . . . 189
D.1.3 Data Center Commands and Associated Icons . . . 190
D.2 Reports Explorer . . . 192
D.3 Projects Explorer . . . 192
D.3.1 Project Explorer Commands . . . 192
D.3.2 Project Explorer Icons . . . 193
D.4 Raters Explorer . . . 193
D.5 Chart Viewer. . . 194
D.6 Job Explorer . . . 195
D.7 Scheduled Job Explorer . . . 195
E Best Practices 197
About This Guide
This documentation provides information about PlateSpin Recon. Chapter 1, “Introduction,” on page 13
Chapter 2, “Overview of PlateSpin Recon Client Views,” on page 23 Chapter 3, “Working with Data Center Explorer,” on page 31
Chapter 4, “PlateSpin Recon Server and Client Tools,” on page 67 Chapter 5, “Generating and Viewing Charts and Reports,” on page 73 Chapter 6, “Server Consolidation,” on page 109
Chapter 7, “IT Chargeback,” on page 131
Chapter 8, “Virtual Infrastructure Management,” on page 141 Appendix A, “Troubleshooting,” on page 145
Appendix B, “Technical Reference,” on page 165 Appendix C, “Schedule Options,” on page 187
Appendix D, “Quick Reference to PlateSpin Recon Icons and Commands,” on page 189 Appendix E, “Best Practices,” on page 197
Audience
This guide is intended for IT staff, such as data center administrators and operators, who use PlateSpin Recon in data center management and planning.
Additional Documentation
This guide is part of the PlateSpin Recon documentation set. For a complete list of publications supporting this release, visit the PlateSpin Recon documentation at the NetIQ documentation Web site (http://www.netiq.com/documentation/).
For help with third-party vendor products or documentation, please contact your sales or support representative for those products.
Documentation Updates
For the most recent version of the PlateSpin Recon documentation, see NetIQ documentation Web site (http://www.netiq.com/documentation/).
About NetIQ Corporation
We are a global, enterprise software company, with a focus on the three persistent challenges in your environment: Change, complexity and risk—and how we can help you control them.
Our Viewpoint
Adapting to change and managing complexity and risk are nothing new
In fact, of all the challenges you face, these are perhaps the most prominent variables that deny you the control you need to securely measure, monitor, and manage your physical, virtual, and cloud computing environments.
Enabling critical business services, better and faster
We believe that providing as much control as possible to IT organizations is the only way to enable timelier and cost effective delivery of services. Persistent pressures like change and complexity will only continue to increase as organizations continue to change and the technologies needed to manage them become inherently more complex.
Our Philosophy
Selling intelligent solutions, not just software
In order to provide reliable control, we first make sure we understand the real-world scenarios in which IT organizations like yours operate — day in and day out. That's the only way we can develop practical, intelligent IT solutions that successfully yield proven, measurable results. And that's so much more rewarding than simply selling software.
Driving your success is our passion
We place your success at the heart of how we do business. From product inception to
deployment, we understand that you need IT solutions that work well and integrate seamlessly with your existing investments; you need ongoing support and training post-deployment; and you need someone that is truly easy to work with — for a change. Ultimately, when you succeed, we all succeed.
Our Solutions
Identity & Access Governance Access Management
Security Management
Systems & Application Management Workload Management
Contacting Sales Support
For questions about products, pricing, and capabilities, contact your local partner. If you cannot contact your partner, contact our Sales Support team.
Contacting Technical Support
For specific product issues, contact our Technical Support team.Contacting Documentation Support
Our goal is to provide documentation that meets your needs. The documentation for this product is available on the NetIQ Web site in HTML and PDF formats on a page that does not require you to log in. If you have suggestions for documentation improvements, click comment on this topic at the bottom of any page in the HTML version of the documentation posted at www.netiq.com/
documentation. You can also email [email protected]. We value your input and look forward to hearing from you.
Contacting the Online User Community
NetIQ Communities, the NetIQ online community, is a collaborative network connecting you to your peers and NetIQ experts. By providing more immediate information, useful links to helpful resources, and access to NetIQ experts, NetIQ Communities helps ensure you are mastering the knowledge you need to realize the full potential of IT investments upon which you rely. For more information, visit community.netiq.com.
Worldwide: www.netiq.com/about_netiq/officelocations.asp
United States and Canada: 1-888-323-6768
Email: [email protected]
Web Site: www.netiq.com
Worldwide: +1-416-203-4799
North America: +1 800 858 4000
Email: [email protected]
1
1Introduction
PlateSpin Recon provides intelligence, visual analysis, and forecasting for consolidating and optimizing the data center. It collects hardware, software, and service inventory data for server workloads. PlateSpin Recon can remotely gather workload utilization statistics for a clear and concise picture of the application services running in the data center, and to determine how resources are being used.
The PlateSpin Recon Consolidation Planning module determines the optimal fit between server resource supply and workload demand. It helps you visualize the characteristics of server workloads before and after consolidation, determine the servers required for consolidation, and expedite projects by automatically generating consolidation plans. You can also protect servers by allocating them to a suitable virtual recovery environment in case of a service outage.
PlateSpin Recon includes other features such as Virtual Infrastructure Management capabilities and resource utilization-based IT chargeback system. These can be used to help cope with the
challenges presented by the virtualization and consolidation of the data center. Section 1.1, “PlateSpin Recon Features,” on page 13
Section 1.2, “Planning Module Features,” on page 14 Section 1.3, “Supported Platforms,” on page 14 Section 1.4, “Application Scenario,” on page 18
Section 1.5, “PlateSpin Recon Terminology,” on page 21
1.1
PlateSpin Recon Features
Remote Data Collection: PlateSpin Recon does not require the installation of agent software, eliminating the need to physically touch data center servers. All performance and inventory data is collected via standard OS instrumentation capabilities.
Rich Data Modeling: Helps you make consolidation choices based on sophisticated analysis of resources, workloads, and utilization trends. Tight integration with VMware VirtualCenter provides greater visibility into virtual infrastructures, thereby improving data center management and operations.
Custom Report Creation and Delivery: Helps you define resource and workload parameters and generate custom visual reports for data center assessments and server consolidations. You can quickly identify consolidation candidates based on resource utilization trends and compare workload characteristics before and after consolidation. Scheduled report delivery via email or FTP ensures easy access to remote data and provides up-to-date information.
Flexible Data Capture and Export: You can export PlateSpin Recon data to a number of formats, including HTML, PDF, Word, CSV, Excel, or images. Raw data can be extracted directly from the database and delivered to business intelligence applications for advanced statistical analysis.
Enterprise-Level Scalability: Each instance of PlateSpin Recon can monitor up to 1,500 servers to ensure enterprise scalability for the world’s largest data centers. Data can be aggregated from multiple PlateSpin Recon data collectors for centralized data warehousing, analysis, and planning, or to accommodate larger enterprise implementations.
Multiple-Data Center Support: You can use PlateSpin Recon in different geographical locations to remotely collect data and provide scheduled updates to a master PlateSpin Recon installation. This allows for centralized analysis and planning for initiatives such as server or data center consolidation.
Flexible Chargeback Reporting: Because virtualization creates a shared pool of computing resources, it can be difficult to manage and monitor virtual resource usage. PlateSpin Recon enables organizations to effectively allocate and share virtual resources across business units and
departmental owners. Flexible chargeback reporting capabilities improve virtual infrastructure management and financial accounting by allowing organizations to accurately calculate IT costs based on actual resource usage.
VM Growth Reporting: You can generate reports to monitor the proliferation of virtual machines and avoid the administrative headaches associated with virtual infrastructure sprawl.
1.2
Planning Module Features
Planning: You can automatically generate server consolidation and disaster recovery plans based on detailed workload analysis to ensure the optimal fit between server workloads and virtual resources. Use forecasted data to plan for and accommodate future growth.
Workload Analysis: The PlateSpin Recon Planning Module automatically analyzes the five critical workload dimensions, which includes processor, memory, disk space, disk I/O, and network I/O, simultaneously across thousands of servers and provides consolidation plans that maximize utilization while minimizing resource contention.
Scenario Modeling: You can use custom scenarios with user-defined target server specifications, including server templates or existing virtual machine servers to create an optimal consolidation plan.
Power and Cooling Analysis: You can compare and contrast potential power and cooling cost savings and ROI derived from different consolidation scenarios. Custom fields (maintained in a central database) let you input power and cooling requirements for major hardware platforms. This feature lets organizations analyze and cost-justify green computing initiatives.
Time-Based Analysis: You can stagger multiple workloads evenly across virtual hosts and account for hourly peaks and valleys inherent in server utilization trends.
Workload and Utilization Forecasting: You can predict future workloads and resource utilization based on historical trends to better plan for server consolidation and infrastructure growth, as well as enable more proactive systems management. Forecasting data on CPU, disk, memory, and usage trends is presented in easy-to-read charts, reports, and plans.
1.3
Supported Platforms
Section 1.3.1, “Supported Inventory and Data Collection Platforms,” on page 15
Section 1.3.2, “Supported PlateSpin Portability Suite Consolidation Sources and Targets,” on page 17
NOTE
For information on PlateSpin Recon Client/Server supported platforms, see “System Requirements” in the PlateSpin® Recon 4.1 Getting Started Guide.
1.3.1
Supported Inventory and Data Collection Platforms
PlateSpin Recon supports discovery, inventory, and data collection (monitoring) for the Microsoft Windows, UNIX/Linux, and Novell Netware platforms. This section details the supported versions and architectures of the supported platforms.
“Supported Microsoft Windows Versions” on page 15 “Supported UNIX/Linux Versions” on page 15 “Supported Novell NetWare Versions” on page 16 “Supported Hypervisors” on page 17
Supported Microsoft Windows Versions
PlateSpin Recon supports the French, German, and Japanese localized versions of Windows.
IMPORTANT: Ensure that Microsoft .NET Framework 2.0 or later is installed on the target Windows machine where you want to deploy the WindowsBlockBasedDiskCounters add-on.
Table 1-1 Supported Windows Platforms
1 Inventorying and monitoring of Windows Server 2000 (SP4, SP3, SP2, SP1, SP0) machines is
not supported if PlateSpin Recon Server is installed on a Windows Server 2008 R2 machine.
Supported UNIX/Linux Versions
Table 1-2 Supported UNIX/Linux Platforms
Version Bit Spec
Windows Server 2012 R2 64-bit
Windows Server 2012 64-bit
Windows 8.1 32-bit, 64-bit
Windows 8 32-bit, 64-bit
Windows Server 2008 R2 (SP1, SP0) 64-bit
Windows Server 2003 R2 (SP2 SS/ES, SP1 SS/ES) 32-bit, 64-bit
Windows Server 2008 (SP2, SP1) 32-bit, 64-bit
Windows Server 2003 (SP2, SP1, SP0) 32-bit, 64-bit
Windows Server 20001 (SP4, SP3, SP2, SP1, SP0) 32-bit
Windows NT 4.0 Server (SP6a - WMI Core version 1.5 required, SP6, SP4) 32-bit
Windows XP Professional (SP3, SP2, SP1, SP0) 32-bit, 64-bit
Supported Novell NetWare Versions
Table 1-3 Supported Novell NetWare Platforms
IMPORTANT
To enable monitoring of NetWare computers, download and install the following Novell Clients on the PlateSpin Recon server computer. The client downloads are free. When installing, select
Custom Installation and install the Novell Modular Authentication Service (NMAS) client. Novell Client 4.91 SP5 (http://download.novell.com/Download?buildid=qmMAWSRy5q4~) Novell Client 4.91 Post-SP5 NWFS.SYS (http://download.novell.com/
Download?buildid=m7NbjoMFSxU&donotredirect=true)
Installation of the Novell Client impacts the standard Windows logon. See the Novell Client documentation for more information.
Novell Open Enterprise Server (OES) 11 SP2, 11 SP1 32-bit, 64-bit
Novell Open Enterprise Server (OES) 11 Linux 64-bit
Novell Open Enterprise Server (OES) 2 SP3 Linux 32-bit, 64-bit
Novell SUSE Linux Enterprise Server (SLES) 11 SP3, 11 SP2, 11 SP1, 11, 10 SP3, 10 SP2, 10 SP1, 10.0, 9.x
32-bit, 64-bit
Red Hat Enterprise Linux 6.5 ES, 6.4 ES, 6.3 ES, 6.2 ES, 6.1 ES, 6.0 ES, 5.10 ES, 5.9 ES, 5.8 ES, 5.7 ES, 5.5 ES, 5.4 ES, 5.3 ES, 5.2 ES, 5.1 AS/ES, 5.0 AS/ES, 4.0 AS/ES, 3.0 AS/ES
32-bit, 64-bit
Novell SUSE Linux 8.0 32-bit
RedHat Linux 9.2, 9.1, 9.0, 8.0, 7.3 32-bit, 64-bit
RedHat Enterprise Linux 2.x AS/ES 32-bit
Novell OpenSUSE 12.1, 11.4, 11.1, 11, 10.3, 10.2, 10.1 32-bit, 64-bit
Fedora Core 10, 9, 8, 7, 6, 5, 4, 3 32-bit, 64-bit
CentOS 2.0 32-bit
Ubuntu 12.04, 11.10, 8.10, 8.04, 7.1 32-bit, 64-bit
CentOS 6.2, 6.1, 5.2, 5.1, 4.6, 3.9 32-bit, 64-bit
Sun Solaris 10, 9, 8 (SPARC/x86) 32-bit, 64-bit
Sun Solaris 7 (SPARC) 32-bit
IBM AIX 6.1, 5.3 TL7 or later, 5.2 32-bit, 64-bit
Version Bit Spec
Novell NetWare 6.5 (SP6) 32-bit, 64-bit
Novell NetWare 6.0 (SP5) 32-bit, 64-bit
Novell NetWare 5.1 (SP8) 32-bit, 64-bit
You cannot monitor Netware machines with PlateSpin Recon server installed on a 64-bit Windows Server 2003 machine because Novell Client is not supported on a 64-bit Windows Server 2003 computer.
Only the CPU and disk utilization counters are supported for Netware 5.1 and 6.0. Only the CPU, disk, and memory utilization counters are supported for Netware 6.5 and higher.
Supported Hypervisors
Table 1-4 Supported Hypervisors
1.3.2
Supported PlateSpin Portability Suite Consolidation
Sources and Targets
Consolidation scenarios for workloads with the supported operating systems and targets can be implemented by using PlateSpin Portability Suite. PlateSpin Portability Suite is now PlateSpin Migrate. For detailed information about the PlateSpin Migrate supported source and target operating systems, see the PlateSpin Migrate documentation at the NetIQ documentation Web site (https:// www.netiq.com/documentation/).
For more detailed information about source and target operating systems for PlateSpin Portability Suite conversions, see Knowledge Base article Q7005871 (http://www.netiq.com/support/kb/
Version Bit Spec
Windows Server 2012 R2 Hyper-V Windows Server 2012 Hyper-V
VMware Virtual Center 5.5 Update 2, 5.5 Update 1, 5.5, 5.1, 5.0 Update 2, 5.0 Update 1, 5.0, 4.1, 4, 2.5, 2.0.2, 2.0.1
VMware ESXi Server 5.5 Update 2, 5.5 Update 1, 5.5, 5.1, 5.0 Update 2, 5.0 Update 1, 5.0, 4.1 64-bit
VMware ESX Server 4.1 64-bit
VMware ESXi Server 4i, 3i 32-bit, 64-bit
VMware ESX Server 4.0, 3.5.0, 3.0.3, 3.0.2, 3.0.1, 3.0.0, 2.5.5, 2.5.4, 2.5.3 32-bit, 64-bit
Xen on Novell SLES 11 SP2, 11 SP1,11, 10.3, 10.2, 10.0 32-bit, 64-bit
Windows Server 2008 (SP2, SP1) Hyper-V 64-bit
Windows Server 2008 R2 Hyper-V 64-bit
Sun Solaris 10 Zones on Sun Solaris 10 Container 32-bit, 64-bit
Citrix XenServer 5.0, 4.1 32-bit, 64-bit
VMware GSX Server 3.2 (for Windows) 32-bit, 64-bit
VMware 1.x+ (for Windows) 32-bit, 64-bit
Virtual Server 2005 (version 1.0) All editions. Virtual Server 2005 R2 (SP1)
For more information about implementing consolidation scenarios with Portability Suite, see Section 6.8, “Implementing Scenarios with Portability Suite,” on page 129.
1.4
Application Scenario
PlateSpin Recon and PlateSpin Portability Suite combine to form the only suite that automates the entire capacity planning and server consolidation project from start to finish. The following table illustrates how to assess, design, and implement a solution for optimizing and consolidating the data center.
Table 1-5 Data Center Optimization and Consolidation Workflow
Action Process Description Solution
Assess 1. Inventory Remotely discover server
hardware and software assets across the data center
Gather detailed information for each server such as operating system, installed and running applications or services, patch levels, CPU, memory, network and disk resources
Connect to the network, then select relevant computers or domains; data on hardware and resources is collected in a centralized database
Organize servers by predefined and user-defined groupings for organized analysis
PlateSpin Recon: Remotely and agentlessly identify server resources and workloads in the data center and create a complete picture of hardware and software inventory, utilization levels, and workload sizes
Assess 2. Collect Identify workloads and collect utilization data over days, weeks, or months to determine workload sizes and appropriate resource matching
Create dynamic reports to identify workload and resource mismatch and identify candidate
workloads for consolidation or resource upgrade
Rank and sort server workloads by CPU, network, disk, memory inventory, or performance
View summary workload sizing data or drill down to point-in-time granular levels
Collect and analyze data from multiple sites to create a more complete picture of the data center
Export the data to third-party tools or copy visual graphs to business presentations
PlateSpin Recon: Remotely and agentlessly identify server resources and workloads in the data center and create a complete picture of hardware and software inventory, utilization levels, and workload sizes
Design 3. Analyze Identify virtualization candidates
Create scenarios for distributing workloads across servers to maximize utilization
Balance application workloads over time and across hardware resources to minimize resource contention
Use “what-if” modeling to determine different combinations of hardware and virtual hosts required for the project
Generate consolidation or disaster recovery plans with detailed project, scenario, and workload assignment reports and charts
Compare different scenarios based on total cost of ownership, consolidation ratio, rack space, and power needs
PlateSpin Recon: Generate consolidation scenario plans to optimally combine and allocate workloads to new virtual hosts
Implement 4. Consolidate Accelerate the server consolidation project by streaming physical servers into virtual environments such as VMware ESX Server, VMware Server, and Microsoft Virtual Server
Automate migrations between dissimilar physical servers or from physical servers to blades
PlateSpin Portability Suite: Automatically stream data, applications, and operating systems to any physical or virtual platform over the network
1.5
PlateSpin Recon Terminology
Consolidation candidate: A workload on the network that you might want to move to a virtual machine.
Data Center assets: A collective set of physical and virtual machines, and physical and virtual workloads.
Job: A task performed in PlateSpin Recon.
Protection candidate: A workload to create standby VM duplicates for disaster recovery. Rater: A metric used to assign a billable charge to the use of a resource or part of a resource
over a set amount of time.
Scheduled job: An activity set to occur at a given time and frequency.
Virtual host: A physical machine that has the virtualization software installed. For example, VMware ESX.
Workload: A physical or virtual machine.
Manage 5. Monitor Keep track of workload
performance
Identify over- and under-utilized workloads for ongoing optimization
PlateSpin Recon
6.Chargeback Assign customized raters to machines
Measure resource usage and bill business owners for usage
Create reports on usage and cost PlateSpin Recon 7. Manage Virtual Infrastructure Monitor VM creation Report on VM growth PlateSpin Recon
2
2Overview of PlateSpin Recon Client
Views
PlateSpin Recon Client provides the following views to help you organize, monitor, view, and manage information about data center assets:
Section 2.1, “Data Center Explorer,” on page 23 Section 2.2, “Report Explorer,” on page 24 Section 2.3, “Projects Explorer,” on page 25 Section 2.4, “Raters Explorer,” on page 26 Section 2.5, “Chart Viewer,” on page 27 Section 2.6, “Job Explorer,” on page 27
Section 2.7, “Scheduled Job Explorer,” on page 28 Section 2.8, “Log Explorer,” on page 29
2.1
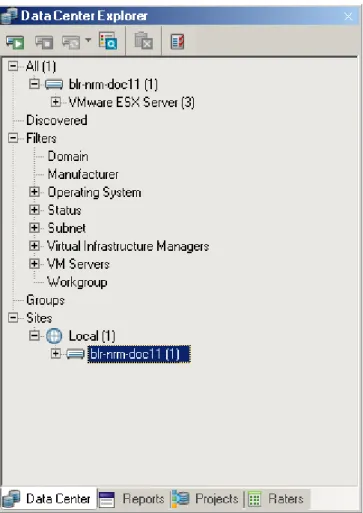
Data Center Explorer
The Data Center Explorer is one of several major PlateSpin Recon views. It is used to organize, monitor, view, and manage information about data center assets. PlateSpin Recon uses information about them to display dynamic charts, generate performance reports, and generate performance forecasts.
The Data Center Explorer is the central point for:
Interacting with physical and virtual machines in the data center Discovering and inventorying hardware and workloads
Figure 2-1 Data Center Explorer
For more information about working with Data Center Explorer, see Chapter 3, “Working with Data Center Explorer,” on page 31.
2.2
Report Explorer
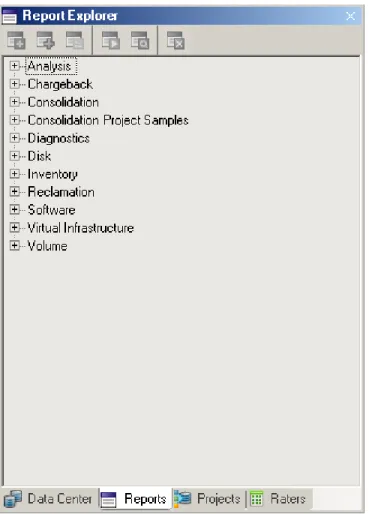
The Report Explorer allows you to organize and generate reports on the inventory and monitoring data. The Report Explorer hierarchy consists of template nodes that have various types of report templates.
Figure 2-2 Report Explorer
For more information about working with Report Explorer, see Chapter 5, “Generating and Viewing Charts and Reports,” on page 73.
2.3
Projects Explorer
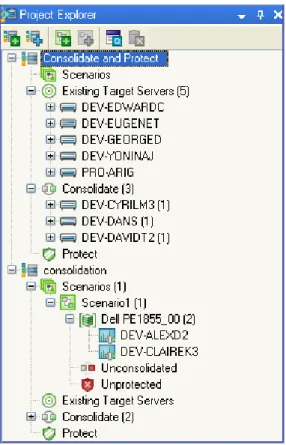
Figure 2-3 Project Explorer Tree
The project, scenario, and consolidated workloads are arranged hierarchically; that is, workloads are listed under a server, servers are listed under a scenario, and scenarios are listed under a project. All selected candidates are listed under workloads inside the project.
For more information about working with Project Explorer, see Chapter 6, “Server Consolidation,” on page 109.
2.4
Raters Explorer
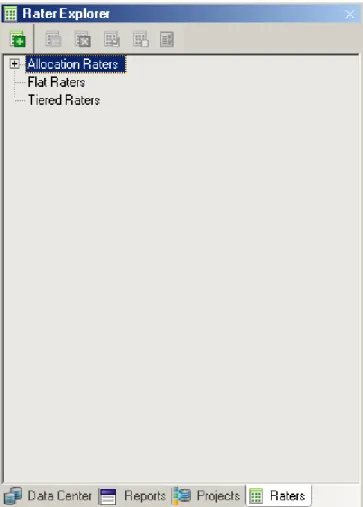
Figure 2-4 Raters Explorer
For more information about working with Raters Explorer, see Section 7.2, “Using Raters,” on page 131.
2.5
Chart Viewer
Charts provide a graphical representation of workload and utilization data.
To view a chart for a given server, select the server in the Data Center Explorer or click a cell belonging to the server in a report view.
2.6
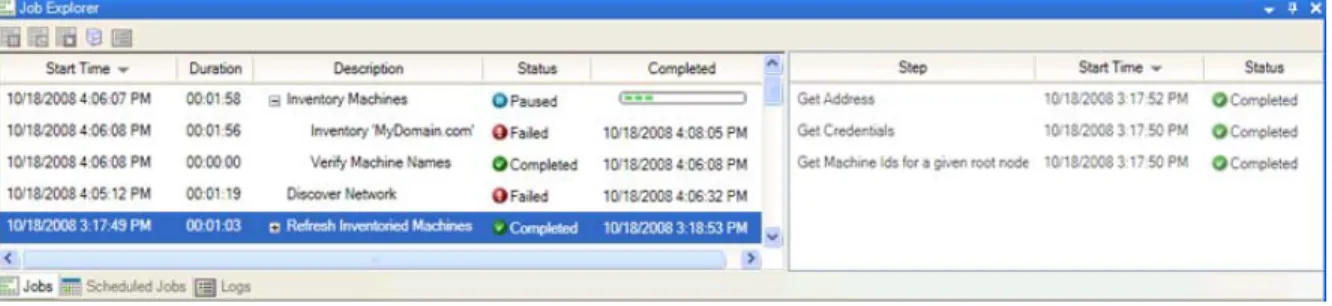
Job Explorer
Whenever a task is performed in PlateSpin Recon, a job is created for the task. Information on running, paused, or completed jobs is shown in the Job Explorer, located at the bottom of the PlateSpin Recon window, by default.
If a job consists of several tasks, you can expand the job to see all of its tasks and the status of each task by clicking the plus sign next to the job description.
Figure 2-5 Task steps displayed in the Job Explorer
Messages about the progress of a job are captured in a log file.
To pause, resume, or abort any running job, right-click any running job entry to display a pop-up menu or use the toolbar buttons. The Archive command moves jobs to the Archived Jobs list. These jobs can be subsequently viewed by selecting Tools > Archived Jobs. You can view the step logs by right-clicking on a step and selecting View Logs. The Log Viewer dialog is displayed.
NOTE: The default setting is to purge logs and jobs every 14 days. To change this setting, select
Tools > Options and then double-click Advanced under the Maintenance category on the Server page of the Options dialog box.
2.7
Scheduled Job Explorer
A scheduled job is an activity set to occur at a given time and frequency. For example, it is possible to generate a Network Usage Report every morning at 9:00 AM for the next five days.
A scheduled job comprises of two components: the action to be performed (the job), and the schedule for performing the activity. The schedule is a reusable component that can be shared amongst multiple jobs, such as creating three reports at 9:00 AM. The Scheduled Job Explorer can be used to view the status of the completed jobs.
Figure 2-6 Job status displayed in the Scheduled Job Explorer
Errors or warnings, if any, are also displayed. In addition, scheduled jobs can be run manually, or can have their recurrence changed.
To suspend, resume, or delete any scheduled job, right-click any running job entry to display a pop-up menu or use the toolbar buttons. The Edit Recurrence command allows you to create or edit a scheduled job recurrence pattern. The Run Now command allows you to immediately run the scheduled job.
2.8
Log Explorer
The Log Explorer allows you to view general information, warnings, or error messages. Messages that are displayed here are not related to any particular job or server. Right-click any log entry to display a pop-up menu where you can select commands to View Details of a log entry, Delete a log entry, or View XML format of a log entry.
To simultaneously delete multiple logs, select the logs using the Shift or Ctrl keys and press the Delete key or click Delete.
3
3Working with Data Center Explorer
This section provides information about the PlateSpin Recon Data Center Explorer and the features accessible from it.
Section 3.1, “Understanding the Data Center Explorer,” on page 31
Section 3.2, “Discovering and Inventorying Data Center Resources,” on page 32 Section 3.3, “Working with Filters,” on page 47
Section 3.4, “Working with Groups,” on page 47 Section 3.5, “Working with Sites,” on page 48
Section 3.6, “Working with PlateSpin Recon Snapshots,” on page 49 Section 3.7, “Working with Remote Data,” on page 51
Section 3.8, “Working with Data Collected by Other PlateSpin Recon Instances,” on page 51 Section 3.9, “Working with Data Collected by Other Performance Monitoring Tools,” on page 52 Section 3.10, “Using HP Reporter Data with PlateSpin Recon,” on page 55
Section 3.11, “Using Performance Data Import to Import Generic Data into PlateSpin Recon,” on page 58
Section 3.12, “Collecting Disk Utilization Counters for Windows Machines,” on page 61
3.1
Understanding the Data Center Explorer
The Data Center Explorer is one of several major PlateSpin Recon views. It is used to organize, monitor, view, and manage information about data center assets. PlateSpin Recon uses information about them to display dynamic charts, generate performance reports, and generate performance forecasts.
In the Data Center Explorer, physical and virtual servers are represented in a hierarchical tree structure.
Table 3-1 Data Center Explorer Nodes
Nodes Description
All Lists all systems
Discovered Lists servers that have been discovered but not yet inventoried
Filters Contains servers listed by built-in criteria, such as domain, operating system, or monitoring status
Groups Contains manually grouped servers according to any specific data segregation requirements
Sites Contains servers by data site, including a default local site and others you create to work with data about servers monitored by other instances of PlateSpin Recon, or imported from third-party performance monitoring tools
For more information about the Data Center Explorer icons and commands, see Appendix D, “Quick Reference to PlateSpin Recon Icons and Commands,” on page 189.
3.2
Discovering and Inventorying Data Center
Resources
PlateSpin Recon gets information about data center assets in two stages.
Discover: Discovering machines in the network retrieves information such as hostnames, IP addresses, MAC addresses, and port information.
Inventory: Inventorying the previously discovered machines retrieves deeper data for each server, such as operating system, installed applications, services, processor speed, memory, network, and disk resources.
After machines are inventoried, they can be monitored and included in all report types, regardless of which method is used for inventory.
Section 3.2.1, “Inventory and Discovery Methods,” on page 32 Section 3.2.2, “Inventory Credentials,” on page 40
Section 3.2.3, “Inventory Options,” on page 42 Section 3.2.4, “Discovery Options,” on page 43
Section 3.2.5, “Viewing Inventory Data and Monitoring Servers,” on page 43
PlateSpin identifies a machine through unique attributes such as the IP address. If you change the IP address of the machine after inventorying a machine, you must reinventory the machine.
For information about ports used by PlateSpin Recon to inventory servers, see Knowledge Base article Q7920571 (http://www.netiq.com/support/kb/doc.php?id=7920571).
3.2.1
Inventory and Discovery Methods
A common way to use discovery and inventory is to discover a large number of servers on the network. These servers appear under the Discovered node in the Data Center Explorer. Next, select the discovered servers and inventory them. Finally, select which inventoried servers you want to monitor. It is also possible to discover, inventory, and start monitoring servers in a single step. You can add servers to the Data Center Explorer by using the Inventory button . There are seven inventory methods available. Each inventory method is unique and has different requirements.
Table 3-2 Inventory Methods
Machines
To discover and inventory physical and virtual servers:
1 Click the Inventory button > Machines or click the Tools menu > Inventory >
Machines.
The Inventory Machines dialog box is displayed.
2 In Hostname or IP of the machine(s) to inventory, specify the hostname or the IP address of the machines you want to inventory.
You can specify multiple hostnames or IP addresses separated with a comma; however, they need to all use the same credentials.
3 Specify credentials for the machines you add in Step 2. For more information on how to specify a new credential, see Section 3.2.2, “Inventory Credentials,” on page 40.
This enables the Inventory button.
4 (Optional) Start monitoring the servers when they are inventoried and/or add them to existing groups. For more information, see Section 3.2.3, “Inventory Options,” on page 42.
5 Configure the schedule when you want to perform the inventory. To immediately start the inventory, do one of the following:
Click Now in the Inventory drop-down list.
Click Schedule in the Inventory drop-down list, then click Now > OK. To perform inventory at a later time, set up a schedule:
1. In the Inventory drop-down list, click Schedule. The Scheduling Options dialog box is displayed. 2. Select one of the following schedules
“Later” on page 187 “Recurrence” on page 187 3. Fill in the fields.
For details about the fields, click the appropriate schedule listed above.
6 Click Inventory.
Discover and Inventory Discover and Optionally Inventory
Machines (page 33) Virtual Center (page 34) From a CSV File (page 34)
Windows Domain (page 36) IP Range (page 37) Subnet (page 38) SNMP (page 39)
Virtual Center
Inventorying a Virtual Center involves collecting information about all the servers and virtual
machines in the Virtual Center. This is much more efficient than discovering and inventorying all the servers and virtual machines individually.
To discover and inventory Virtual Center servers:
1 Click the Inventory button > Virtual Center or click the Tools menu > Inventory >
Virtual Center.
2 In the Inventory Virtual Center dialog box, specify the hostname or the IP address of the Virtual Center you want to inventory.
3 Specify credentials for the machines that you added in Step 2. For more information on how to specify a new credential, see Section 3.2.2, “Inventory Credentials,” on page 40.
This enables the Inventory button.
4 (Optional) Start monitoring the servers when they are inventoried and/or add them to existing groups. For more information, see Section 3.2.3, “Inventory Options,” on page 42.
5 Configure the schedule when you want to perform the inventory. To immediately start the inventory, do one of the following:
Click Now in the Inventory drop-down list.
Click Schedule in the Inventory drop-down list, then click Now > OK. To perform inventory at a later time, set up a schedule:
1. In the Inventory drop-down list, click Schedule. The Scheduling Options dialog box is displayed. 2. Select one of the following schedules
“Later” on page 187 “Recurrence” on page 187 3. Fill in the fields.
For details about the fields, click the appropriate schedule listed above.
6 Click Inventory.
Virtual Center contents appear in the Data Center Explorer the same way they are organized in the Virtual Center, with all nodes, clusters, resource pools, and virtual machine nodes. The machines do not appear under All in the Data Center Explorer until they are inventoried.
When using per core server licensing, you must first inventory a Virtual Center before inventorying ESX Servers that belong to it, or the virtual machines on those ESX Servers. For more information, see “Per Core Licenses”the PlateSpin® Recon 4.1 Getting Started Guide.
From a CSV File
Inventorying machines from a CSV file allows you to add servers whose information resides in a comma-separated value file. Use the following format to list the machines in the file:
Table 3-3 CSV File Requirements
To discover and inventory machines from a CSV file:
1 Click the Inventory button > From CSV File or click the Tools menu > Inventory >
From CSV File.
2 In the Inventory from CSV dialog box, type the path (or use the adjacent browse button) to locate a CSV file containing servers to inventory.
3 (Conditional) If the CSV file does not contain the credentials for all the machines, specify the credentials for the machines in the Default Inventory Parameter panel.
NOTE: The Default Inventory Parameters area is disabled if the CSV file contains credentials
Field Required Description
Address Yes IP address or hostname of the machine.
Username Optional Username for the credential. If this is left blank, the default credentials are used.
Password Optional Password for the credential. This is required only when creating a credential.
Description Optional Description for the credential.
If the entry for a machine in the CSV file contains username and password, the credential description must be unique.
Inventory type Optional One of the following values. Values must match case and spacing as shown below: UNIX VirtualCenter VMwareESX3 VMwareESX4 VMwareESX5 NetWare CitrixXenServer Windows
If the value is unspecified, Windows and UNIX are the defaults and these are determined by the formats of the credentials that you specify in the CSV file:
[user],[password] is for UNIX
For example: 10.0.0.0,root,password,description
[domain\user],[password] is for Windows For example:
10.0.0.0,localhost\administrator,password,description1 This field is also expected to be at the end of the CSV file.
For more information on how to specify a new credential, see Section 3.2.2, “Inventory Credentials,” on page 40.
This enables the Inventory button.
4 (Optional) Start monitoring the machine when they are inventoried and/or add them to existing groups. For more information, see Section 3.2.3, “Inventory Options,” on page 42.
5 Configure the schedule when you want to perform the inventory. To immediately start the inventory, do one of the following:
Click Now in the Inventory drop-down list.
Click Schedule in the Inventory drop-down list, then click Now > OK. To perform inventory at a later time, set up a schedule:
1. In the Inventory drop-down list, click Schedule. The Scheduling Options dialog box is displayed. 2. Select one of the following schedules
“Later” on page 187 “Recurrence” on page 187 3. Fill in the fields.
For details about the fields, click the appropriate schedule listed above.
6 Click Inventory.
Windows Domain
Inventorying machines by using the Windows Domain option allows you to add all the servers discovered in the specified Windows Domain.
To discover and optionally inventory servers in a specified Windows Domain:
1 Click the Inventory button > Windows Domain or click the Tools menu >
Inventory > Windows Domain.
2 In the Domain Discovery and Inventory dialog box, type a Windows Domain name.
3 In the Machines to Discover drop-down list, select which machines to discover. The available options are All Machines, Servers, or Workstations (NT4 Workstation, Windows XP).
4 (Conditional) If you want to discover a specific part of a domain, configure the Organizational Unit (OU) filter. For more information, see “Domain Discovery:” on page 166.
5 Click the Options button to configure discovery options. For more information, see Section 3.2.4, “Discovery Options,” on page 43.
If you want to only discover machines, continue with Step 6. If you want to discover and inventory machines, skip to Step 7.
6 (Conditional) If you want to only discover machines without inventorying machine details:
6a Deselect the Inventory option.
The Inventory option is selected by default.
6b Click Discover.
7 (Conditional) If you want to discover and inventory machines, additionally configure the following settings:
For more information on how to specify a new credential, see Section 3.2.2, “Inventory Credentials,” on page 40.
This enables the Inventory button.
7b (Optional) Start monitoring the machines when they are inventoried and/or add them to existing groups. For more information, see Section 3.2.3, “Inventory Options,” on page 42.
7c Configure the schedule when you want to perform the inventory. To immediately start the inventory, do one of the following:
Click Now in the Inventory drop-down list.
Click Schedule in the Inventory drop-down list, then click Now > OK. To perform inventory at a later time, set up a schedule:
1. In the Inventory drop-down list, click Schedule. The Scheduling Options dialog box is displayed. 2. Select one of the following schedules
“Later” on page 187 “Recurrence” on page 187 3. Fill in the fields.
For details about the fields, click the appropriate schedule listed above.
7d Click Inventory.
IP Range
To discover and optionally inventory servers within a specified IP address range:
1 Click the Inventory button > IP Range or click the Tools menu > Inventory > IP Range.
2 Configure the following settings in the Discovery pane of the IP Range Discovery and Inventory dialog box:
2a Specify the IP address range of the servers to discover.
2b Click the Options button to configure discovery options. For more information, see Section 3.2.4, “Discovery Options,” on page 43.
If you want to only discover machines, continue with Step 3. If you want to discover and inventory machines, skip to Step 4.
3 (Conditional) If you want to only discover machines without inventorying machine details:
3a Deselect the Inventory option.
The Inventory option is selected by default.
3b Click Discover.
The numbers that are displayed in the Discover button indicate how many individual IP addresses are contained within the range you entered
4 (Conditional) If you want to discover and inventory machines, additionally configure the following settings:
4a Specify credentials for the machines you added in Step 2.
This enables the Inventory button.
4b (Optional) Start monitoring the machines when they are inventoried and/or add them to existing groups. For more information, see Section 3.2.3, “Inventory Options,” on page 42.
4c Configure the schedule when you want to perform the inventory. To immediately start the inventory, do one of the following:
Click Now in the Inventory drop-down list.
Click Schedule in the Inventory drop-down list, then click Now > OK. To perform inventory at a later time, set up a schedule:
1. In the Inventory drop-down list, click Schedule. The Scheduling Options dialog box is displayed. 2. Select one of the following schedules
“Later” on page 187 “Recurrence” on page 187 3. Fill in the fields.
For details about the fields, click the appropriate schedule listed above.
4d Click Inventory.
The numbers that are displayed on the Inventory button indicate how many individual IP addresses are contained within the range you entered.
Subnet
To discover and optionally inventory servers in a specified subnet:
1 Click the Inventory button > Subnet or click the Tools menu > Inventory >
Subnet.
2 Configure the following settings in the Discovery pane of the Subnet Discovery and Inventory dialog box:
2a Specify the network address and the mask bits of the subnet to be discovered.
2b Click the Options button to configure discovery options. For more information, see Section 3.2.4, “Discovery Options,” on page 43.
If you want to only discover machines, continue with Step 3. If you want to discover and inventory machines, skip to Step 4.
3 (Conditional) If you want to only discover machines without inventorying machine details:
3a Deselect the Inventory option.
The Inventory option is selected by default.
3b Click Discover.
The numbers that are displayed in the Discover button indicate how many individual IP addresses are contained in the subnet you specified.
4 (Conditional) If you want to discover and inventory machines, additionally configure the following settings in the Inventory pane:
4a Specify credentials for the machines you added in Step 2.
For more information on how to specify a new credential, see Section 3.2.2, “Inventory Credentials,” on page 40.
This enables the Inventory button.
4b (Optional) Start monitoring the machines when they are inventoried and/or add them to existing groups. For more information, see Section 3.2.3, “Inventory Options,” on page 42.
4c Configure the schedule when you want to perform the inventory. To immediately start the inventory, do one of the following:
Click Now in the Inventory drop-down list.
Click Schedule in the Inventory drop-down list, then click Now > OK. To perform inventory at a later time, set up a schedule:
1. In the Inventory drop-down list, click Schedule. The Scheduling Options dialog box is displayed. 2. Select one of the following schedules
“Later” on page 187 “Recurrence” on page 187 3. Fill in the fields.
For details about the fields, click the appropriate schedule listed above.
4d Click Inventory.
The numbers that are displayed on the Inventory button indicate how many individual IP addresses are contained in the subnet you specified.
SNMP
To discover and optionally inventory machines by using Simple Network Management Protocol:
1 Click the Inventory button > SNMP or click the Tools menu > Inventory > SNMP.
2 Configure the following settings in the Discovery pane of the SNMP Discovery and Inventory dialog box:
2a Specify the hostname.
2b Specify the SNMP community name. By default, it is public.
2c In Maximum number of Hops, specify how many hops to make beyond the server from which the discovery is launched. Select whether to include Public Subnets.
2d Click the Options button to configure discovery options. For more information, see Section 3.2.4, “Discovery Options,” on page 43.
If you want to only discover machines, continue with Step 3. If you want to discover and inventory machines, skip to Step 4.
3 (Conditional) If you want to only discover machines without inventorying machine details:
3a Deselect the Inventory option.
The Inventory option is selected by default.
3b Click Discover.
4 (Conditional) If you want to discover and inventory machines, additionally configure the following settings in the Inventory pane:
This enables the Inventory button.
4b (Optional) Start monitoring the machines when they are inventoried and/or add them to existing groups. For more information, see Section 3.2.3, “Inventory Options,” on page 42.
4c Configure the schedule when you want to perform the inventory. To immediately start the inventory, do one of the following:
Click Now in the Inventory drop-down list.
Click Schedule in the Inventory drop-down list, then click Now > OK. To perform inventory at a later time, set up a schedule:
1. In the Inventory drop-down list, click Schedule. The Scheduling Options dialog box is displayed. 2. Select one of the following schedules
“Later” on page 187 “Recurrence” on page 187 3. Fill in the fields.
For details about the fields, click the appropriate schedule listed above.
4d Click Inventory.
3.2.2
Inventory Credentials
To inventory discovered machines, select the Inventory check box in the Discovery and Inventory dialog boxes and then provide login credentials for Windows, UNIX, Virtual Center, VMware ESX, Novell NetWare, or Citrix XenServer machines, depending on the type of machines in use.
“Specifying Credentials for Windows or VMware ESX 3/4/5” on page 40 “Specifying Credentials for UNIX or Citrix XenServer” on page 40 “Specifying Credentials for Virtual Center” on page 41
“Specifying Credentials for Novell NetWare” on page 41
For every machine in the list or range, PlateSpin Recon tries each type of credential provided until it finds one that matches. If the credentials are not valid, the machine is not inventoried.
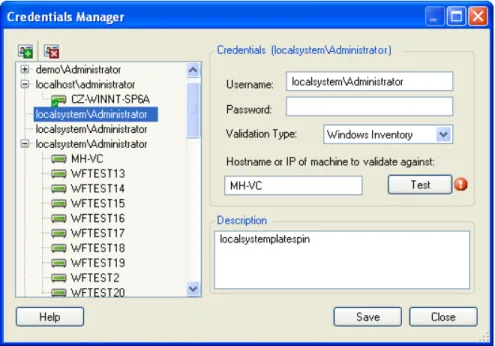
Specifying Credentials for Windows or VMware ESX 3/4/5
Do the following in the Discovery and Inventory dialog box:1 In the Inventory panel, click the Windows or VMWare ESX 3/4/5 tab depending on the type of machines in use.
2 In the Credentials for Inventory drop-down list, select credentials.
To add a new credential, click <New Credential>, and configure the Create Stored Credentials dialog box. For detailed information about adding credentials, see Section 4.2, “Credentials Manager,” on page 67.
Specifying Credentials for UNIX or Citrix XenServer
Do the following in the Discovery and Inventory dialog box:1 In the Inventory panel, click the UNIX or Citrix XenServer tab depending on the type of machines in use.
2 In the Credentials for Inventory drop-down list, select credentials.
To add a new credential, click <New Credential>, and configure the Create Stored Credentials dialog box. For detailed information about adding credentials, see Section 4.2, “Credentials Manager,” on page 67.
3 Select the Use Sudo check box to use super user privileges for connections.
PlateSpin Recon allows inventorying of Linux (RHEL, SLES, Ubuntu, CentOs, SLES with Xen) and Citrix XenServer machines by using sudo user credentials. However, inventorying of the AIX and Solaris machines by using sudo user credentials is not supported. PlateSpin Recon users can inventory machines by using sudo user credentials only if certain prerequisites are met. For more information on the prerequisites, see Section B.9, “Sudo Configuration to Inventory and Monitor Linux Machines,” on page 186.
Local policies can sometimes prevent you from establishing an SSH session as a root user. A user with sudo privileges can get around this restriction by establishing an SSH session as a non-root user and then using sudo to temporarily “switch” to root user privileges.To do this, create the credentials using that user’s username and password. PlateSpin Recon uses the
sudo command to perform any operations that require root privileges.
Specifying Credentials for Virtual Center
Do the following in the Discovery and Inventory dialog box:1 In the Inventory panel, click the Virtual Center tab.
2 In the Credentials for Inventory drop-down list, select credentials.
To add a new credential, click <New Credential>, and configure the Create Stored Credentials dialog box. For detailed information about adding credentials, see Section 4.2, “Credentials Manager,” on page 67.
For inventorying a Virtual Center, credentials must have a minimum Browse datastore privilege for the Virtual Center.
On the machine that has Virtual Center installed, Virtual Center automatically includes any user that has Administrator privileges.
Specifying Credentials for Novell NetWare
Do the following:1 In Novell eDirectory on the NetWare server you want to inventory, create a user with the same login credentials as the PlateSpin Recon server administrator.
2 Associate the local security policies to the PlateSpin Recon server administrator:
2a On the PlateSpin Recon server, click the desktop Start menu > Settings > Control Panel.
2b Double click Administrative Tools > Local Security Policy. The Local Security Settings window is displayed.
2c Click Local Policies, then double-click User Rights Assignment.
2d Associate the administrator with following policies: Act as part of the operating system
Create a token object Log on as a batch job
3 Ensure that the recommended Novell Client is installed on the PlateSpin Recon server. For more information on the recommended Novell Clients, see “Supported Novell NetWare Versions” on page 16.
4 Through the Novell Client, log in to the PlateSpin Recon server as the administrator user created in Step 1.
5 Launch the PlateSpin Recon Client.
6 In the Inventory drop-down list (located at the top left corner), click Machines. The Inventory Machines dialog box is displayed.
7 Click the Novell NetWare tab.
8 In the Credentials for Inventory drop-down list, select <New Credential>. The Create Stored Machines dialog box is displayed.
9 Specify the login credentials of the NetWare administrator, and select Novell NetWare Inventory as the validation type.
Ensure that you specify the username in the Username.Context format.
Ensure that the administrator has permission to write to the Novell SYS: volume. Also, ensure that TCP port 524 is open on the firewall. For more information, see Section 1.3, “Supported Platforms,” on page 14.
10 In the Launch Inventory Process as User drop-down list, select <New Credential>. The Create Stored Machines dialog box is displayed.
11 Fill in the fields:
Username: Specify the administrator username created in Step 1. You must specify the username either in the hostname\username or the domain\username format. If you choose to specify the username in the hostname\username format, ensure that the hostname is the local hostname.
Password: Specify the password of the administrator.
Validation Type: Select Netware LSA.
Hostname or IP of machine to validate against: Specify it as localhost.
12 Click Save.
3.2.3
Inventory Options
If you want to start monitoring immediately after inventory or if you want to copy machines to a user-defined group, you must configure the Post-Inventory options. The options are available only if you selected the Inventory check box in the Discovery and Inventory dialog boxes.
To configure the Post-Inventory options:
1 Click the Options button in the Inventory area.
2 In the Post-Inventory Options dialog box, select Start monitoring machines immediately to begin monitoring each of the discovered machine after the inventory completes.
To start monitoring later, do not select the option.
3 Select Copy to group, then select a target Group from those displayed in the list box to copy all the inventoried machines to that group.
3.2.4
Discovery Options
You can configure additional discovery options when you choose to discover and inventory using any of the following Inventory methods:
Windows Domain IP Range
Subnet SNMP
To configure discovery options:
1 In the Discovery pane, click the Options button.
2 In the Discovery Options dialog box, configure the Ping Attempts and Ping Timeout options as desired.
3 In the Port subset type drop-down list, select one of the following subset types: Most Common: Includes ports for common Windows network services. All Standard: Includes ports below 1025 used by standard protocols. Custom: Includes customized ports that you specify.
To assign individual scan protocols to specific ports:
1. In the Port Number column, click Add and type the port number.
2. In the Protocol column, select the protocol type (TCP or UDP) from the drop-down cell.
3. Press Enter.
4. (Optional) If you want to add a new port number, repeat Step 1 through Step 3.
4 To find MAC addresses of machines in the same ethernet segment as the PlateSpin Recon Server, select Discover MAC addresses. The option is selected by default.
5 To include the computer names in the discovery poll, select Discover computer names. The option is selected by default
6 To discover computers even if they are currently offline, select Add offline computers.
7 Click OK.
3.2.5
Viewing Inventory Data and Monitoring Servers
On completion of an inventory operation, you can view inventory data on servers that are listed in the Data Center Explorer tree. To view dynamic data, servers must be monitored for a period of time.
“Viewing Properties” on page 44 “Refreshing the Inventory” on page 44
“Collecting Dynamic Data by Monitoring Servers” on page 44 “Viewing Dynamic Data” on page 44
“Viewing Logs” on page 45 “Acknowledging Logs” on page 45 “Custom Fields” on page 45
IMPORTANT: When you monitor Windows Server 2003, the memory utilization on the monitored server might increase because the memory usage of the Svchost.exe process increases when other users remotely collect performance data about the monitored server. This is a known issue of Windows Server 2003. To troubleshoot the issue, see the Microsoft Knowledge Base article ID 969701 (http://support.microsoft.com/kb/969701).
Viewing Properties
Properties can assist with viewing static data for inventoried servers. To view inventory information, right-click a server and click Properties.
The tabs available in the Properties dialog box change based on the type of server being viewed.
Refreshing the Inventory
To refresh server inventory information in the Data Center Explorer, right-click a server or multiple servers and click Refresh Inventory.
Inventory Refresh jobs a