MPRA
Munich Personal RePEc Archive
Non-performing loans and Financial
Development: New Evidence
Peterson K Ozili
University of Essex
2 January 2017
Online at
https://mpra.ub.uni-muenchen.de/75964/
1
Non-performing loans and Financial Development: New Evidence
Peterson K Ozili
Essex Business School
University of Essex, UK.
Email: [email protected]
2
Non-performing loans and Financial Development: New Evidence
Abstract
This paper examine the relationship between non-performing loans (NPLs) and financial (sector) development. The study is motivated by the scant knowledge on how financial development structures impact non-performing loans across banking sectors around the world. In the pooled full country empirical analysis, we find that (i) private credit to GDP ratio is positively associated with non-performing loans, (ii) NPLs are inversely associated with bank efficiency, loan loss coverage, banking competition and banking system stability, and (iii) NPL is positively associated with foreign bank presence, banking crises and bank concentration. We also find that efficient and stable banking sectors experience higher non-performing loans. In the regional empirical analysis, NPLs are negatively associated with regulatory capital ratio and bank liquidity while the graphical analysis show that NPLs are inversely related to financial development and profitability in several regions.
JEL Classification Code: E44, G01, G21, G28, G32, F34, O16
Keywords: Non-performing loans; credit risk; financial development; banking crisis; foreign banks; financial intermediation1.
1 To cite: Ozili, P.K. (2017). Non-performing loans and financial development. New Evidence. University of
3 1. Introduction
Non-performing loans reflect the credit quality of the loan portfolio of banks, and in aggregate terms, reflect the credit quality of the loan portfolio of the banking sector of several countries and regions. For most countries, aggregate non-performing loans were stable before the 2008 global financial crisis but increased significantly during and after the 2008 financial crisis2, compelling bank
supervisors/regulators in several countries to find solutions to deal with rising non-performing loans in the banking sector. Moreover, despite the formulation of several policy design intended to mitigate recessionary economic trends that gives rise to non-performing loans as well as the imposition of different levels of stringent capital regulation by bank supervisors to mitigate risk-taking that increase the risk of non-performing loans in several countries around the world, yet the persistent incidence of rising non-performing loans in the post-crisis period raises serious concern to bank
supervisors/regulators about whether existing policy and regulatory efforts directly mitigate non-performing loans.
In this paper, we partly deviate from the macroeconomic argument for non-performing loans and take a different view, which is this: given that non-performing loans are a measure of bank performance (the lower, the better), could it be that certain financial (sector) development characteristics makes it more probable for a banking sector to experience higher or fewer aggregate non-performing loans? We are interested in explaining this relationship, if any, using country-level data for non-performing loans. In this paper, we therefore study the empirical association between non-performing loans and financial development using two datasets: data for 96 countries and data for 6 regions of the world.
We use non-traditional NPL indicators to control for bank-level determinants of non-performing loans. Further, given the causality problem in the relationship between financial development and macroeconomic growth (Levine, 1997), there are two ways to deal with such causality: either by using sophisticated estimation techniques that deal with causality after the relevant financial development and macroeconomic variables are included in the model or by using financial development variables scaled by GDP rather than controlling separately for macroeconomic factors such as GDP growth, inflation and unemployment. Some studies follow the former approach (Espinoza and Prasad, 2010; Klein, 2013; Anastasiou et al, 2016). In contrast, we follow the latter approach to allow us to focus more directly on the relationship between aggregate non-performing loans and financial development. Our measures of financial development are private credit by banks to GDP ratio and bank deposit to GDP ratio, and we find that non-performing loans are positively associated with financial
intermediation measured as private credit by banks to GDP ratio, implying that banking sectors with greater financial intermediation activities have higher non-performing loans.
This paper contributes to the current literature on the determinants of NPLs and macro-financial feedback in two ways. One, we focus on the relationship between non-performing loans and financial sector development, an issue that remain sparsely unexplored in the literature. Two, we use two datasets and combine regional graphical analysis and global empirical analysis to examine the association between NPLs and financial development during the 2003 to 2014 period. Three, we introduce non-traditional banking sector determinants that potentially explains non-performing loans. From a policy standpoint, our analysis could be of interest to policy makers for two additional reasons. First, our analysis for the relationship between aggregate non-performing loans and financial development is crucial for macro-prudential surveillance and can help policy makers in their
evaluation of external factors beyond their control that influence the level of aggregate
4
performing loans despite their micro-prudential policy efforts to reduce the size of NPLs. A thorough understanding of this relationship may provide a significant breakthrough to bank
supervisors/regulators in their attempt to reduce non-performing loans. Finally, our analysis is
relevant for the stress testing of bank loan quality. National bank supervisors should take into account the level of financial sector development in their stress-test scenarios in order to gain robust stress test results to improve their understanding of what gives rise to non-performing loans.
The remainder of the paper is organised as follows. Section 2 presents the conceptual framework and review of related literature for non-performing loans. Section 3 presents a description of the dataset and the econometric methodology used to estimate the relationship between NPLs and financial development. Section 4 discusses the results. Section 5 concludes.
2. Conceptual Framework and Related Literature
2.1. Non-Performing Loans: A Performance Indicator
NPL is an indicator of banks’ asset quality and asset quality is an important indicator of the
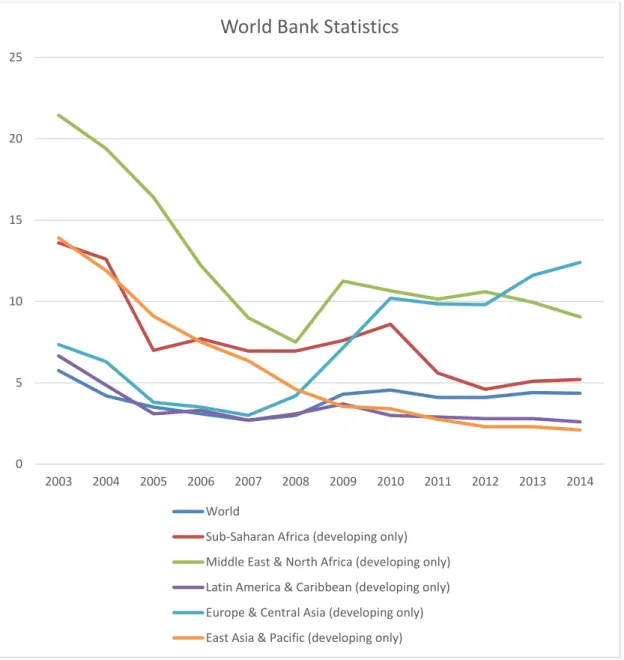
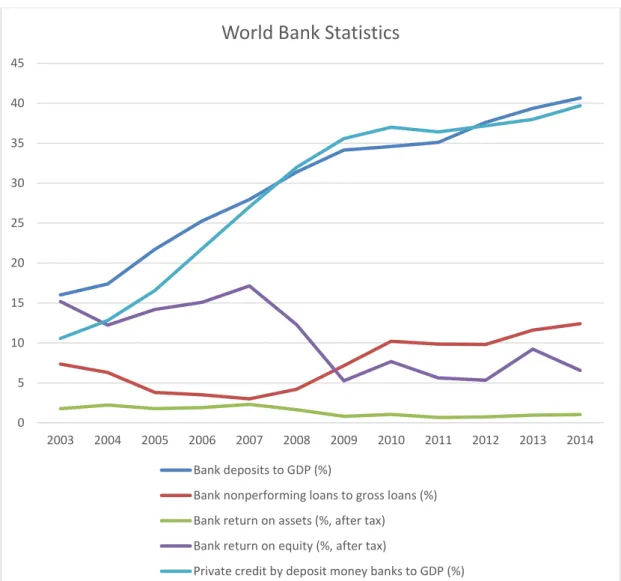
performance of the banking sector of a country amongst other performance indicators. In aggregate terms, the asset quality of a country’s banking sector is determined by its aggregate non-performing loan measured as the ratio of impaired loans to gross loans although the definition of non-performing loans may differ across countries3. The level of non-performing loans is of serious concern to bank regulators/supervisors due to its role in the failure of several of systemic and non-systemic financial institutions around the world during the 2007-2009 financial crisis. A closer look at aggregate data for non-performing loans across regions confirm that the post-2008 financial crisis era witnessed a significant increase in aggregate non-performing loans in several regions (See Figure 1) and several banking analysts expect the level of non-performing loans to increase in subsequent years.
While micro-level attempts by bank regulators/supervisors to reduce the level of aggregate non-performing loans may involve minimising non-non-performing loans for each individual bank in the country, in this paper we take into account that certain financial (or banking sector) development characteristics/structures in a country can increase or reduce the likelihood of non-performing loans. In fact, the graphical analysis below using regional data show some association between
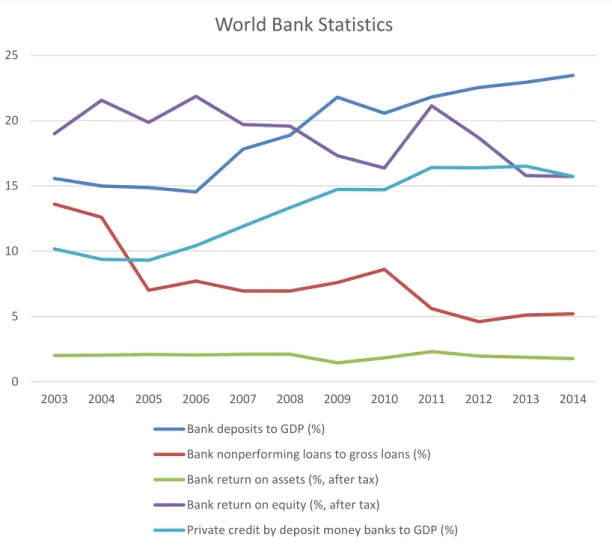
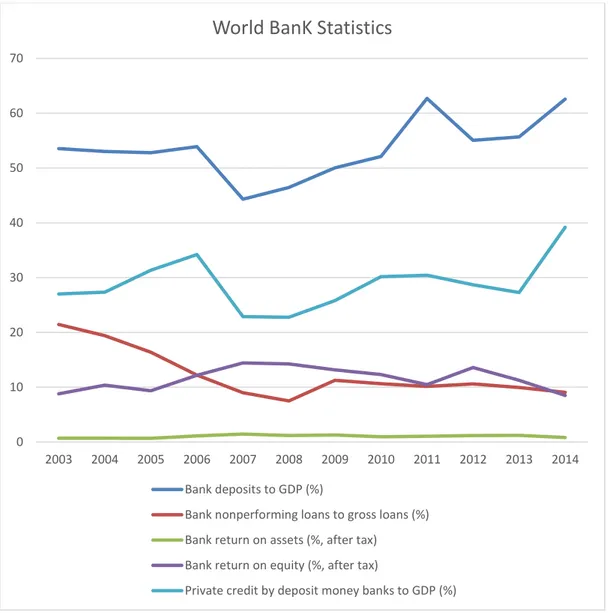
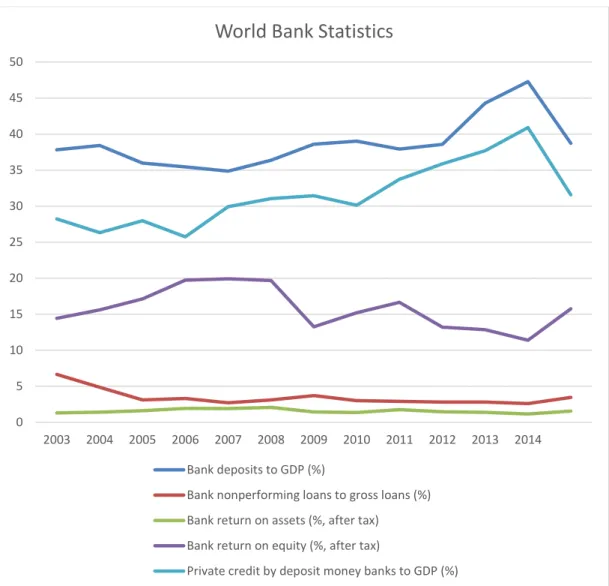
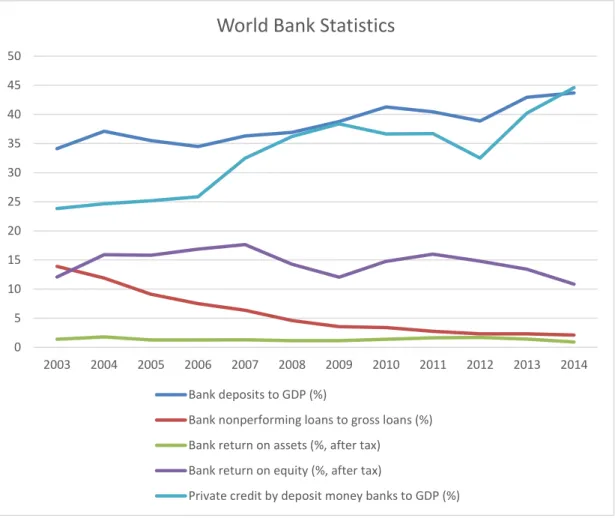
non-performing loans and some financial sector development indicators. Therefore, our curiosity leads us to investigate whether varying cross-country financial sector development indicators affect the level of aggregate non-performing loans. As can be observed in Figure 2 to 7, NPLs are inversely related to financial intermediation (private credit to GDP ratio) and size of the banking sector (bank deposits to GDP ratio) for the World, SSA, MENA, LAC and EAP regions while a positive association is observed for the ECA region in the post-crisis period. For all regions, NPLs are inversely related to return on equity and return on assets.
3see 2012 report on NPLs by the European Banking Coordination “Vienna” Initiative .Available at: http://vienna- initiative.com/wp-content/uploads/2012/08/Full-Forum-Meeting-of-the-European-Bank-Coordination-Vienna-2.0-Initative.pdf
5
Figure 1: Non-performing loans (by region)
0 5 10 15 20 25 2003 2004 2005 2006 2007 2008 2009 2010 2011 2012 2013 2014
World Bank Statistics
World
Sub-Saharan Africa (developing only) Middle East & North Africa (developing only) Latin America & Caribbean (developing only) Europe & Central Asia (developing only) East Asia & Pacific (developing only)
6 Figure 2: World 0 10 20 30 40 50 60 2003 2004 2005 2006 2007 2008 2009 2010 2011 2012 2013 2014
World Bank Statisitcs
Bank deposits to GDP (%)
Bank nonperforming loans to gross loans (%) Bank return on assets (%, after tax)
Bank return on equity (%, after tax)
7
Figure 3: Sub-Saharan Africa (SSA) region
0 5 10 15 20 25 2003 2004 2005 2006 2007 2008 2009 2010 2011 2012 2013 2014
World Bank Statistics
Bank deposits to GDP (%)
Bank nonperforming loans to gross loans (%) Bank return on assets (%, after tax)
Bank return on equity (%, after tax)
8
Figure 4: Middle East and North Africa (MENA) region
0 10 20 30 40 50 60 70 2003 2004 2005 2006 2007 2008 2009 2010 2011 2012 2013 2014
World BanK Statistics
Bank deposits to GDP (%)
Bank nonperforming loans to gross loans (%) Bank return on assets (%, after tax)
Bank return on equity (%, after tax)
9
Figure 5: Latin America and Caribbean (LAC) region
0 5 10 15 20 25 30 35 40 45 50 2003 2004 2005 2006 2007 2008 2009 2010 2011 2012 2013 2014
World Bank Statistics
Bank deposits to GDP (%)
Bank nonperforming loans to gross loans (%) Bank return on assets (%, after tax)
Bank return on equity (%, after tax)
10
Figure 6: Europe & Central Asia (EAC) region
0 5 10 15 20 25 30 35 40 45 2003 2004 2005 2006 2007 2008 2009 2010 2011 2012 2013 2014
World Bank Statistics
Bank deposits to GDP (%)
Bank nonperforming loans to gross loans (%) Bank return on assets (%, after tax)
Bank return on equity (%, after tax)
11
Figure 7: East Asia & Pacific (EAP) region
2.2. Related Literature
So far, the literature on NPLs focus extensively on macroeconomic and bank-level determinants of non-performing loans with little or no focus on the question whether certain financial development structure/characteristic drive the level of non-performing loans. With regard to macroeconomic factors, Nkusu (2011) examine 26 developed countries over the 1998 to 2009 period and find that deteriorating macroeconomic conditions e.g., economic growth and higher unemployment levels led to higher non-performing loans. Klein (2013), using country-level data, examine 16 CESEE countries over the1998-2011 period and find that aggregate NPLs are negatively associated with credit growth,
0 5 10 15 20 25 30 35 40 45 50 2003 2004 2005 2006 2007 2008 2009 2010 2011 2012 2013 2014
World Bank Statistics
Bank deposits to GDP (%)
Bank nonperforming loans to gross loans (%) Bank return on assets (%, after tax)
Bank return on equity (%, after tax)
12
unemployment, GDP growth and inflation. Louzis et al (2012) examine the determinants of non-performing loans (NPLs) in the Greek banking sector for each loan category: consumer loans,
business loans and mortgages, and find that NPLs are significantly influenced by management quality, GDP, unemployment, interest rates and public debt. Skarica (2014), using country-level
non-performing loans data, investigate the determinants of non-non-performing loans among 7 countries in the Central and Eastern European (CEE) region during the third-quarters of 2007 and 2012 and find that higher NPLs are significantly associated with economic slowdown, unemployment and inflation rate. Beck et al (2015) examine the macroeconomic determinants of non-performing loans (NPLs) across 91 countries and find that non-performing loans are significantly affected by real GDP growth, share prices, exchange rate and lending interest rate. Anastasiou et al (2016) focus on the Euro-area banking system during the 1990 to 2015 period and find that income tax and output gap significantly influence NPLs. Taken together, these studies suggest that GDP growth rate is negatively correlated with higher NPLs because NPLs are usually lower during periods of economic prosperity and are higher during recessionary periods (Skarica, 2014; Ozili, 2015; Beck et al, 2015). Also, higher unemployment have been associated with higher non-performing loans because high unemployment levels lower
borrowers’ capacity to repay loans (Klein 2013; Nkusu, 2011). However, the effect of inflation on non-performing loans is inconclusive in the literature (see. Klein, 2013; Beck et al, 2015). Global risk-factors may also drive the level of NPLs. Espinoza and Prasad (2013) examine 80 banks from the Gulf Cooperation Council (GCC) region, and employ the VIX proxy to control for global financial volatility and risk aversion. They find that non-performing loans are positively correlated with greater global financial volatility, implying that non-performing loans increases with global risk.
With regard to bank-level determinants, Klein (2013) finds that capital adequacy measured as equity to assets ratio is negatively correlated with NPLs, implying that banks with relatively low capital have incentives to engage in risky lending behaviour which increases the risk of non-performing loans while Boudriga et al (2009) show that banking sectors with higher capital adequacy ratios and prudent loan loss provisioning report fewer non-performing loans. Boudriga et al (2009) examine cross-country determinants of nonperforming loans (NPLs) while controlling for the impact of banking supervisory and institutional influence on credit risk exposure. Also, profitability banks appear to have fewer NPLs because lower NPLs leads to higher interest income which subsequently improves overall profitability (Klein, 2013).
Because non-performing loan is a measure of bank performance, the literature that examine the relationship between firm/bank performance and financial development is scarce. An existing study, Tanaskovic and Jandric (2015) use private credit to GDP ratio to control for financial sector
development while investigating the macroeconomic and institutional determinants of NPLs for some countries in Central, Eastern and South-Eastern Europe during the 2006 to 2013 period. They find that NPL is negatively correlated with GDP and financial sector development, and positively associated with foreign currency loans ratio and exchange rate. Another study Giannetti and Ongena (2009) show that foreign firms are more inclined to fund low-risk borrowers that have promising projects rather than fund unpromising projects belonging to high-risk and well-connected or state-owned firms, and lending to low-risk borrowers with promising projects will reduce the risk of
non-performing loans thus improving the asset quality of the firm. However, they did not examine the case of non-performing loans. Following their reasoning, one would expect that countries whose banking sectors are dominated by greater foreign bank assets may experience fewer non-performing loans. We control for foreign bank presence in our analysis in order to test this claim. Foreign bank presence reflects financial development via financial liberalisation and may have an impact on non-performing loans. Demirguc-Kunt and Huizinga (2000) investigate the relationship between financial
13
development and structure on bank performance using bank-level data for developed and developing countries during 1990 to 1997 period. They find that greater financial sector development is
associated with lower profitability for banks reflecting increased efficiency due to increased competition. They did not examine the case of non-performing loans.
In contrast, our study is different because we take a shift from the extant literature to investigate more directly the relationship between non-performing loans and financial (sector) development while using controlling for traditional and ‘non-traditional’ determinants of non-performing loans. Finally, we did not control separately for macroeconomic factors because we expect causality and/or high correlation between financial development and macroeconomic indicators as indicated by Levine (1997), rather we divide the financial development indicators by GDP, a macroeconomic indicator. To this end, our analysis in this paper can be viewed as an attempt to examine the relationship between financial development and bank performance, taking non-performing loans as a measure of bank performance.
3. Data and Method
3.1. Data
Our data is obtained from the global financial development indicator archived in the World Bank database. We obtain two datasets. First, we obtain country-level data for 134 countries over the 2003 to 2014 period. Second, we obtain data for 6 regions over the same sample period: the six (6) regions are: World, Sub-Saharan Africa (developing countries only), Middle East and North Africa
(developing countries only), Latin America and Caribbean (developing countries only), Europe and Central Asia (developing countries only) and East Asian and pacific (developing countries only) regions. We separate these two datasets to avoid double counting from the first category so that no country is included twice in the analysis. In the first dataset, some countries do not report data for aggregate performing loans. Of the 134 countries, 38 countries did not report data for non-performing loans and we exclude these countries from the analysis which reduces the sample to a final sample of 96 banks with available data, however, the final data distribution also include countries with missing NPL values for some years, implying that the data distribution is an unbalanced panel. See Appendix A6 for variable description. The summary of the descriptive statistics show that the full country-sample NPL mean and World NPL mean are approximately the same in Appendix A2 and A3. A3 shows that the level of financial development (PGDP and DGDP) is relatively low in Sub-Saharan Africa compared to other regions.
3.2. Methodology
To investigate the association between non-performing loans and financial development indicators, we estimate the following models.
𝑁𝑃𝐿 = 𝛽0 + 𝛽1 𝐶𝐼 + 𝛽2 𝐿𝐷 + 𝛽3 𝑁𝐼𝐼 + 𝛽4 𝐶𝐴𝑅 + 𝛽5 𝐿𝐿𝐶 + 𝛽6 𝐷𝐺𝐷𝑃 + 𝛽7 𝑃𝐺𝐷𝑃 + 𝛽8 𝐶𝑅𝐼𝑆𝐼𝑆 + 𝛽9 𝐵𝐶𝑂𝑁 + 𝛽10 𝑆𝑇𝐴𝐵𝐼𝐿𝐼𝑇𝑌 + 𝛽11 𝐹𝑂𝑅𝐸𝐼𝐺𝑁
14
𝑁𝑃𝐿 = 𝛽0 + 𝛽1 𝐶𝐼 + 𝛽2 𝐿𝐷 + 𝛽3 𝑁𝐼𝐼 + 𝛽4 𝐶𝐴𝑅 + 𝛽5 𝐿𝐿𝐶 + 𝛽6 𝐷𝐺𝐷𝑃 + 𝛽7 𝑃𝐺𝐷𝑃 + 𝛽8 𝐶𝑅𝐼𝑆𝐼𝑆 + 𝛽9 𝐵𝐶𝑂𝑁 + 𝛽10 𝑆𝑇𝐴𝐵𝐼𝐿𝐼𝑇𝑌 + 𝛽11 𝐹𝑂𝑅𝐸𝐼𝐺𝑁
+ 𝛽12 𝐿𝐸𝑅𝑁𝐸𝑅 + 𝛽13 𝑃𝐺𝐷𝑃 ∗ 𝐿𝐷 + 𝛽14 𝐶𝐼 ∗ 𝑆𝑇𝐴𝐵𝐼𝐿𝐼𝑇𝑌 + 𝛽15 𝐷𝐺𝐷𝑃 ∗ 𝐵𝐶𝑂𝑁 + 𝑒 𝐸𝑞𝑢𝑎𝑡𝑖𝑜𝑛 (2)
The model in Equation (1) and (2) estimate the relationship between non-performing loans and financial development after controlling for bank-level determinants and the structure of the banking sector, using the first dataset.
For the regional sample based on the second dataset, data for banking crisis, foreign bank presence, and banking sector concentration variables are not available, therefore, we re-specify the model below:
𝑁𝑃𝐿 = 𝛽0 + 𝛽1 𝐶𝐼 + 𝛽2 𝐿𝐷 + 𝛽3 𝑁𝐼𝐼 + 𝛽4 𝐶𝐴𝑅 + 𝛽5 𝐿𝐿𝐶 + 𝛽6 𝐷𝐺𝐷𝑃 + 𝛽7 𝑃𝐺𝐷𝑃 + 𝛽8 𝑆𝑇𝐴𝐵𝐼𝐿𝐼𝑇𝑌 + 𝛽9 𝐿𝐸𝑅𝑁𝐸𝑅 + 𝛽10 𝑃𝐺𝐷𝑃 ∗ 𝐿𝐷 + 𝛽11 𝐶𝐼 ∗ 𝑆𝑇𝐴𝐵𝐼𝐿𝐼𝑇𝑌 + 𝑒 𝐸𝑞𝑢𝑎𝑡𝑖𝑜𝑛 (3)
We control for five bank-level determinants that potentially influence the level of non-performing loans. The first determinant is cost to income ratio (CI) measuring bank efficiency. Efficient banks report fewer non-performing loans compared to inefficient banks (Louzis et al, 2012; Abd Karim et al, 2010). Accordingly, we expect that countries with efficient banking sectors should have fewer
aggregate non-performing loans.
The second determinant is loan to deposit ratio (LD), measuring bank liquidity (Van den End, 2016). A too high ratio indicates that banks have liquidity problems, and liquidity difficulties of banks are often positively correlated with non-performing loans. Accordingly, at country-level we expect that banking sectors with higher liquidity should have fewer non-performing loans, implying a positive association between aggregate NPL and banking sector liquidity.
The third determinant is non-interest income to total income (NII) ratio (Smith et al, 2003; DeYoung and Rice, 2004). Banks that have significant exposure in non-interest source of income should have fewer non-performing loans because they rely less on interest income derived from bank lending. Similarly, at country-level we expect that banking sectors with higher NII ratio should have fewer non-performing loans. We, therefore, expect a negative relation between NPL and NII.
The fourth determinant is regulatory capital (CAR). Compared to Boudriga et al (2009) and Klein (2013), we use risk-adjusted capital ratio and expect that banks with higher regulatory capital should have fewer non-performing loans because banks’ risk-adjusted capital limit banks from risky lending that would otherwise lead to higher non-performing loans and reduced profitability (Ozili, 2016). At country-level, we also expect that banking sectors with higher regulatory capital ratios should have fewer non-performing loans, implying a negative relationship between NPL and CAR.
The fifth determinant is the coverage ratio (LLC) measured as loan loss provisions to non-performing loans ratio. A high LLC ratio indicates that bank provisions is sufficient to protect banks from losses arising from non-performing loans; therefore, banks with higher coverage ratios should be able to mitigate problems arising from losses associated with non-performing loans, hence, we expect a negative relationship between NPL and LLC.
Next, we incorporate three financial (sector) development indicators into the model: size of banking sector (DGDP) measured as bank deposit to GDP ratio (Demirguc-Kunt and Huizinga, 2000), extent
15
of financial intermediation (PGDP) measured as private credit by domestic banks to GDP ratio (Demirguc-Kunt and Huizinga, 2000; Cihak et al, 2012) and foreign bank presence (FOREIGN) reflecting financial development via financial liberation measured as the ratio of foreign bank assets to total banking assets in the domestic country (Hermes and Lensink, 2004; Giannetti and Ongena, 2009). Foreign bank presence can mitigate connected-lending problems and improve capital
allocation by channelling funds to high quality borrowers that are able to repay, thereby reducing the risk of non-performing loans (Giannetti and Ongena, 2009). Therefore, we expect a negative
relationship between NPL and FOREIGN.
Next, we incorporate four financial structure indicators into the model: banking competitiveness, bank stability, banking concentration and banking crisis indicators. Banking competitiveness is measured by the Lerner index, and banks in highly competitive environments will take deliberate steps to minimise bank risks including non-performing loans in order to gain a favourable risk management perception from investors and regulators, compared to rival banks (Boyd and De Nicolo, 2005; Jimenez et al, 2013). Following this reasoning, countries with a more competitive banking sector should also experience fewer non-performing loans. On the other hand, excessive competition can compel banks to engage in risky lending practices such as reduced loan screening procedures and lax lending criteria which in turn would increase the likelihood of generating higher non-performing loans (Manove et al, 2001; Bolt and Tieman, 2004). Given the two competing arguments, we do not have a definite prediction for the relation between competition and non-performing loans. Banking stability is commonly measured by the z-score index in the literature, defined as the ratio of the return on assets plus the capital ratio divided by the standard deviation of the return on assets (Laeven and Levine, 2009; Foos et al, 2009; Demirgüc-Kunt and Huizinga, 2010). Higher Z-score values indicate increased banking stability and we expect that stable banking sectors should have fewer
non-performing loans, implying a negative relationship between NPL and STABILITY. Also, we control for banking concentration but we do not have a definite prediction for this variable. We also control for banking crises, and expect countries to have higher non-performing loans when they experience a major financial/banking crises. The correlation matrix in Appendix A4 shows that multicollinearity among the variables is not an issue in the analyses. Finally, the model is estimated using the panel OLS regression4 with country and year fixed effects applied.
4. Empirical Results
Section 4.1 presents the regression results using the first-sample dataset consisting of 96 countries while Section 4.2 presents the regression results using the regional dataset
4.1. Pooled Country Sample: Results
Column 1 of Table 1 reports the regression result for the association between non-performing loans and financial development after controlling for bank level determinants influencing non-performing loans. CI coefficient is negatively significant, and indicates that NPLs are inversely associated with bank efficiency, implying that countries with efficient banking systems have fewer non-performing loans. LLC coefficient is also negatively significant indicating an inverse association between NPL and bank loan loss coverage ratio, and implies that banks in countries with higher loan loss coverage
4 We also estimate the model using dynamic panel GMM regression and find results that are not statistically meaningful for the analysis, therefore, we exclude the results from the main analysis and base our inference from the fixed effect OLS regression results. The GMM regression is shown in Appendix A5.
16
ratio have fewer non-performing loans because they are better protected against losses arising from problem loans. PGDP coefficient is positively significant indicating a positive association between NPL and financial intermediation, implying that banking sectors with greater financial intermediation activities have more NPLs. CRISIS coefficient is positively significant as expected, implying that countries that experience major banking crises have higher non-performing loans. BCON coefficient is positively significant, and implies that countries with concentrated banking systems have higher non-performing loans. STABILITY coefficient is negatively significant, indicating an inverse association between NPL and banking stability. This implies that aggregate NPLs is lower in countries with stable banking systems. LERNER coefficient is negatively significant, and indicates that countries with competitive banking systems have fewer non-performing loans. FOREIGN
coefficient is positively significant and indicates that higher NPLs are associated with banking sectors with greater foreign bank assets, which of course, implies that countries with greater foreign bank presence have higher non-performing loans. CAR coefficient reports a positive sign but is statistically insignificant.
Next, we separately regress NPL against its bank-level determinants only. Column 2 of Table 1 report the results. All the variables are significant while LLC coefficient remains negatively significant, consistent with the earlier findings in Column 1. Also, we separately regress NPL on each financial development and structure indicator and exclude the bank-level determinants. Column 3 of Table 1 report the results. PGDP and FOREIGN coefficients remain positively significant, confirming the result in Column 1. Also, CRISIS, BCON, STABILITY and LERNER coefficients are all significant except DGDP coefficient, confirming the earlier results in Column 1.
4.2. Interaction Analysis
From hindsight, we expect some complementarity requiring some interaction analysis. First, we expect countries with highly-liquid banking sectors to have greater financial intermediation activities and thus should have little or no need for government funding. We therefore check whether non-performing loans are significantly fewer or higher in countries whose banking sectors are liquid and have greater financial intermediation. To do this, we interact NPL with loan to deposit ratio (liquidity indicator) and private credit by bank to GDP ratio (financial intermediation indicator). Column 4 of Table 1 report the result. LD*PGDP coefficient is insignificant to draw any meaningful inference. Next, we expect that countries that have efficient banking sectors and greater stability should have fewer non-performing loans. We test for this complementarity by interacting NPL with bank
efficiency ratio (CI) and the stability indicator. Column 5 of Table 1 report the result. CI*STABILITY coefficient is surprisingly positively significant contrary to our expectation, and imply that non-performing loans are positively associated with efficient and stable banking sectors. Further, we test for potential complementarity between banking sector concentration and the size of the banking sector because a large banking sector in several countries may be dominated by few large banks (hence, greater concentration). We test whether this complementarity has any significant impact on non-performing loan. We interact NPL with the banking concentration indicator (BCON) and banking sector size indicator (DGDP) which is the bank deposit to GDP ratio. Column 6 of Table 1 report the result. BCON*DGDP coefficient is statistically insignificant.
4.3. Pooled Regional Results
Next, we introduce the second dataset into the analysis. A look at the regional dataset show that data for banking crisis, foreign bank presence, and banking sector concentration variables are not
17
the regression result. LD coefficient is negatively significant, and indicates that NPLs are inversely associated with bank liquidity, implying that banking sectors with higher liquidity have fewer non-performing loans. CAR coefficient is also negatively significant indicating an inverse association between NPLs and regulatory capital, implying that banks in countries with higher regulatory capital ratios have fewer non-performing loans. The coefficient of the remaining variables are insignificant while LD*PGDP and CI*STABILITY coefficients are also insignificant in column 8 and 9.
Table 1: Non-performing loans and Financial Development
Pooled Country Sample Result Pooled Regional Result (1) (2) (3) (4) (5) (6) (7) (8) (9) Coefficient (t-statistic) Coefficient (t-statistic) Coefficient (t-statistic) Coefficient (t-statistic) Coefficient (t-statistic) Coefficient (t-statistic) Coefficient (t-statistic) Coefficient (t-statistic) Coefficient (t-statistic) c 9.074** (2.55) -0.807 (-0.42) -0.473 (-0.17) 8.438** (2.15) 11.543*** (3.22) 6.901* (1.79) 37.127*** (3.61) 38.254*** (3.67) 41.312*** (2.68) CI -0.105*** (-4.64) 0.037** (1.94) -0.104*** (-4.58) -0.169*** (-5.95) -0.101*** (-4.42) -0.171 (-1.58) -0.174 (-1.60) -0.249 (-1.04) LD -0.010 (-0.88) 0.023** (2.47) -0.005 (-0.26) -0.011 (-0.97) -0.013 (-1.10) -0.126** (-2.38) -0.201* (-1.88) -0.127** (-2.36) NII -0.024 (-1.02) 0.045** (2.51) -0.024 (-1.03) -0.042* (-1.77) -0.026 (-1.08) -0.102 (-0.63) -0.055 (-0.31) -0.095 (-0.57) CAR 0.107 (1.55) 0.214*** (3.57) 0.112 (1.60) 0.152** (2.22) 0.108 (1.57) -0.786*** (-2.79) -0.667** (-2.09) -0.784*** (-2.76) LLC -0.022*** (-3.26) -0.030*** (-5.49) -0.022*** (-3.19) -0.022*** (-3.37) -0.021*** (-3.16) -0.047 (-1.13) -0.054 (-1.32) -0.048 (-1.15) DGDP -0.009 (-0.36) 0.006 (0.32) -0.011 (-0.42) -0.014 (-0.54) 0.024 (0.69) 0.214 (1.34) 0.243 (1.48) 0.207 (1.28) PGDP 0.068** (2.17) 0.064*** (2.89) 0.076** (2.02) 0.077** (2.50) 0.077** (2.42) 0.144 (1.01) -0.078 (-0.25) 0.150 (1.04) CRISIS 1.569** (2.12) 1.794*** (2.86) 1.651** (2.15) 1.209* (1.65) 1.567** (2.12) BCON 0.058** (2.39) 0.059** (2.53) 0.058** (2.37) 0.055** (2.29) 0.102*** (2.62) STABILITY -0.223** (-2.42) -0.159** (-2.03) -0.225** (-2.43) -0.716*** (-4.38) -0.231** (-2.51) -0.121 (-0.58) -0.065 (-0.29) -0.454 (-0.49) FOREIGN 0.059** (2.47) 0.038* (1.63) 0.059** (2.42) 0.068*** (2.86) 0.062** (2.56) LERNER -12.351*** (-5.29) -0.568*** (-4.59) -12.294*** (-5.25) -10.726*** (-4.59) -12.458*** (-5.34) -4.236 (-0.45) -3.875 (-0.41) -5.622 (-0.55) LD*PGDP -0.0001 (-0.39) 0.003 (0.80) CI*STABILITY 0.009*** (3.63) 0.007 (0.37) BCON*DGDP -0.001 (-1.44) Country Fixed Effect?
Yes Yes Yes Yes Yes Yes Yes Yes Yes Year
Fixed Effect?
Yes Yes Yes Yes Yes Yes Yes Yes Yes R² 82.40 65.19 80.91 82.41 83.08 82.51 88.71 88.91 88.75 Adjusted R² 77.37 60.09 76.17 77.32 78.18 77.45 80.97 80.77 80.48 F-statistic 16.39 12.786 17.09 16.18 16.95 16.29 11.457 10.91 10.733 Observations 424 862 464 424 424 424 60 60 60 Column (1)-(6) report regression result for 96 countries for the 2003 to 2014 period and the countries included in the analysis are reported in Appendix A1. Column (7)-(9) report regional regression result for 5 major regions of the world for the 2003 to 2014 period and the regions included in the analysis are reported in Appendix A1 namely Sub-Saharan Africa (developing countries only); Middle East and North Africa (developing countries only); Latin America and Caribbean (developing countries only); Europe and Central Asia (developing countries only); East Asian and pacific (developing countries only). T-statistics are reported in parenthesis. ***, **, * represent 1%, 5% and 10% significance levels. Regression includes country and year fixed effects. Standard errors are not clustered. CI = cost to income ratio, representing bank efficiency. LD = bank loan to bank deposit ratio, representing banking sector liquidity. NII = Non-interest income to total income ratio, representing bank profit from non-loan sources. CAR = ratio of regulatory capital to risk-weight assets, representing regulatory capital. LLC = loan loss coverage measured as loan loss provisions to non-performing loan ratio, represents the ability of bank provisions to protect banks from losses arising from rising non-performing. DGDP = bank deposit to GDP ratio, representing the size of the banking sector. PGDP = private credit by banks to GDP ratio, representing the extent of financial Intermediation. CRISIS = dummy variable that takes the value 1 for countries that had experienced a major banking crisis, and 0 otherwise. BCON = banking concentration. STABILITY = Z-score indicator. FOREIGN = foreign bank assets to total banking asset, representing foreign bank presence. LERNER = banking competitiveness.
18 5. Conclusion
The pooled country analysis for the relationship between aggregate non-performing loans and financial development suggests that foreign bank presence and financial intermediation (i.e. private credit by banks to GDP ratio) is significantly associated with non-performing loans, implying that non-performing loans increases with greater financial development that take the form of greater foreign bank presence and greater financial intermediation.
With respect to financial intermediation, this result could be due to weak supervision of the lending standards of all banks and non-bank financial institutions actively involved in the financial
intermediation process. Weak supervision encourage financial institutions to engage in lax lending standards which subsequently gives rise to non-performing loans when abnormal events sets in that affect borrower’s ability to repay. National bank regulators/supervisor should not only take into account the role that financial development structures play in influencing aggregate non-performing loans but should also ensure the thorough supervision of the lending practices of banks actively involved in the financial intermediation process in the country.
Among the determinants of non-performing loans, bank efficiency, loan loss coverage ratio, competition and banking system stability are inversely associated with NPLs while NPLs are positively associated with banking crises and bank concentration. For the regional sample, the
graphical analysis show that NPLs are negatively related to financial development while the empirical analysis do not show any significant relationship although NPLs are observed to be significantly associated with regulatory capital ratios and bank liquidity, implying that banking sectors with greater regulatory capital and liquidity experience fewer NPLs.
Reference
Abd Karim, M. Z., Sok, G. C., & Hassan, S. (2010). Bank efficiency and non-performing loans: Evidence from Malaysia and Singapore. Prague Economic Papers.
Anastasiou, D., Louri, H., & Tsionas M. (2016). Determinants of non-performing loans: Evidence from Euro-area countries. Finance Research Letters. 18, 116-119.
Beck, R., Jakubik, P., & Piloiu, A. (2015). Key determinants of non-performing loans: new evidence from a global sample. Open Economies Review, 26(3), 525-550.
Bolt, W., & Tieman, A. F. (2004). Banking competition, risk and regulation. The Scandinavian Journal of Economics, 106(4), 783-804.
Boudriga, A., Boulila Taktak, N., & Jellouli, S. (2009). Banking supervision and nonperforming loans: a cross-country analysis. Journal of Financial Economic Policy, 1(4), 286-318.
Boyd, J. H., & De Nicolo, G. (2005). The theory of bank risk taking and competition revisited. The Journal of Finance, 60(3), 1329-1343.
Čihák, M., Demirgüç-Kunt, A., Feyen, E., & Levine, R. (2012). Benchmarking financial development around the world. World Bank Policy Research Working Paper, 6175, 1-56.
19
Demirgüç-Kunt, A., & Huizinga, H. (2000). Financial structure and bank profitability. World Bank Policy Research Working Paper, 2430.
Demirgüc-Kunt, A. & Huizinga, H. (2010). Bank Activity and Funding Strategies: The Impact on Risk and Returns. Journal of Financial Economics, 98, 626-650.
DeYoung, R., & Rice, T. (2004). Noninterest income and financial performance at US commercial banks. Financial Review, 39(1), 101-127.
Espinoza, R. A., & Prasad, A. (2010). Nonperforming loans in the GCC banking system and their macroeconomic effects. IMF Working Papers 10/224, 1-24.
Foos, D., Norden L. & Weber, M. (2010). Loan Growth and Riskiness of Banks. Journal of Banking and Finance, 34(12), 2929-2940.
Giannetti, M., & Ongena, S. (2009). Financial integration and firm performance: Evidence from foreign bank entry in emerging markets. Review of Finance, 13(2), 181-223.
Hermes, N., & Lensink, R. (2004). Foreign bank presence, domestic bank performance and financial development. Journal of Emerging Market Finance, 3(2), 207-229.
Jiménez, G., Lopez, J. A., & Saurina, J. (2013). How does competition affect bank risk-taking? Journal of Financial Stability, 9(2), 185-195.
Klein, N. (2013). Non-performing Loans in CESEE: Determinants and Impact on Macroeconomic Performance. IMF Working Paper, 01, 27.
Laeven, L. & Levine, R. (2009). Bank Governance, Regulation and Risk-Taking. Journal of Financial Economics, 93(2), 259-275.
Levine, R. (1997). Financial development and economic growth: views and agenda. Journal of Economic Literature, 35(2), 688-726.
Louzis, D. P., Vouldis, A. T., & Metaxas, V. L. (2012). Macroeconomic and bank-specific determinants of non-performing loans in Greece: A comparative study of mortgage, business and consumer loan portfolios. Journal of Banking & Finance, 36(4), 1012-1027.
Manove, M., Padilla, A. J., & Pagano, M. (2001). Collateral versus project screening: A model of lazy banks. Rand Journal of Economics, 726-744.
Nkusu, M. (2011). Non-performing Loans and Macro financial Vulnerabilities in Advanced Economies. IMF WP/11/161, 1-27.
Ozili, P. K. (2015). How Bank Managers Anticipate Non-Performing Loans. Evidence from Europe, US, Asia and Africa. Applied Finance and Accounting, 1(2), 73-80.
Ozili, P. K. (2016). Bank Profitability and Capital Regulation: Evidence from Listed and non-Listed Banks in Africa. Journal of African Business, 1-26.
Skarica, B. (2014). Determinants of Non-Performing Loans in Central and Eastern European Countries. Financial Theory and Practice, 38(1), 37-59.
20
Smith, R., Staikouras, C. & Wood, G. (2003). Non-interest income and total income stability. Working Paper No. 198, Bank of England.
Tanasković, S., & Jandrić, M. (2015). Macroeconomic and institutional determinants of non-performing loans. Journal of Central Banking Theory and Practice, 4(1), 47-62.
Van den End, J. W. (2016). A macroprudential approach to address liquidity risk with the Loan-to-Deposit ratio. The European Journal of Finance, 22(3), 237-253.
21
Appendix
Appendix A1: Non-performing loans (Trend)
S/N Country Pre-Financial Crisis Crisis Post-Financial Crisis
S/N Country 2003 2004 2005 2006 2007 2008 2009 2010 2011 2012 2013 2014 1 Algeria 21.1 18.3 14.4 11.7 10.6 9.2 2 Argentina 17.7 10.7 5.2 3.4 2.7 3.1 3.5 2.1 1.4 1.7 1.7 2 3 Australia 0.3 0.2 0.6 0.6 0.6 1.3 2 2.1 2 1.8 1.5 1.1 4 Austria 3 2.7 2.6 2.7 2.2 1.9 2.3 2.8 2.7 2.8 2.9 3.5 5 Bahrain 2.3 3.9 5.1 4.9 5.8 5.6 4.6 6 Bangladesh 22.1 17.5 5.8 9.7 8.6 9.4 7 Belarus 3.7 2.8 3.1 2.8 1.9 1.7 4.2 3.5 4.2 5.5 4.4 4.4 8 Belgium 2.6 2.3 2 1.7 1.4 1.7 3.1 2.8 3.3 3.8 4.3 4.4 9 Bolivia 16.7 14 11.3 8.7 5.6 4.3 3.5 2.2 1.7 1.5 1.5 1.5 10 Bosnia and Herzegovina 8.4 6.1 5.3 4 3 3.1 5.9 11.4 11.8 13.5 15.1 14 11 Botswana 2.6 3.6 4.1 12 Brazil 4.1 2.9 3.5 3.5 3 3.1 4.2 3.1 3.5 3.4 2.9 2.9 13 Bulgaria 3.2 2 2.2 2.2 2.1 2.4 6.4 11.9 15 16.6 16.9 16.7 14 Burundi 9.4 7.4 8.2 9.9 10.9 15 Cameroon 10.1 11.4 11.6 10.3 9.7 16 Canada 1.2 0.7 0.5 0.4 0.4 0.8 1.3 1.2 0.8 0.7 0.6 0.5 17 Chile 1.6 1.2 0.9 0.7 0.8 1 2.9 2.7 2.3 2.2 2.1 2.1 18 China 20.4 13.2 8.6 7.1 6.2 2.4 1.6 1.1 1 1 1 1.2 19 Colombia 6.8 3.3 2.7 2.7 3.2 3.9 4 2.9 2.5 2.8 2.8 2.9 20 Congo, Rep. 1 1.1 1.5 1.2 2.5 21 Costa Rica 1.7 2 1.4 1.4 1.2 1.5 2.1 1.9 1.8 1.7 1.7 1.6 22 Croatia 8.9 7.5 6.2 5.2 4.8 4.9 7.7 11.1 12.3 13.8 15.4 16.7 23 Cyprus 3.6 4.5 5.8 10 18.4 38.6 44.9 24 Czech Republic 4.9 4 3.9 3.6 2.4 2.8 4.6 5.4 5.2 5.2 5.2 5.6 25 Denmark 0.8 0.7 0.2 0.6 1.2 3.3 4.1 3.7 6 4.6 4.4 26 Djibouti 9.3 8.3 9.4 11.4 14.5 18
27 East Asia & Pacific (developing only)
13.9 11.9 9.1 7.5 6.35 4.6 3.55 3.4 2.75 2.3 2.3 2.1
28 Egypt, Arab Rep. 24.2 23.6 26.5 18.2 19.3 14.8 13.4 13.6 10.9 9.8 9.3 8.9
29 Europe & Central Asia (developing only) 7.35 6.3 3.8 3.5 3 4.2 7.15 10.2 9.85 9.8 11.6 12.4 30 Finland 0.5 0.4 0.3 0.2 0.3 0.4 0.6 0.6 0.5 0.5 31 France 4.8 4.2 3.5 3 2.7 2.8 4 3.8 4.3 4.3 4.5 4.2 32 Gabon 13.9 16 14.1 10.7 7.6 8.5 7.2 9.9 4.4 3.4 3.5 33 Georgia 2.4 2 3.8 0.8 0.8 4.1 6.3 5.9 4.5 3.7 3 3 34 Germany 5.2 4.9 4.1 3.4 2.7 2.9 3.3 3.2 3 2.9 2.7 2.3 35 Ghana 18.3 16.3 13 7.9 6.4 7.7 16.2 17.6 14.1 13.2 12 11.3 36 Greece 7 7 6.3 5.4 4.6 4.7 7 9.1 14.4 23.3 31.9 33.8 37 Grenada 3.46 5.9 7.6 9.4 11.8 13.8 14.6
22
38 Guatemala 6.5 7.1 2.4 2.3 1.6 2.2 2.7 2.1 1.6 1.3 1.2 1.3
39 Honduras 4 3.1 4.3 4.7 3.7 2.9 3.3 3.4 3.3
40 Hong Kong SAR, China 3.9 2.3 1.4 1.1 0.8 1.2 1.6 0.8 0.7 0.6 0.5 0.5 41 Hungary 2.6 1.8 2.3 2.6 2.3 3 8.2 10 13.7 16 16.8 15.6 42 Iceland 2.1 0.9 1.1 0.8 14.1 18.3 11.6 6.3 4.3 43 India 8.8 7.2 5.2 3.5 2.7 2.4 2.2 2.4 2.7 3.4 4 4.3 44 Indonesia 6.8 4.5 7.6 6.1 4 3.2 3.3 2.5 2.1 1.8 1.7 2.1 45 Ireland 0.9 0.8 0.7 0.7 0.8 1.9 9.8 13 16.1 25 25.7 20.7 46 Israel 2.6 2.5 2.3 2 1.5 1.5 1.4 3.1 3.4 3.5 2.9 2.2 47 Italy 6.7 6.6 5.3 6.6 5.8 6.3 9.4 10 11.7 13.7 16.5 17.3 48 Japan 5.2 2.9 1.8 1.8 1.5 2.4 2.4 2.5 2.4 2.4 2.3 1.9 49 Jordan 15.5 10.3 6.6 4.3 4.1 4.2 6.7 8.2 8.5 7.7 7 5.6 50 Kenya 34.9 29.3 10.6 8.8 8 6.3 4.4 4.6 5 5.5 51 Korea, Rep. 2.6 1.9 1.2 0.8 0.7 0.6 0.6 0.6 0.5 0.6 0.6 0.6
52 Latin America & Caribbean (developing only) 6.65 4.85 3.1 3.3 2.7 3.1 3.7 3 2.9 2.8 2.8 2.6 53 Lebanon 17.7 16.4 13.5 10.1 7.5 6 4.3 3.8 3.8 4 4 54 Lesotho 1 3 3 3 1.8 3 3 2.1 2.5 3.7 55 Luxembourg 0.5 0.3 0.2 0.1 0.4 0.6 0.7 0.2 0.4 0.1 0.2 56 Macedonia 22.4 17 15 11.2 7.5 6.7 8.9 9 9.5 10.1 10.9 10.8 57 Malaysia 13.9 11.7 9.4 8.5 6.5 4.8 3.6 3.4 2.7 2 1.8 1.6 58 Malta 6.5 7.4 5.9 5.9 5.5 5.8 7 7.1 7.8 8.9 9 59 Mauritania 45.3 39.2 25.7 20.4 60 Mauritius 3 2.5 2 3.3 2.8 2.8 3.6 4.2 4.9 61 Mexico 3.2 2.5 1.5 1.8 2.3 3 2.8 2 2.1 2.4 3.2 3
62 Middle East & North Africa (developing only) 21.45 19.4 16.4 12.2 9 7.5 11.25 10.65 10.15 10.6 9.95 9.05 63 Morocco 18.7 19.4 15.7 10.9 7.9 6 5.5 4.8 4.8 5 5.9 6.9 64 Mozambique 14.4 5.9 3.5 3.1 2.6 1.9 1.8 1.9 2.6 3.2 2.3 3.3 65 Namibia 3.9 2.4 2.3 2.6 2.8 3.1 2.7 2 1.5 1.3 1.3 1.5 66 Netherlands 2 1.5 1.7 3.2 2.8 2.7 3.1 3.2 3.1 67 New Zealand 0.3 0.9 1.7 2.1 1.7 1.4 1 0.9 68 Nigeria 20.5 21.6 9.3 9.5 6.3 37.3 20.1 5.8 3.7 3.4 3 69 Norway 1.6 1 0.7 0.6 0.5 0.7 1.3 1.5 1.7 1.5 1.3 1.1 70 Paraguay 20.6 10.8 6.5 3.3 1.3 1.1 1.6 1.3 1.7 2.1 2 1.8 71 Peru 14.8 9.5 6.3 4.1 2.7 2.2 2.7 3 2.9 3.2 3.5 4 72 Philippines 16.1 14.4 10 7.5 5.8 4.6 3.5 3.4 2.6 2.2 2.4 2 73 Poland 21.2 14.9 11 7.4 5.2 2.8 4.3 4.9 4.7 5.2 5 4.8 74 Portugal 2.4 2 1.5 2.8 3.6 4.8 5.2 7.5 9.8 10.6 11.9 75 Qatar 1.2 1.7 2 1.7 1.7 1.9 1.7 76 Romania 8.3 8.1 1.4 1.8 2.6 2.7 7.9 11.9 14.3 18.2 21.9 13.9 77 Rwanda 33 31 29 25 16.9 12.6 13.1 11.3 8.2 6 7 5.2 78 Senegal 13.3 12.6 11.9 16.8 18.6 17.4 18.7 20.2 16.2 18.4 19.1 20.3 79 Seychelles 4.4 2.3 2 3.8 5.5 8.1 9 9.2 8 80 Sierra Leone 7.4 16.5 26.8 26.9 25.6 17.9 10.6 15.6 15.1 14.7 22.4 33.4
23 81 Singapore 6.7 5 3.8 2.8 1.5 1.4 2 1.4 1.1 1 0.9 0.8 82 Slovenia 3.7 3 2.5 4.2 5.8 8.2 11.8 15.2 13.3 11.7 83 South Africa 2.4 1.8 1.8 1.1 1.4 3.9 5.9 5.8 4.7 4 3.6 3.2 84 Spain 1 0.8 0.8 0.7 0.9 2.8 4.1 4.7 6 7.5 9.4 8.5 85 Sri Lanka 3.8 3.6 5.6 4.2 86 Sub-Saharan Africa 13.6 12.6 7 7.7 6.95 6.95 7.6 8.6 5.6 4.6 5.1 5.2 87 Swaziland 2 7.2 7 7.7 7.5 7.6 8.6 7.8 7.5 9.7 6.8 6.9 88 Sweden 1.9 1.1 0.8 0.8 0.1 0.5 0.8 0.8 0.7 0.7 0.6 1.2 89 Switzerland 1.3 0.9 0.5 0.3 0.3 0.9 1.1 0.9 0.8 0.8 0.8 0.7 90 Tanzania 7.8 5.4 6.4 5.1 6.6 91 Thailand 13.5 11.9 9.1 8.1 7.9 5.7 5.2 3.9 2.9 2.4 2.3 2.3 92 Tunisia 24.2 23.6 20.9 13.2 13 13.3 14.9 15.2 15.8 93 Turkey 11.5 6.5 5 3.9 3.3 3.4 5 3.5 2.6 2.7 2.6 2.7 94 Uganda 7.2 2.2 2.3 2.9 4.1 2.2 4.2 2.1 2.2 4.2 5.6 4.1 95 Ukraine 28.3 30 5.6 4 3 3.9 13.7 15.3 14.7 16.5 12.9 19 96 United Arab Emirates 14.3 12.5 8.3 6.4 2.6 2.3 4.3 5.6 7.2 8.4 7.3 6.5 97 United Kingdom 2.5 1.9 1 0.9 0.9 1.6 3.5 4 4 3.6 3.1 1.8 98 United States 1.1 0.8 0.7 0.8 1.4 3 5 4.4 3.8 3.3 2.5 1.9 99 Uruguay 14.3 4.7 5.6 3.7 1.1 1 3.8 2.4 1.5 1.3 1.3 100 Vietnam 2.2 1.8 2.1 2.8 3.4 101 World 5.75 4.2 3.5 3.1 2.7 3 4.3 4.55 4.1 4.1 4.4 4.35 102 Yemen, Rep. 18 13.9 17.7 21.2 25.5 21.7 24.7 103 Zambia 14.8 10.4 8.1 7
24
A2: First-Sample Summary of Descriptive statistics All ratios are expressed in percentages for expositional convenience.
CI LD NII CAR NPL LLC DGDP PGDP CRISIS BCON ZSCORE FOREIGN LERNER
Mean 54.9 104.8 35.9 15.8 6.3 70.4 62.1 60.1 0.1 69.7 11.4 38.1 0.3 Median 54.9 89.4 34.6 15.1 3.7 60.2 47.8 47.2 0.0 69.3 9.4 27.0 0.3 Maximum 218.1 879.7 80.0 43.4 45.3 322.1 479.7 262.5 1.0 100.0 41.8 100.0 0.9 Minimum 0.0 17.7 0.0 1.8 0.1 0.0 6.10 2.0 0.0 23.4 -12.6 0.0 -1.6 Std. Dev. 14.9 77.3 12.3 4.6 6.6 42.7 57.4 47.6 0.3 18.8 8.0 32.1 0.1 Observations 1128 1108 1127 1005 994 924 1105 1117 864 1062 1131 796 921
A3: Second-Sample Summary of Descriptive statistics (Regional)
CI LD NII CAR NPL LLC DGDP PGDP ZSCORE LERNER
Regions mean mean mean mean mean mean mean mean mean mean
Sub-Saharan African 58.44 69.49 43.86 16.19 7.63 52.1 19.145 15.72 7.77 0.29 Middle East and North Africa. 47.36 38.70 31.15 13.95 12.3 65.27 53.51 28.93 19.50 0.32 Latin America and Caribbean 61.98 87.46 30.05 15.22 3.46 121.43 38.72 31.59 13.61 0.25 Europe and Central Asia 56.58 108.10 36.44 19.68 7.43 61.82 30.10 28.72 6.31 0.27 East Asian and pacific 48.13 82.05 30.14 15.69 5.81 52.19 38.36 33.10 9.89 0.32
World 55.04 83.89 36.35 15.34 4.00 64.77 40.28 33.93 9.82 0.28
All regional data for 2003 to 2014 is available from Global Financial Development indicators at World Bank Database. All ratios are expressed in percentages for expositional convenience.
25
A4: Correlation Table:
Probability CI LD NII CAR NPL LLC DGDP PGDP CRISIS BCON STABILITY FOREIGN LERNER
CI 1.000 LD -0.068 1.000 0.162 NII 0.330*** -0.109** 1.000 0.000 0.025 CAR 0.081* -0.178*** 0.119** 1.000 0.097 0.000 0.013 NPL 0.0212 -0.142*** 0.072 0.176*** 1.000 0.662 0.003 0.140 0.000 LLC 0.057 -0.021 0.029 0.042 -0.175*** 1.000 0.234 0.666 0.548 0.394 0.000 DGDP -0.239*** -0.171*** -0.041 -0.173*** -0.190*** -0.186*** 1.000 0.000 0.000 0.395 0.000 0.000 0.000 PGDP -0.218*** 0.374*** -0.077 -0.361*** -0.244*** -0.174*** 0.618*** 1.000 0.000 0.000 0.115 0.000 0.000 0.000 0.000 CRISIS 0.081* 0.140*** 0.038 -0.159*** 0.034 -0.187*** 0.226*** 0.4046*** 1.000 0.095 0.004 0.432 0.001 0.483 0.000 0.000 0.000 BCON -0.042 0.019 0.113** 0.008 -0.031 -0.074 0.061 0.281*** 0.109** 1.000 0.385 0.690 0.019 0.874 0.518 0.129 0.209 0.000 0.024 STABILITY -0.126** -0.059 -0.107** 0.051 -0.112** 0.054 0.325*** 0.149*** -0.088* 0.092* 1.000 0.009 0.221 0.026 0.294 0.021 0.266 0.000 0.002 0.068 0.057 FOREIGN 0.119** -0.212*** 0.007 0.144*** 0.073 -0.131*** -0.066 -0.319*** -0.153*** -0.018 -0.212*** 1.000 0.014 0.000 0.884 0.003 0.130 0.007 0.173 0.000 0.002 0.704 0.000 LERNER -0.427*** -0.128*** -0.196*** 0.264*** -0.033 0.109** 0.042 -0.091* -0.313*** 0.002 0.179*** 0.012 1.000 0.000 0.008 0.000 0.000 0.502 0.023 0.391 0.061 0.000 0.965 0.000 0.805
26
A5 : Non-performing loans and Financial Development Pooled Country-Sample GMM Result
(1) (2) (3) (4) (5) (6) Coefficient (t-statistic) Coefficient (t-statistic) Coefficient (t-statistic) Coefficient (t-statistic) Coefficient (t-statistic) Coefficient (t-statistic) NPLt-1 0.589*** (8.89) 0.582*** (7.635) 0.518*** (-11.51) 0.655*** (8.21) 0.596*** (8.78) 0.614*** (8.90) CI -0.062 (-1.17) 0.005 (1.08) -0.075 (-1.44) -0.045 (-0.51) -0.055 (-1.06) LD 0.045 (0.95) 0.046*** (7.74) 0.144 (1.51) 0.059 (1.08) 0.067 (1.09) NII -0.017 (-0.16) 0.059*** (6.21) -0.059 (-0.55) -0.005 (-0.05) -0.063 (-0.54) CAR 0.064 (0.42) 0.153*** (7.75) 0.096 (0.60) 0.084 (0.37) 0.115 (0.63) LLC 0.037 (1.56) -0.038*** (-8.03) 0.020 (0.74) 0.035 (1.47) 0.036 (1.47) DGDP -0.096 (-0.72) -0.247*** (-3.79) -0.082 (-0.63) -0.081 (-0.57) -0.012 (-0.06) PGDP 0.200 (1.41) 0.319*** (3.93) 0.291* (1.86) 0.178 (1.16) 0.139 (0.81) CRISIS -2.085 (-0.76) -1.601 (-0.84) -1.173 (-0.40) -1.608 (-0.58) -1.853 (-0.65) BCON 0.225*** (3.38) 0.182*** (4.35) 0.249*** (3.64) 0.219*** (2.98) 0.352* (1.87) STABILITY 0.032 (0.11) -0.494*** (-3.33) 0.072 (0.26) 0.130 (0.34) 0.068 (0.23) FOREIGN -0.141 (-1.38) -0.113* (-1.69) -0.081 (-0.74) -0.171 (-1.54) -0.108 (-0.95) LERNER -30.77*** (-5.92) -25.59*** (-7.29) -31.89*** (-5.92) -30.91*** (-5.78) -34.83*** (-4.25) LD*PGDP -0.001 (-1.20) CI*STABILITY -0.003 (-0.37) BCON*DGDP -0.002 (-0.73) Country Fixed Effect?
Yes Yes Yes Yes Yes Yes Year
Fixed Effect?
Yes Yes Yes Yes Yes Yes J-statistic 12.71 50.44 20.95 11.34 12.86 12.65 P(J-statistic) 0.625 0.416 0.399 0.658 0.538 0.554 Observations 332 683 364 332 332 332
Column (1)-(6) report regression result for 96 countries for the 2003 to 2014 period and the countries included in the analysis are reported in Appendix A1. T-statistics are reported in parenthesis. ***, **, * represent 1%, 5% and 10% significance levels. GMM first-difference regression. Regression includes country first-difference and year fixed effects. Standard errors are not clustered.
27
A6: Data description and source Indicator Indicator Name Source
BCON Bank concentration Global financial development indicator archived in World Bank database. CI Bank cost to income ratio, measuring
efficiency.
Global financial development indicator archived in World Bank database. LD Bank credit to bank deposits ratio, measuring
banking sector liquidity.
Global financial development indicator archived in World Bank database. DGDP Bank deposits to GDP ratio, measuring size of
banking sector
Global financial development indicator archived in World Bank database. NPL Bank nonperforming loans to gross loans ratio Global financial development indicator
archived in World Bank database. NII Bank noninterest income to total income ratio,
measuring bank profitability from non-loan sources
Global financial development indicator archived in World Bank database.
CAR Bank regulatory capital to risk-weighted assets ratio, measuring bank capital regulation
Global financial development indicator archived in World Bank database. CRISIS Banking crisis dummy (1=banking crisis,
0=none)
Global financial development indicator archived in World Bank database. FOREIGN Foreign bank assets among total bank assets
ratio, measuring financial liberalisation
Global financial development indicator archived in World Bank database. LERNER Lerner index, measuring competition Global financial development indicator
archived in World Bank database. LLC Provisions to nonperforming loans ratio,
measuring loan loss coverage ratio
Global financial development indicator archived in World Bank database. PGDP Private credit by deposit money banks to GDP
ratio, measuring extent of financial intermediation
Global financial development indicator archived in World Bank database.
STABILITY Bank Z-score, measuring banking stability Global financial development indicator archived in World Bank database.