Pepperdine University
Pepperdine Digital Commons
School of Public Policy Working Papers
School of Public Policy
1-2-2013
A Basic Analysis of Entry and Exit in the US
Broadband Market, 2005-2008
James Prieger
Pepperdine University, [email protected]
Michelle Connolly
Duke University
Follow this and additional works at:
http://digitalcommons.pepperdine.edu/sppworkingpapers
Part of the
Communication Technology and New Media Commons
,
Economics Commons
, and
the
Public Affairs, Public Policy and Public Administration Commons
This Article is brought to you for free and open access by the School of Public Policy at Pepperdine Digital Commons. It has been accepted for inclusion in School of Public Policy Working Papers by an authorized administrator of Pepperdine Digital Commons. For more information, please [email protected].
Recommended Citation
Prieger, James and Connolly, Michelle, "A Basic Analysis of Entry and Exit in the US Broadband Market, 2005-2008" (2013). Pepperdine University,School of Public Policy Working Papers.Paper 42.
A Basic Analysis of Entry and
Exit in the US Broadband
Market, 2005-2008
Michelle Connolly James E. Prieger
Department of Economics School of Public Policy
Duke University Pepperdine University
Room 213 Social Sciences 24255 Pacific Coast Highway
Durham, NC 27708 Malibu, CA 90263-7490
Abstract: We conduct a basic yet thorough analysis of entry and exit in the US broadband market, using a complete FCC census of providers from 2005 to 2008. There is a tremendous amount of (simultaneous) entry and exit in the US broadband market. Most entry is from existing providers expanding into new geographic areas. Entry and exit vary widely across the various modes of provision, which argues against treating broadband as a homogenous service in theoretical or empirical work. The highest entry rates also generally have the highest entrant shares. Entry rates display positive autocorrelation, and the same is true for exit. There is also positive correlation between the entry and exit rates at various leads and lags, suggesting that there are systematic differences among the broadband types in the height of entry and exit barriers. We discuss some implications these results may have for both policy purposes and future work in the broadband market.
A Basic Analysis of Entry and
Exit in the US Broadband
Market, 2005-2008
*
Contents
I. Introduction ... 3
II. Measuring the Entry and Exit Broadband Providers ... 6
A. Data Construction ... 6
1. Broadband provider data ... 6
2. ZIP code data ... 8
3. Limitations of the data ... 8
B. Entry and Exit Measures ... 10
1. Market definition ... 11
2. Measures of entry ... 12
3. Measures of exit ... 14
4. Sources of entry and exit ... 15
5. Adjustment to exclude single-round entry and exit ... 16
III. Basic Analysis of Entry and Exit ... 16
A. Entry and Exit Rates ... 17
B. Variation in Entry and Exit across Broadband Types ... 22
1. Variation across types of service ... 22
2. Variation across geographic regions ... 25
C. Correlation in Entry and Exit ... 25
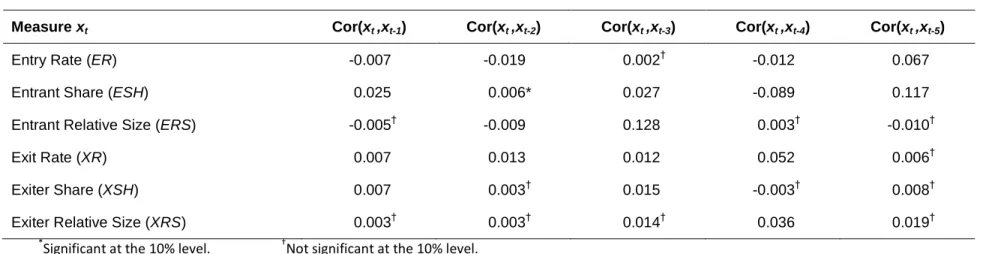
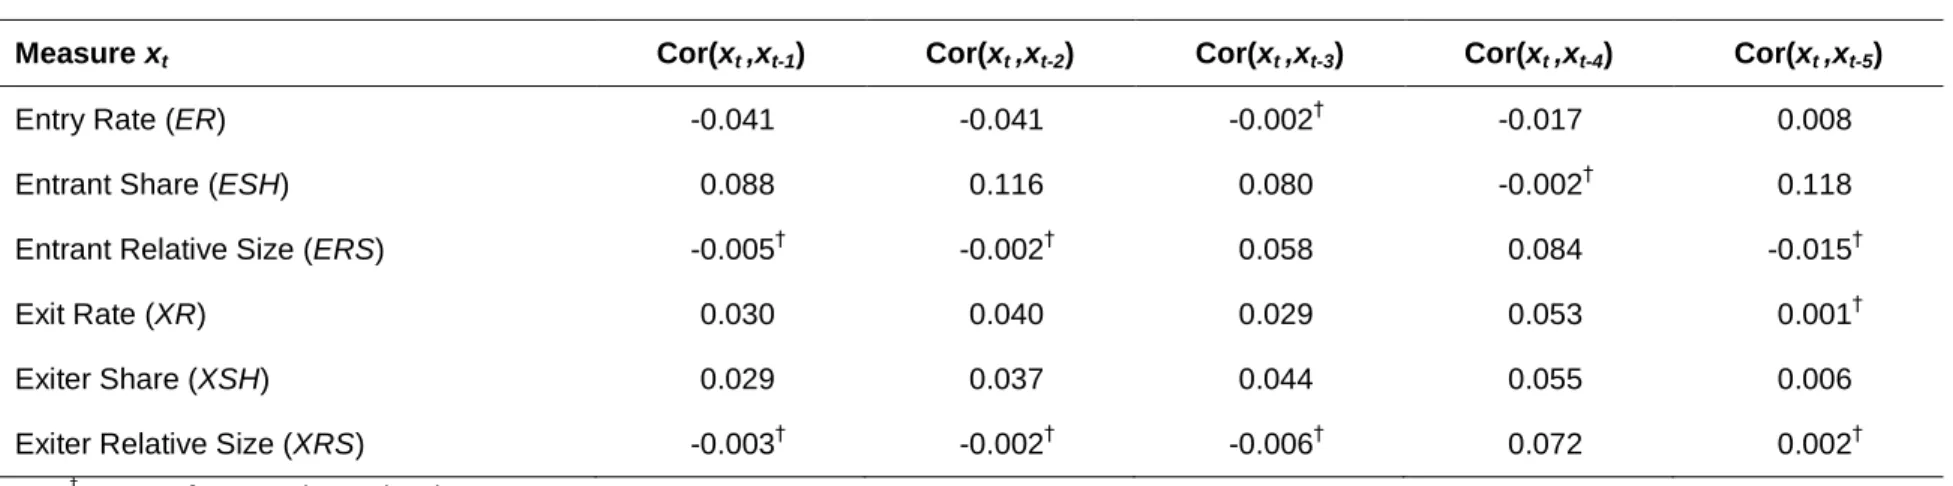
1. Autocorrelation of entry and of exit ... 25
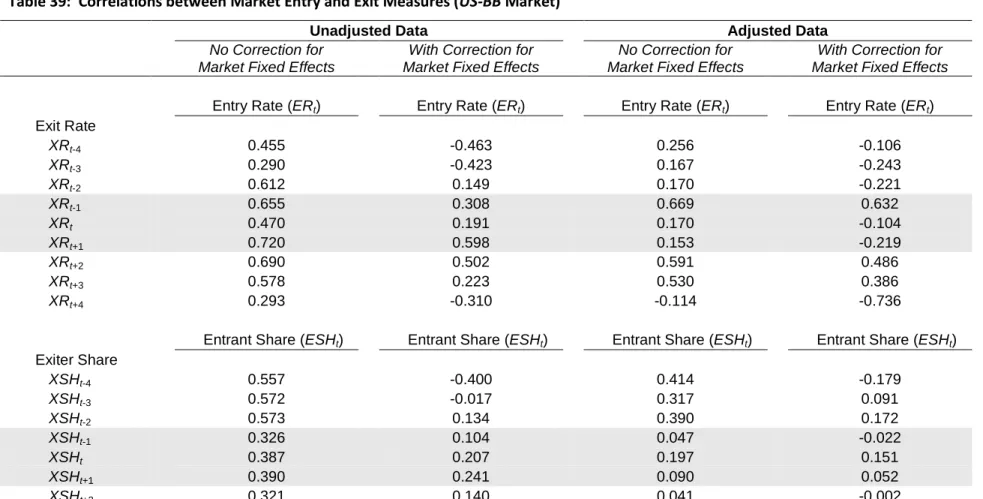
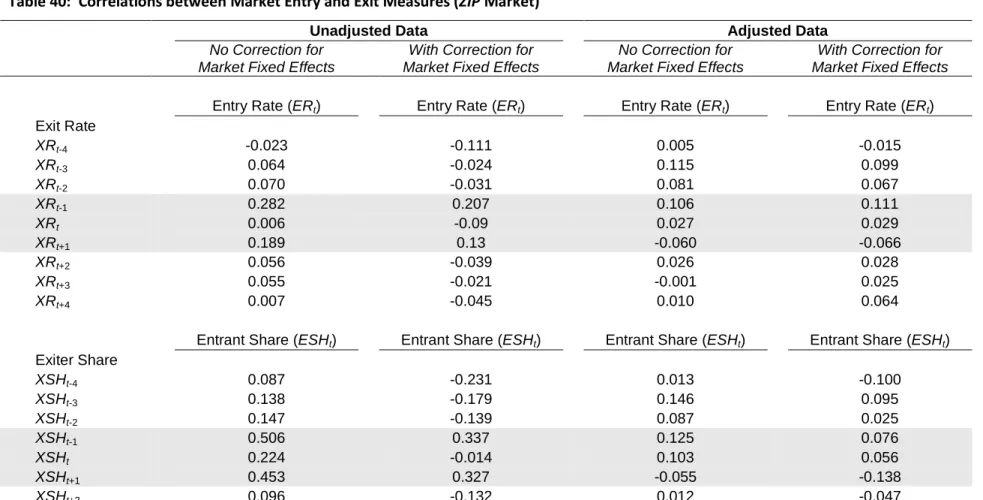
2. Correlation between entry and exit ... 26
IV. Conclusions ... 28
References ... 31
* We thank the staff of the Industry Analysis and Technical Division of the Wireline Competition Bureau at
the Federal Communications Commission, particularly Division Chief Roger Woock, Ellen Burton, Jim Eisner, and especially Ken Lynch for providing and explaining the Form 477 data to us. The opinions and conclusions expressed herein (and any errors) are those of the authors and do not necessarily represent the views of the FCC or any of its staff.
I.
Introduction
The importance of broadband to modern life as consumers, citizens, students, producers of goods and services, and providers of public safety is well established. The entire edifice of the market for broadband rests on the foundation of its infrastructure. Since demand for broadband service cannot be satisfied and the enjoyment of the benefits of broadband usage cannot begin until supply is available, it is critical to monitor and explore the evolution of the market on the supply side. The broadband market is also of particular interest given the importance of broadband for local economic development, labor productivity, and GDP growth (Gillett et al., 2006; Kolko, 2010; Greenstein and McDevitt, 2009; Prieger, forthcoming). Broadband markets are also a potentially fertile laboratory for the economist to develop and test theories about market dynamics.
Despite the importance of the broadband market, however, little work has been done on the dynamics of the market. Most studies of entry in the market for broadband service provision are static in nature. In a typical such study, a cross-section of either the number of broadband firms or an indicator for the presence of at least one firm in the local area is regressed on various market and demographic characteristics (Prieger, 2003; Grubesic and Murray, 2004; Flamm, 2005, Prieger and Church, 2012). These studies of broadband availability in the US show that firms’ decisions to deploy network resources and offer service in a local area depend on economic and regulatory considerations. Demand factors such as the size of the local market, average income in the area, and other demographic characteristics such as the education and age profile of the area have all been shown to affect broadband penetration (Prieger, 2003; Grubesic and Murray, 2004; Flamm, 2005; Flamm and Chaudhuri, 2007; Prieger and Hu, 2008b).1 Some of these studies also show that variables that are proxies for cost factors, such as population density, terrain, etc., also influence broadband penetration in the expected ways. Due to low population density and generally rougher topography than urban areas, rural areas are less likely to have broadband available at all, or more likely to be served only with lower-speed broadband or by few providers (Stenberg et al., 2009; Li et al., 2011; Prieger, forthcoming). Intramodal and intermodal competition among providers, both actual and potential, also affects the incentives to enter the local broadband markets (Denni and
Gruber, 2007; Prieger and Hu, 2008a; Wallsten and Mallahan, 2010). Regulatory policy that alters the expected return on broadband network investment, such as mandated unbundling of network elements for use by competitors, can also impact the deployment decision by (Prieger and Lee, 2008). Almost all these results have been gleaned from cross-sectional, static studies of current market participants.
This paper examines the FCC’s data on where broadband service was offered from June 2005 to June 2008. By linking broadband service providers’ data submissions over time, we are able to measure and investigate the sources and determinants of entry and exit in the US broadband market. We define markets four ways for purposes of study: the geographical extent of the market is either the nation or a ZIP code area, and the product market extent is either a single broadband type or all types.
Instead of jumping directly to regressions or structural modeling of the industry, we instead conduct a more basic empirical investigation of entry and exit in this paper. In the terms of Geroski (1995), our aim is to set out “stylized facts” coming from basic descriptions of the data, instead of stylized (or specific) results from regressions. In taking this approach, we apply the lessons from recent decades in the IO literature that establishing basic descriptive facts about industry entry and exit can motivate better theoretical and empirical modeling. As an example, Einav and Levin (2010) cite the findings of Dunne, Roberts, and Samuelson (1988) (hereafter denoted DRS) and others that there is a great deal of heterogeneity between firms’ entry and exit patterns. DRS’s findings motivated a wave of new theoretical and empirical models of industry dynamics including firm heterogeneity, simultaneous entry and exit, and other “real world” features (e.g., Jovanovic, 1982; Hopenhayn, 1992; Ericson and Pakes 1995). These models were better able to account for the stylized facts the literature had accumulated, including that a great deal of exit can coexist with entry, and that entry and exit rates are highly correlated across industries (Geroski, 1995), so that industry-specific factors appear to be important in explaining market dynamics.
Toward the goal of building a set of basic facts about market dynamics in broadband markets, we address several questions in this paper. How do the market dynamics compare with what is known about other markets? How much entry in the local markets comes from truly new entrants, and how much is from expansion of existing firms? Are there substantial differences in entry and exit across geographic and product-type markets? And finally, how much turnover of firms is there? We close this section with a preview of our findings regarding these questions.
First, how do entry and exit in the broadband market compare with that in other markets? The striking conclusion is that there is a tremendous amount of dynamic activity in the US broadband market. In the national market, the entry rate averages 14-19% annually, which is greater than the entry rates the economic literature has found for many other industries. The exit rate for broadband is also higher than for other industries, but not as high as the entry rate, so that net entry averages 3.1% annually. With narrower geographic or service type market definitions, the entry rates average from 24% to an astounding 49% per annum. Thus, the dynamic element in the market is huge.
The second question, whence comes entry, has policy relevance to questions regarding competition and mergers in the telecommunications and broadband industry. While the FCC pays great attention to potential dominance by large providers at the national level (e.g., their denial of the recently proposed AT&T/T-Mobile merger), what matters for consumers is the number of options available where they live. 2 We demonstrate that at least three in four entrants at the ZIP code level expand geographically into the area. When the local markets are delineated by service type, another one in every five entrants is a firm already operating in the area that diversifies its product mix by offering another type of broadband access. These entrants are also much larger than de novo entrants on average. Thus, most entry and much of the dynamism in the market, along with the new options that entry provides for consumers, comes from large, existing firms.
The third question of heterogeneity in dynamics among areas and broadband service types also has policy relevance. Since the main form of competition in broadband markets at the time was between the incumbent DSL provider and the local franchise cable company offering cable modem service, it is important to understand how the dynamics among those types of firms may differ. We show that average entry and exit rates mask much variation among different types of broadband service; entry is much more prominent in some broadband types than others. In particular, in the local markets there is five times as much entry in the DSL than in the cable modem markets. There is also great variation in exit rates. Thus, analyses that lump together all broadband types in a market, as most of the previous work cited above had to do, may miss much interesting variation and strategic interaction via intermodal competition.
The final question of turnover of firms in the marketplace impinges directly on previous work done in this area. Only one paper of which we are aware has attempted directly to address dynamics in the broadband marketplace. Xiao and Orazem (2011) extend Bresnahan and Reiss’s (1991, 1994) model of local oligopoly to allow firms to enter and exit the ZIP code-level markets. Their work makes creative use of the publicly available data from the FCC, which (at the time) consists only of counts of firms offering service in the ZIP code, undifferentiated by type. The data do not reveal the identities of market participants, and so true longitudinal data on the firms in the local markets is unavailable. They find that once the market has one to three firms, the fourth and succeeding entrants have little effect on competitive conduct, which they infer from their findings regarding the role of sunk costs in determining entry conditions. A key assumption, which the authors are forced to hold out of necessity given the available data, is that there is no simultaneous entry and exit. In other words, when net entry is zero in a market/period, it is assumed that there is no churn. Our investigation here shows this assumption is untenable. In fact, using the same FCC data (but for our later time period,
2008), we find that in ZIP codes with no net entry in a period, a full 41.2% of the time there was simultaneous entry and exit (i.e. within the prior six months). 3
In the next section, we describe the FCC data and our measures of entry and exit. In section III, we present results for entry and exit rates, in the form of averages, variation across types of broadband, autocorrelation, and correlation with each other. A concluding section gathers the results into a set of stylized facts for the industry.
II.
Measuring the Entry and Exit Broadband Providers
A.
Data Construction
1.
Broadband provider data
The FCC has collected data from providers of end-user broadband service since 1999. Broadband providers complete the semi-annual Form 477, which until 2009 required them to list each five-digit ZIP code in which they provide service.4 The firms provide separate ZIP code lists for each type of broadband service offered. During the period June 2005 to June 2008, the years we study here,5 the broadband types were categorized as asymmetric DSL (ADSL), broadband over power line (BPL), cable modem, fiber, satellite, fixed terrestrial wireless (also known as wireless Internet service providers, WISPs), mobile terrestrial wireless, symmetric DSL (SDSL), and a residual “other” category.6 The lists do not include information on the number of subscribers served within the ZIP code area.
Given our interest in marketplace dynamics—the entry and exit of broadband providers—we linked firms’ Form 477 filings over time.7 Thus, a major task in the project was to link firms’ filings over time, accounting for variation in company names, mergers, acquisitions, spin-offs, cable system area swaps and other asset sales and transfers, and other phenomena affecting matching. 8
3
For comparability with Xiao and Orazem (2005), we group different service types within the ZIP code for this calculation.
4 In 2009, the providers began reporting local service at the Census tract level.
5
The FCC provided the Form 477 data to the authors under a confidentiality agreement.
6 The “other” category in the FCC ZIP code lists includes traditional wireless services such as T1 (1.544
Mbit/s) and T3 (44.736 Mbit/s) dedicated lines (non-fiber high-capacity digital lines, also known as DS-1 and DS-3). For reasons of consistent data quality that we describe below, we drop the “other” category from our empirical investigation.
7 Due to some violations we found of the FCC’s rule that providers should file one form combining the
information for all service companies in a state under the same holding company, our final count of providers differs a bit from the official FCC reports.
8 Within each round, we examined the lists of firms that disappeared from many ZIP codes to determine if
After creating a common set of identification codes for the broadband providers, we set out to account for as many mergers and other forms of corporate reorganization as feasible. Within each round, we examined the lists of firms that disappeared from many (or all) ZIP codes to determine if a merger, name change, or major sales of assets explained the apparent exit. Similarly, we examined the lists of firms that newly showed up in many ZIP codes to determine if a name change or major purchase of assets explained the apparent entry. We collected information on as many mergers, etc., as we could find. Nevertheless, it is important to note that we undoubtedly missed some corporate reorganizations and (particularly) asset sales. To the extent that we missed some forms of corporate reorganization, our measures of entry and exit may be overstated.
We now explain how we treat entry and exit due to mergers and other reorganizations. Our aim was to adhere to existing practice in the academic literature on empirical studies of firm dynamics, most particularly DRS.9 First, straightforward asset sales and swaps are not treated as exit of the old owner followed by entry of the new owner, whenever we had information on the transactions. For example, as part of the Adelphia acquisition that was effective in August 2006, Comcast and Time Warner swapped system ownership in various areas. Any apparent exit of Comcast in a market followed by subsequent apparent entry of Time Warner (or vice versa) was thus not treated as actual exit or entry. We note (again) that we undoubtedly missed some asset transfers among firms, leading to overstated measures of turnover within some markets.
For mergers and acquisitions, when the two merging firms already compete in the same market, we treat the combination of the firms in the market as resulting in one continuing firm and one exit.10 (As we explain below in section B.1, we consider various definitions of market in
the study.) When the acquired firm offered service in a market in one period and the new entity appears in the market in the next period after the merger, we treat it as a continuing firm.
For reverse mergers and corporate spin-offs, when the involved parties go from one firm to two firms within a market, we treat only one of the firms as entering the market. For example, consider the case when ALLTEL spun off its wired broadband service business as Windstream in 2006. If ALLTEL was in a market before the spinoff, and both ALLTEL and
lists of firms that newly appeared in many ZIP codes to determine if a name change or major purchase of assets explained the apparent entry. We collected information on as many mergers, etc., as we could find from newspapers, the trade press, SEC filings, and Internet sources. Nevertheless, it is important to note that we likely missed some corporate reorganizations and (particularly) asset sales among smaller firms.
9
DRS, the seminal empirical study of firm entry and exit in the modern industrial organization literature,
study entry and exit in the manufacturing sector of the US economy during the years 1963-1982.
10 The decision of which firm we treat as the exiting company matters in some of the measures of exit we
consider below (namely, the measures of exiters’ market share and relative size). In the case of acquisitions, we treat the acquired firm as the exiter. For mergers, we judged which firm appeared to be the dominant partner in the merger (e.g., we treated SBC as the continuing firm and AT&T as the exiting firm in the SBC-AT&T merger, despite the fact that the new firm kept the AT&T moniker). In one case, three firms merged (Choice One Communications, CTC Communications, and Conversent Communications merged to form One Communications Corp. in July 2006), and so in markets where all three competed, two were marked as exiting.
Windstream are in the same market after, then Windstream alone is counted as an entrant. On the other hand, if ALLTEL is in a market before the spinoff but only Windstream is in the same market afterward, then Windstream is treated as a continuing firm.11
2.
ZIP code data
The second issue involved with creating a dynamic picture of the market is that the universe of ZIP codes changes over time. The US Postal Service constantly creates new codes and removes obsolete codes from use. Since ZIP code areas change over time, we use ZIP Code Tabulation Areas (ZCTAs) defined for the 2000 Census for our geographical market boundaries. We mapped the reported ZIP codes in the FCC data each year to the (stable) ZCTA’s.12 Despite our actual use of ZCTA’s, we will continue to refer to “ZIP code areas” below.
3.
Limitations of the data
There are several limitations in the data, some of which are common to all studies of entry and exit. The primary task in creating any panel dataset of market participants is the linking the firms over time, which can be difficult due to name and ownership changes. In the Form 477 data, we linked holding companies over time by name as we described above in section A. While we cannot guarantee that we properly connected all variants of the firms’ names correctly over rounds, we spent much time on this task and attempted to investigate all occurrences of possibly related names. This task was no more difficult with the Form 477 data than it would have been for any other arbitrary set of firms. However, the FCC data do not contain unique firm identifiers that are consistent over the years, as are available in typical US Census longitudinal datasets on firms and plants.
Other limitations appear to be specific to (or at least exacerbated in) the Form 477 data. A major concern is that there is a great amount of apparent one-round entry and exit. That is, there appears to be an inordinate number of firms that enter a ZIP code in one round but are missing again the next (“one-round entry”). Similarly, there are many instances of firms that exit a ZIP code in one round, only to return in the next round (“one-round exit”). In the ZIP-BB
market, 20.4% of all entry is one-round entry. Over half (52%) of these one-round entrants may have exited legitimately due to some sort of merger event, leaving about one-tenth of all entry
11
For the few unwindings of 50-50 partnerships we found (e.g., the Comcast-Insight Communications Company partnership unwinding in 2007), we treat any name change in a market (e.g., an Insight system in Illinois changing to a Comcast system after the unwinding) as exit followed by entry, under the assumption that the holding company that filed the area in its Form 477 probably had the upper hand in its management under the partnership.
12 We mapped ZIP’s to ZCTA’s with the crosswalk files provided by The U.S. Department of Health &
Human Resources (see Goodman (2005) for methodology). By far the most common substantive change in USPS ZIP code areas is splitting a ZIP code into two areas, one of which will be designated with a new number. In such cases both new areas are mapped back into the original ZCTA and combined in our methodology.
as unexplained one-round entry. A similar amount of all exit is one-round exit. Taken at face value, these figures indicate a remarkably dynamic and contestable market,13 with firms perhaps hopping in and out of the various local markets to take advantage of transient profit opportunities (what is sometimes called “hit-and-run entry” in the market contestability literature).14
Upon closer examination, however, it seems nearly certain that the amount of entry and exit is exaggerated in these data. Consider the various reasons for one-round exit, for instance:
1. The firm did not offer the particular broadband type in the ZIP code that round, because the firm stopped offering the service in the ZIP code temporarily.
2. The firm continued to offer service that round, but had no customers. This situation is most likely to occur when only a small part of a ZIP code is covered in the service footprint of the broadband provider.
3. The firm mistyped a ZIP code in Form 477 that round. Not only does this create one-round exit, it may also create (erroneous) one-one-round entry in the ZIP code that was erroneously entered (if the firm did not already offer service there).15 We found
instances of obviously mistyped ZIP codes (e.g., those smaller than 00500 and those where the ZIP code does not match the state to which the firm’s Form 477 purportedly pertains. We dropped the former but could not check for all the latter (and it appears that the FCC IATD may not have corrected for the latter, either).16
4. The firm did not file Form 477 at all that round, even though it should have. This appears to have happened with some smaller firms, although we cannot be sure the firm did not have a legitimate reason for not filing.
5. The firm filed Form 477 that round, but we treated it as a different firm than in the rounds before and after because of an error linking the firms’ name variants over time. Given our extensive checking of the names, we expect errors of this type to be rare. Furthermore, if such errors exist, they will pertain to relatively small providers only, because we verified all instances of significant entry or exit (i.e., entry or exit occurring by the same firm in many markets).
13
In a contestable market, the threat of hit-and-run entry leads to outcomes sharing certain properties (such as zero long-run profit) with competitive markets, even though industry structure is non-competitive (for example, there is only a single firm actually supplying the market). See W. Baumol, J. Panzar, and R. Willig (1982).
14 See sections 10.3 and 10.4 of Train (1991).
15 Consequently, positive correlation would be induced between one-round entry and exit within a round.
The correlation in the sample between these two measures is indeed positive (around 0.3), but is not statistically significant due to the small number of round from which the correlation is calculated.
16 We checked a few ZIP codes with obviously mistyped numbers and looked at how the raw data
compare to the final (publicly available) count of providers in the ZIP code. Take the hypothetical example of ZIP code 97222 showing up in a Form 477 ostensibly for Virginia. It appears that the official FCC count
of broadband providers includes such entries in the count for 97222 (which also means that the Virginia
It is clear that only case 1 meets the definition of “exit” as the term is normally used in the industrial organization literature. It is interesting to note that one-round entrants and exiters appear to be very small. Whereas the average entrant or exiter in the ZIP-BB market is much larger than incumbents and remaining firms (as we describe in section below), one-round entrants are only one-quarter the size of incumbents on average, and one-round exiters are 12% smaller than surviving firms.17
A second idiosyncratic feature of our data has to do with the “other” broadband category. We drop the “other” category from the dataset for the analysis, due to apparently incomplete data in some rounds. In the rounds analyzed, there are about 250 firms offering broadband service of type “other” in rounds 12-13 and 17-18, but only about 75 in the intervening rounds 14-16.18 Clearly, this is an artifact of the data at our disposal, but we were not able to discern what caused the apparent error in the counts. Because of the inconsistency in the count of providers of “other” broadband, and also because the category may be the least interesting of itself (unless one’s interest is in the business market for T1 lines), we deleted all appearances of this category within each ZIP code.19
B.
Entry and Exit Measures
We analyze several measures of entry and exit in the market for broadband provision. To allow comparison and to follow best practice in the academic literature on market dynamics, we define our measures as in DRS. We analyze gross entry and exit (i.e., counts of entering and exiting firms separately) rather than net entry (i.e., the net change in the number of firms in a market, where net exit is counted as negative net entry). The economic literature on market dynamics (such as DRS) points out that gross measures are appropriate to examine industry dynamics, since gross entry and exit may be high even when net entry is low.20
17
We cannot infer whether the apparent entry and exit is spurious directly from the fact that the suspicious one-round entrants and exiters are small. Small firms may potentially be more prone to make mistakes in filling out the ZIP code lists, but (since they have fewer customers) they are also more likely to be susceptible to case 2.
18 In particular, our count of unique holding companies offering service of type “other” is: June 2005
(round 12)—238; Dec. 2005 (round 13)—243; June 2006 (round 14)—74; Dec. 2006 (round 15)—77; June 2007 (round 16)—73; Dec. 2007 (round 17)—241; June 2008 (round 18)—246.
19
If the “other” category is left in the data, then (as one would expect) the exit rates are spuriously skewed upward in round 14 and the entry rates are spuriously skewed upward in round 17.
20
It is worth noting that with the publicly available Form 477 data, in which company identities are not revealed, only net entry can be studied (as in Xiao and Orazem (2005). Even then, not all net entry is observable, given that the FCC censors the publicly available data when one to three providers are in the ZIP code.
1.
Market definition
To begin with, the market must be defined, since entry and exit must be quantified with reference to a precisely defined market. From the household’s perspective, the market consists of all broadband providers able to serve the household’s location. Thus, the geographic extent of the market in this perspective is no larger than the walls of the house. The same is true for business subscribers. Using the logic of the familiar SSNIP test from antitrust law and economics,21 for example, one can see that the prices offered to households adjacent to our original “market of one” household are irrelevant in the original household’s demand decision. Thus, starting with a market of one household, the SSNIP test never increases the size of the market. That is, the household can never “go next door” to buy broadband service at a better price.22 In the product space, however, different modes of broadband provision are substitutable to some degree. Thus, it may make sense to put cable modem service in same market as DSL, even though they are not perfectly substitutable, as argued by Cardona et al.
(2009). It may make less sense to put mobile wireless broadband in the same market as DSL, given that DSL service does not “travel” with the user. 23 Nonetheless, in some parts of the
world DSL and mobile broadband have been found to be close substitutes (Vogelsang, 2010; Srinuan, Srinuan, and Bohlin, 2012). In other areas fixed and mobile broadband may be complements, at least in the nascence of mobile broadband service (Lee, Marcu, and Lee, 2011). Some economists argue that the mechanical application of traditional antitrust definitions such as SSNIP to technologically dynamic settings results in markets that are inappropriately small (Pleatsikas and Teece, 2001).24 In the geographical dimension of the market, we do not have household-level data to work with anyway. It also may be inappropriate to think of market definition in purely antitrust terms. On the supply side, a broadband provider clearly does not enter a market household by household, due to the economies of scale that make it economic to begin offering service with a footprint covering many households or businesses. At the small end of the geographical entry decision may be fiber, where entry into the broadband market may mean deploying the optical carrier
21 “A Small but Significant and Non-transitory Increase in Price (SSNIP) test asks whether a hypothetical
monopolist could profitably impose a small increase in price. If sufficient numbers of buyers would switch to alternative products or to suppliers at other locations such that the price increase is unprofitable, then the market definition must be expanded to include at least some of those substitute products or locations” (Connolly and Prieger, 2009).
22 We recognize this statement is subject to falsification by reductio ad absurdum. Clearly if the price of
broadband service were $1000 in Household A and $10 in neighboring Household B, there would be ways for the households to mutually benefit from “trade,” (for example, through Household A piggybacking off the wireless home network of Household B).
23 For a discussion of how traditional market definition may proceed for the broadband industry, see U.S.
Department of Justice, Ex Parte Comments in the Matter of Economic Issues in Broadband Competition: A
National Broadband Plan for Our Future (GN Docket No. 09-51), section III.A, available at
http://www.justice.gov/atr/public/comments/253393.htm (accessed November 19, 2010).
infrastructure to serve a small group of office buildings in a dense urban center. At the other end of the geographic spectrum are the satellite firms, who upon enter can serve any location in the US with a clear view of the southern sky. The relevant geographic markets on the supply side for DSL, cable modem service, and wireless services fall between these extremes.
In the end, our choice of market definition is driven by what is available in the Form 477 data. In this initial work, we present results for three markets that are feasible to define with the data at hand. The largest market we examine, the US market, is the entire US (the 50 states plus Washington, DC)25 and includes all forms of broadband without differentiation. The smallest market we investigate has the geographic extent of a ZIP code area and is restricted to a single type of broadband in product space. We call this market ZIP-BB, since markets are distinguished by ZIP code and type of broadband. Widening the geographic extent of the market to the nation but still differentiating among broadband types gives us the US-BB market. While there is only one market per round with the US definition, there are eight markets per round with the US-BB definition (one each for ADSL, BPL, cable modem, fiber, satellite, fixed terrestrial wireless, mobile terrestrial wireless, and SDSL). The ZIP-BB definition leads to 253,648 markets per round (31,706 ZCTA areas times eight service types).
2.
Measures of entry
We use the following notation to measure the amount and scale of entry:26
NTi(t) = total number of firms; the count of broadband providers present in market i (however defined) in period t. All firms under the same holding company count as a single firm.
NEi(t) = number of entrants; the count of broadband providers that enter market i in period t. In particular, the count of providers present in the Form 477 data in period t that were not present in the Form 477 data from period t-1.
QTik(t) = quantity produced by a firm; the number of broadband lines that provider k (one of those present in market i) serves in period t. For market ZIP-BB, only lines of the same type of broadband service are counted. For the ZIP level markets, the line counts are those for the state level and thus are only a proxy for ZIP level quantities.
25 Although the FCC data includes Puerto Rico, we exclude those observations from our study.
QTi(t) = total quantity produced; the sum of the number of lines served in period t by each of the broadband providers present in market i in period t: QTi(t) =
kQTik(t).
QEik(t) = quantity produced of an entrant; the number of lines broadband provider k (one of the entrants in market i) serves in period t; constructed as for
QTik(t).
QEi(t) = total quantity produced by entrants; the sum of the number of lines served in period t by each of the broadband entrants present in market i in period
t: QEi(t) = kQEik(t).
Using these definitions, the entry rate ER in market i in period t is:
ERi(t) = NEi(t)/NTi(t-1)
Following the convention of DRS and other authors, the denominator is the number of firms present in the previous period. In the absence of exit, ERi(t) is thus the percentage increase in the number of firms between periods t and t-1. Note that the entry rate is undefined for previously “empty” markets, for which NTi(t-1) = 0. This is problematic for new markets, where NEi(t) > 0 and NTi(t-1) = 0.For the ZIP-BB market definition, which (we will see) includes many instances of new markets, we may instead be interested in the alternative entry rate ERalt, defined as ) ( / ) ( ) (t NE t NT t ERialt i i
which is the fraction of firms present in period t that are entrants. Unlike ERi(t), )
(t
ERialt is defined for new markets.
27
To examine how the size of entrants compares with that of existing providers in the market, we define ESH, the entrants’ share of the ZIP codes served by all the firms active in market i as
ESHi(t) = QEi(t)/QTi(t)
The interpretation for the national level markets is straightforward. However, care must be taken in interpreting ESHi(t) for the geographically delineated markets, for in such cases ESH
is not the market share of output in market i that is produced by entrants. Market share within the ZIP code is known since providers were not required to report lines by ZIP code (i.e., we have no measure of broadband subscribership at the ZIP code level). Instead, for the ZIP markets ESHi(t) is the number of lines across the state served by the entrants in market i, expressed as the ratio to the sum of the number of lines in the state served by all firms in market i.28 Thus for the ZIP markets ESH measures the proportion of the state-level scale of firms in market i (which may not offer service everywhere in the state) due to entrants.
We define the average size of entering firms (measured as the state-level scale of their operations, in the case of the ZIP markets) relative to that of incumbents, ERS, as
)] ( ) ( [ )] ( ) ( [ ) ( ) ( ) ( t NE t NT t QE t QT t NE t QE t ERS i i i i i i i
ERS allows us to compare the relative scale of entrants to incumbents at a point in time. In the denominator, the measures appropriate to the incumbents are calculated by removing the entrants’ measures from the totals. ERS is undefined when there is no entry.
3.
Measures of exit
Similarly, we measure exit using the following:
NXi(t) = number of exiting firms (“exiters”); count of the broadband providers that exit market i between periods t-1 and t. In particular, NXi(t) is the count of providers present in the Form 477 data in period t-1 that were no longer present in the Form 477 data from period t.
QXik(t) = quantity produced by an exiter; the number of lines broadband served in period t-1 by broadband provider k (one of the providers exiting market i
between periods t-1 and t); constructed as for QTik(t).
QXi(t) = the total quantity produced by exiters; the sum of the number of lines served in period t-1 by each of the broadband firms exiting market i
between periods t-1 and t: QXi(t) = kQXik(t).
Note the convention for the timing: an “exiter” in period t exited the market between periods t-1 and t, and the quantities associated with the exiters pertain to the last period in which they provided service. Using these definitions, the exit rate XR in market i in period t is:
XRi(t) = NXi(t)/NTi(t-1)
In the absence of entry, XRi(t) is thus the percentage decrease in the number of firms between periods t and t-1. Note that the exit rate is undefined for empty markets (those for which NTi(t-1) = 0).
To examine how the size of exiting firms compares with that of existing providers in the market, we define the exiters’ share (XSH) of the ZIP codes served by all the firms active in market i as
XSHi(t) = QXi(t)/QTi(t-1)
Similar to ESH, for the ZIP level markets XSHi(t) is the number of lines in the state served by the firms that exited market i just prior to period t, expressed as the ratio to the state-aggregated line count for all firms in market i are present (also in period t-1).29 Thus, for the ZIP markets XSH measures the proportion of the state-level scale of firms in market i due to exiters. Finally, the average size of exiting firms (measured as the state-level scale of their operations, in the case of the ZIP markets) relative to that of incumbents, XRS, is:
)] ( ) 1 ( [ )] ( ) 1 ( [ ) ( ) ( ) ( t NX t NT t QX t QT t NX t QX t XRS i i i i i i i
XRS allows us to compare the scale of exiting firms relative to incumbents at a point in time. In the denominator, the measures appropriate to the incumbents are calculated by removing the exiters’ measures from the totals. XRS is undefined when there is no exit.
4.
Sources of entry and exit
We also investigate from where entry arises in the ZIP-BB market. A de novo entrant in period t is a firm appearing somewhere in the Form 477 data in period t but nowhere in the data in period t-1. Such entry is also called “greenfield” entry in the literature). De novo entrants are new firms (labeled NF in the following) that did not previously offer any type of broadband in the US.30 We assume that the new firm uses new infrastructure to provide service, which will be the case to the extent that we have properly accounted for asset sales.
Entry can also occur through geographic expansion: the first appearance of the firm in the ZIP code with any broadband type. In this case, the geographically expanding (GE) firm previously offered service in other ZIP codes. Although new ZIP codes may be served by existing
29
Since the latter includes the former, ESH is bounded between 0 and 1, inclusive.
30 At least, they were not in the market in the previous period. They may have served the market in
telecommunications infrastructure in some cases, typically GE entry requires new plant. Finally, a firm can enter through diversifying its product mix (labeled DF, for “diversifying firm”). For example, a firm offering ADSL in period 15 in the ZIP area who expands its service offerings to include SDSL in period 16 is counted as an entrant of type DF in the period 16 SDSL market in the same ZIP area.
The nomenclature for exit is similar. Exit of type EF (for “exiting firm”) means the disappearance of the firm from all markets. Exit of type GC (for “geographic contraction”) is the disappearance of the firm from the ZIP code, while continuing to serve customers elsewhere.
CF exit, for “consolidating firm,” means the firm stops offering one type of broadband while continuing to offer other modes in the geographic market. In other words, exit of type CF
means the consolidating firm is reducing its product mix.
5.
Adjustment to exclude single-round entry and exit
One concern with taking the measures of entry and exit proposed above to the data is that there is a great amount of apparent one-round entry and exit in the ZIP market. This feature of the data was discussed above in section II.A.3. Using the ZIP-BB market, 20.3% of all entry is one-round entry. About half (48%) of these one-round entrants may have legitimately exited due to some sort of merger event, leaving at least one-tenth of all entry as unexplained one-round entry. There is similarly a nontrivial amount of one-round exit.
To avoid overstating the amount of entry and exit in the raw data, we also calculate statistics for entry and exit excluding the one-rounders. In the tables and discussion to follow, when one-round entry and exit remains in the data we call the statistic at issue “unadjusted.” When one-round entry and exit has been removed before calculating the statistic, we call the result “adjusted.” To the extent that an unknown amount of one-round entry and exit is spurious, the adjusted and unadjusted figures will bracket the true level.
III.
Basic Analysis of Entry and Exit
We now turn to the analysis of entry and exit in the market for broadband service provision. Throughout this section we will compare our results with those of DRS and other studies of entry and exit (Koski and Sierimo, 2003; Bartelsman, Scarpetta and Schivardi, 2005; Lotti, 2007).
We begin by examining the average levels of entry and exit in the broadband market, breaking each down into specific modes of entry and exit. In subsection B, we consider how entry and exit rates are distributed within markets, to give a sense of how the industry dynamics vary both within and across markets. In subsection C, we look at how the entry and exit rates are correlated with themselves and with each other, which sheds additional light on the dynamics of the broadband market.
A.
Entry and Exit Rates
a)
Average entry and exit statistics
We begin our description of entry and exit in the broadband market by measuring the average levels. Unlike DRS, who drop the smallest firms from their analysis, we include all firms in our calculations.31
For the national broadband market including all types of broadband (the US market), the entry and exit rates measure the turnover in firms that show up at least once in the Form 477 data. The figures are given in Table 1. The first fact that is apparent is the great amount of entry and exit that occurs. The semi-annual entry rate varies from 5.6% (June 2008) to 15.2% (December 2005), and has an annualized average rate of 19.2%. Even the adjusted rates (Table 2) are high, varying from 4.6% to 11.6%, yielding a 13.6% annualized average entry rate. Entry is thus higher than many yearly entry rates found in the literature, for example a 9.8% entry rate for manufacturing firms from DRS 32 or 7-10% for the Italian services industry (Lotti, 2007). The broadband figures are closer to entry rates found for ICT firms, for example a 14.5% entry rate for Finnish ICT firms (Koski and Sierimo, 2003; one of the very few studies looking specifically at the ICT sector). Koski and Sierimo (2003) also find that ICT industries have higher entry rates than other industries, although not to the degree found here and they did not focus on Internet service providers. The high-end adjusted broadband entry rate (from December 2005, annualized to 23%) is more than twice the rate from DRS. Thus, as is to be expected in a rapidly growing industry,33 entry is relatively high. There is an overall slowing in the entry rate over the years, but the period-to-period variation is high and the reduction in the entry rate is not smoothly decreasing. While the variation in the entry rate may point to some underlying incompleteness in the data,34 it may also merely reflect the volatile nature of the market.
Entrants are small in the national market, compared both to the entire market and to incumbents. The entrants’ share of the market (ESH, also shown in Table 1 and Table 2; refer to section II.B.2 for its definition) is only 0.1-0.3% across most of the periods. This is much smaller
31DRS drop small manufacturing firms since the geographic extent of their market definition is the entire
US and small firms are not very important in that context. The nature of broadband service provision, however, means that even small firms may be very important to subscribers within the area they serve. Subscribers cannot go to larger firms offering service in other areas, and the relevant options for the household or business include all market participants, no matter how small. Furthermore, excluding smaller firms would exclude virtually all rural telecommunication carriers, which are important providers of broadband in many rural areas.
32
The simple average of the manufacturing entry rates reported over 1963-1982 in DRS (for firms of all
sizes) is 9.8%.
33 See Siegfried and Evans (1994), p. 127.
34
One unanswered question is why is the entry rate is always higher in the December filings. One possibility is that some firms did not actually update their mid-year data as they were supposed to, but instead submitted the same ZIP code list as for the previous December filing. If that were so, however, then the exit rates should always be substantially higher in the June periods, which is not the case.
than DRS’ figures for manufacturing, but at least some of the difference is accounted for by their five-year periods, which gives entrants more time to grow their market share. Entrants are also seen to be small by considering their relative size (ERS), which is always well below one (ERS
equal to one would imply that the entrants are just as large as incumbents). In fact, ERS is typically in the range 1.2-3.0%, which implies that incumbents as a group are 33-83 times larger than entrants are in a typical round. DRS also find that entrants are smaller in terms of market share and relative size to incumbents, although not to this degree.
The exit rate (XR) also generally trends downward, from the highest unadjusted rate of 11.1% (June 2006) to the lowest rate of 5.4% at the end of the sample (see Table 1). The average unadjusted exit rate is 16.5% per annum. This is about twice as high as the yearly exit rate for manufacturing firms from DRS, about three times as high as for the services industry (Lotti, 2007), and 1.8 times as high as for ICT firms (Koski and Sierimo, 2003). Even the adjusted annualized average exit rate of 11% (Table 2) is higher than in these other industries. The turnover rates (the sum of the entry and exit rates) of about 35% (unadjusted) and 25% (adjusted) are both higher than the turnover rates found by Bartelsman, Scarpetta, and Schivardi (2005) in 10 OECD countries for the manufacturing, business, and business services sectors.
Comparison with the entry rate reveals two interesting facts. First, the exit rate is lower on average than the entry rate, which reflects that the number of firms in the market is growing during 2005 to 2008. More interesting, however, is how much of the dynamism of the market one would miss if only net entry were examined. Net entry in the US market is about 3.1% per year during this period.35 The gross entry and exit rates, which are in the range 11-30% per year
(unadjusted) or 8-23% per year (adjusted), contrast markedly with the slower net growth rate. Any entry analysis conducted on the publicly available FCC data, which provides only the count of firms operating each period, would miss much of the action.36
As with the entrants, exiting broadband providers are also smaller than other firms in general. However, they are usually larger than entrants, which is in accord with the findings of
DRS. The share of the exiting firms (XSH) is less than one-ninth in all periods, and averages 1.6% in the adjusted data. Exiting providers are also small relative to surviving firms (XRS), which is always less than one except for December 2006, which has an outlier of 157%. The December 2006 figure is abnormally high because of the Verizon acquisition of MCI; the latter was much larger than the typical exiting firm. Except for December 2006, XRS is in the range of 3-8%, which implies that surviving firms as a group are 13 to 36 times as large as exiting firms in typical periods.
Changing our focus to the US-BB market, in which each broadband type is treated as a distinct market, we see from Table 3 (unadjusted data) and Table 4 (adjusted) that the entry and exit rates are even higher than they are in the US market. Table 3 and Table 4 report the simple
35
By our count, there were 1,226 distinct holding companies offering some sort of broadband service in June 2005, and 1,344 in June 2008 (for a continuous growth rate of 3.1% per year).
average of the figures for each broadband type for a round. When markets are delineated by broadband type a more dynamic picture of the market emerges than is shown by the US market. The unadjusted entry rate averages an annualized 32.4%, with 23.6% for the adjusted rate, and both decline over time as the market matures. The entry rates are more than two to three times the entry rate of manufacturing firms found by DRS.37 The exit rates of 23.2% (unadjusted) and 14.5% (adjusted) are also higher than the exit rates for the US market or for manufacturing firms from DRS.
In the ZIP market, we must confront a difficulty in our data. With such a narrow definition of the market, there are some markets in which no broadband is offered. Since the count of service providers in the market appears in the denominator of the entry rate (see section II.B.2 for the definition of ER), the entry rate for the first entrant is infinite. Following
DRS, any of our statistics that are undefined are not included in the averages appearing in the tables. Accordingly, we include a second measure of entry in Table 7, ERalt, which gives the fraction of firms in the market in the present round that are new entrants. This measure has the advantage of being defined in the case of the first entrant (but see section II.B.2 for its different interpretation).38
In the ZIP market (Table 5 and Table 6), the narrower market definition (which is closer to the set of services available at a single household or business location) leads to a more dynamic picture of entry and exit. At annualized average rates of 37% (adjusted) to 49 % (unadjusted), there is far more entry than in the US, US-BB, or manufacturing markets. Similar patterns are discerned as found above: declining entry and exit rates as time passes, and more entry than exit. The ZIP entry rates tend to be higher than the national-scope figures because the denominators are so much smaller—there were typically only a few providers in each ZIP code at the time. The exit rates are lower than in the US-BB market. Coupled with the higher entry rates, this implies that the net geographic expansion of broadband during the period proceeded at a faster pace than the growth of the national (US and US-BB) markets.
Comparison of the ZIP marketentry rates with other studies is difficult, because most studies use national-level markets and aggregate entry across local establishments to the firm level. However, with some recalculations we can compare our data with entry rates of establishments in the US for the same years calculated from the US Census Bureau’s Business Dynamics Statistics (BDS). Counts of establishments reflect the local presence of firms, which may have numerous establishments. In this sense, each appearance of a service provider in a ZIP code is roughly analogous to an establishment. Treating appearance in the ZIP code as an establishment, the broadband establishment entry rate in the US averages 18.3% (unadjusted) to 13.6% (adjusted). This range is higher than the BDS entry rates for establishments in the
37DRS delineate product markets at the four-digit SIC level, which is an intermediate level of aggregation
between the US and US-BB markets. Mobile and wireline communications services have different
four-digit SIC codes, but all types of wired communications have the same code.
38 Of course, ERalt is still undefined when there are no firms in the market (for then its formula calls for
manufacturing (7.5%), services (12.2%), and transportation, communications, and utilities (13.2%) sectors. The only sector in the BDS data approaching the level of entry we find for broadband is finance, insurance, and real estate, with a 13.2% entry rate.
We now turn to the smallest market definition, the ZIP-BB market, which draws narrower boundaries around the market in both geographic and product space. Each broadband type within a ZIP code area is treated as a distinct market. With this narrowest definition of the market, ER is undefined for half of the markets due to the problem discussed above. Naturally enough, ER is undefined most often for the least-common broadband types: BPL and fixed wireless.39 For the ZIP-BB market, the alternative entry measure ERalt may therefore be of particular interest, and it is reported in Table 7 and Table 8.
For the ZIP-BB market, we see from Table 7 and Table 8 that the entry and exit rates are quite a bit higher than in the US market. The narrower market definition, which is closer to the set of services available at a single household or business location, leads to a more dynamic picture of entry and exit. The semi-annual entry rate (whether measured by ER or ERalt) generally declines over time, similar to the US market. The entry rate ER is highest in June 2006 (21.4% unadjusted, 19.7% adjusted) and lowest in December 2007 (13.2% unadjusted, 7% adjusted), and averages an annualized rate of 34.2% unadjusted (25.7% adjusted). ERalt ranges from 12.6% to 24.9% unadjusted (averaging 36.9% per annum), meaning that between one in seven to one out of every four firms in a typical market is an entrant.
The market share of entrants in the ZIP-BB market is about the same as the semi-annual entry rates, implying that the scale of entry in the market is similar whether measured by counting firms or their market share. ESH ranges from 5.2% to 17.1%, and averages 12.0% in the adjusted data. However, the average relative size of entrants is much larger than that of incumbents: ERS averages 29, which is much higher than DRS found for manufacturing firms. The distribution of relative sizes of entrants is highly skewed, however, due to the entry of large firms like Verizon and AT&T into new ZIP codes. The median ERS, which is affected little by the few huge entrants, ranges from 0.09 to 1.4.
The trend in the exit rate (XR) is generally downward. The highest exit rate of 16.8% (unadjusted, or 14.3% adjusted) is at the beginning and the lowest rate of 5.0% (unadjusted, or 3.9% adjusted) is at the end of the sample. The average annualized exit rate is 12% if adjusted, 23% if not. Exiting broadband providers are larger than non-exiting firms on average, as shown by the figures for XRS in Table 7 and Table 8, although as with the entrant relative size the median XRS is usually below one. Thus the typical exiting firm is relatively small, as may be expected. Excluding December 2007, surviving firms in the median markets are anywhere from 2 to 19 times the size of exiting firms.
39
ER is undefined for BPL in 99.9% of ZIP rounds, and is undefined for TFW in 79% of ZIP code-rounds. Other modes of service with a large number of ZIP codes-rounds with undefined ER are fiber
(63%) and SDSL (61%). At the other end of the spectrum, ER is undefined for satellite service in only 13%
b)
Disaggregating the sources of entry
Entry is broken down by source in Table 9 and Table 10 for the US-BB market, Table 11 and Table 12 for the ZIP market, Table 13 and Table 14 for the ZIP-BB market (refer to section II.B.4 for the definitions of entry types). In the US-BB market, more entry comes from new firms than from providers offering a new service type. In this section, only results for the adjusted data (Table 10, Table 12, and Table 14) are discussed for the sake of brevity. About 59% of the total entry rate comes from de novo entry, which is about the same as DRS found for manufacturing firms. The de novo entrants have about the same market share and relative size as do the diversifying firms.
Most entry in the ZIP and ZIP-BB markets is from geographic expansion. In the ZIP
market, 92% of entry is of type GE, and the rest is de novo. For the ZIP-BB market, 74% of entry is of type GE, 20% is of type DF, and the remaining entry is de novo. So, from the consumer’s point of view, most entry in these markets takes the form of an existing provider beginning to offer service in the area. The same is true when measuring entrants by their market share.
In the ZIP and ZIP-BB markets, the relative size of entrant to incumbent (ERS) is much larger for geographically expanding than for completely new firms. In the ZIP-BB market, diversifying firms have the largest relative size of all. For that market, on average, geographically expanding firms are 26 times as large as incumbents, product diversifiers are 42 times as large, and completely new entrants are 3 times as large. The average entry rates are highly skewed by firms with large service footprints and many existing customers expanding into an area previously served only by smaller providers. The median figures for ERS in Table 12 and Table 14 are all below 1 except for diversifying entrants in the ZIP-BB market, which are about the same size as existing firms in the overall average. The median ERS of type NF averages 0.02 in the ZIP-BB market, indicating that a typical de novo entrant faces incumbents that are about 40 times larger than the entrant.
c)
Disaggregating the sources of exit
By categorizing the modes of exit, we are able to examine where firms go or remain when they exit a market. The disaggregation of the exit rates is in Table 15 and Table 16Table 10 for the US-BB market, Table 17 and Table 18 for the ZIP market, Table 19 and Table 20 for the
ZIP-BB market. Again, we focus on the adjusted statistics. In the US-BB market, a firm can exit by completely disappearing (exit type EF) or by reducing its product mix (type CF). The exit rates show that two-thirds of exit coincides with the withdrawal of the firm from all modes of provision. Coupled with the results for the entry rates, we find that diversification into and consolidation out of other service types together account for the minor part of the dynamics in the US-BB market.
In addition to exit type EF, in the ZIP market a firm can also exit by contraction in the geographic dimension (exit type GC). The lion’s share of exit is of the latter type. The figures for the exit rates for the ZIP market in Table 18 show that just as most entry stems from geographic expansion, most exit reflects geographic contraction. The importance of geographic consolidation in exit is even larger in terms of market share. The relative size of consolidating
firms is also greater than the relative size of completely disappearing firms, whether looking at mean or median XRS. This finding seems to imply that larger firms are engaged in more dynamic geographic behavior overall than are smaller firms. The small incumbent ILEC offering service in a few rural ZIP codes may never exit, but neither may it expand to other areas. In summary, most entry and exit in the ZIP market comes from geographic movement, and much expansion and consolidation comes from larger firms.
In the ZIP-BB market a firm can exit by all three routes. As in the ZIP market, most exit in the ZIP-BB market reflects geographic contraction. On average, 55% of exiting firms are of type GC, 26% are of type CF, and the remaining 19% completely exit all markets (Table 20). Measuring exit by market shares instead does not change the relative importance of the three modes of exit.
The relative size of consolidating firms, whether by geography or product mix, average or median, is generally greater than the relative size of completely disappearing firms. This appears to indicate that firms shrink (or never grew) before they die. From the statistics for XRS
in Table 20, the disappearing firms are on average 2.5 times larger than remaining firms, whereas by the median completely exiting firms are only 16% as large as are firms continuing in the market. Geographic consolidators are 28 times larger on average than firms remaining in the market, but only 15% as large when looking at the median (the one statistic that is about the same as for EF exit). Product mix reducers are 15 times larger than remaining firms on average, but only 60% as large by median. The comparisons of mean to median again reflect that a few large firms are engaged in more dynamic behavior overall than are smaller firms.
B.
Variation in Entry and Exit across Broadband Types
1.
Variation across types of service
The average statistics in the previous section mask a great amount of variation in the entry and exit rates among different types of broadband service. In this section, we distinguish between modes of provision to examine how the measures of entry and exit vary across time and (for the ZIP-BB market) geography. By doing so, we can compare both the mean and variance of entry and exit across types of broadband.
Table 21 (unadjusted data) and Table 22 (adjusted) present the average, median, and first-to-ninth decile spread in the entry rates for the US-BB andFigures for the ZIP-BB markets are in Table 23 (unadjusted data) and Table 24 (adjusted). In the US-BB market, variation occurs only across periods. Looking at the statistics for the mean entry rates in Table 21 and Table 22, it appears that some types of broadband experienced much more entry than others. At one extreme, there was no entry at all in the satellite broadband market at the national level, a