REFUND TO SAVINGS 2013:
COmpREhENSIVE REpORT ON A
lARGE-SCAlE TAx-TImE SAVINGS pROGRAm
2015
CONTENTS
Illustrations ...
2
Acknowledgments and Disclaimer ...
4
Executive Summary ...
5
part One
The Refund to Savings Experiment
I. Overview ...9
II. Background ...
11
III. Research Design ...
15
IV. Participant Characteristics ...
21
part Two
Research Findings: The Experiment
V. Impact of R2S at Tax Time ...27
VI. The Impact of R2S 6 Months After Filing ...
31
part Three
Research Findings: Descriptive Results
VII. Receipt and Utilization of Tax Refunds ...37
VIII. The Financial Lives of LMI Households ...
43
IX. Coping With Lack of Savings ...
47
X. Behavioral Insights ...
49
XI. Conclusion ...51
References ...53
Authors ...58
Suggested Citation ...58
Contact Us ...58
REFUND TO SAVINGS 2013:
COmpREhENSIVE REpORT ON A
lARGE-SCAlE TAx-TImE SAVING pROGRAm
By Michal Grinstein-Weiss, Dana C. Perantie, Blair D. Russell, Krista Comer, Samuel H. Taylor, Lingzi Luo, Clinton Key, & Dan ArielyIllUSTRATIONS
FIgURESFigure 1 A screenshot within TurboTax Freedom Edition showing an Emergency prompt
paired with a prepopulated savings suggestion anchored at 25% of the tax refund ...
16
Figure 2 Overview of participant recruitment and inclusion in analyses ...
20
Figure 3 Mean federal refund varies by date filing began (n = 853,674) ...
23
Figure 4 Percentages of participants who deposited any refund into savings vehicles by
test period...
27
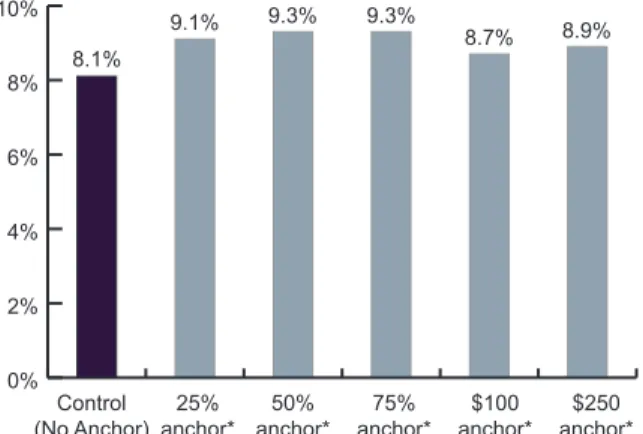
Figure 5 Probability of depositing any refund into a savings vehicle at tax time by anchor
amount, based on regression estimates (n = 468,947) ...
28
Figure 6 Probability of depositing any refund into savings vehicle at tax time by prompt
message, based on regression estimates (n = 468,985) ...
28
Figure 7 Percentages of participants who split any refunds into savings vehicles by test
period ...
28
Figure 8 Average dollar amounts of refunds deposited into savings vehicles by test
period ...
29
Figure 9 Dollar amount deposited into savings vehicle at tax time by anchor amount,
based on regression estimates (n = 468,947) ...
30
Figure 10 Dollar amount deposited into savings vehicle at tax time by prompt message,
based on regression estimates (n = 468,985) ...
30
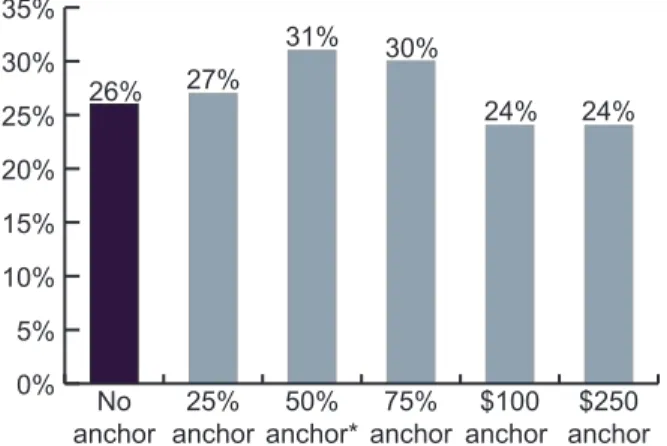
Figure 11 Probability of saving refund for 6 months by anchor amount, based on regression
estimates (n = 4,172) ...
31
Figure 12 Probability of saving for 6 months by prompt, based on regression estimates
(n = 4,172) ...
31
Figure 13 Percentage of refund saved for 6 months by anchor amount, based on regression
estimates (n = 4,833) ...
32
Figure 14 Percentage of refund saved for 6 months by prompt, based on regression
estimates (n = 4,833) ...
32
Figure 15 Percentage of survey respondents who say they could come up with $2,000 in
an emergency by anchor amount, based on regression estimates (n = 4,727) ...
32
Figure 16 Percentage of respondents who say they could come up with $2,000 in an
emergency by prompt, based on regression estimates (n = 4,727) ...
33
Figure 17 Percentages of HFS1 participants interested in receiving their tax refunds in
alternative ways (n = 17,898) ...
37
Figure 18 Percentages of HFS1 participants interested in receiving their tax refunds in
alternative ways by banked status (16,940 banked, 961 unbanked) ...
38
Figure 19 Allocation of tax refunds: Intention at tax time versus reported use 6 months
later (n = 7,772) ...
39
Figure 20 Reported use of the tax refund varies according to size of the refund (HFS2,
n = 7,655) ...
39
any refund for 6 months ...
40
Figure 22 Percentages of HFS2 participants who saved part of their refunds for 6 months by type of debt held at tax filing (n = 8,126) ...
41
Figure 23 Percentage of households experiencing financial shocks in the 6 months after filing taxes (n = 8,253) ...
47
Figure 24 Percentage of HFS1 respondents reporting use of alternative financial services (AFS) in the 12 months prior to survey by type of service (n = 19,591) ...
48
Figure 25 Prevalence of material hardship by experience of financial shock in the 6 months following tax filing (n = 8,234) ...
48
Figure 26 Money management strategies of HFS1 respondents (n = 19,129) ...
49
Figure 27 Percentage of respondents who would take $100 now rather than wait 1 year for more than $100 (HFS1, n = 18,932) ...
49
Figure 28 Respondents who would wait a year for smaller incentives tend to have more liquid assets (HFS1, n = 18,026) ...
50
TABLES Table 1 Combinations of prompts and anchors tested in the Refund to Savings experiment over three test periods ...
17
Table 2 Demographic characteristics from the experimental, tax (TTFE), and HFS data ...
21
Table 3 Participant characteristics vary by test period ...
23
Table 4 Vehicles in which filers saved their tax refunds (HFS1, n = 2,224) ...
40
Table 5 Regression models to predict saving of any of the tax refund for 6 months and the dollar amount saved (HFS2, n = 6,690) ...
40
Table 6 Reported spending of tax refunds (HFS2, n = 5,582) ...
42
Table 7 Reported holdings of HFS1 participants at tax time ...
43
Table 8 Reported debts and liabilities of HFS1 respondents at tax time (HFS1) ...
44
Table 9 Debts with the highest interest rate and the interest rate for those debts among participants in the HFS2 (n = 7,722) ...
45
ACkNOwlEDGmENTS
The Center for Social Development at Washington University in St. Louis gratefully acknowledges the funders who made the Refund to Savings initiative possible: the Ford Foundation; the Annie E. Casey Foundation; Intuit, Inc.; the Intuit Financial Freedom Foundation; the University of North Carolina at Chapel Hill; and an anonymous donor. We thank them for their support but acknowledge that the findings and conclusions presented in this report are those of the authors alone, and do not necessarily reflect the opinions of the foundations or the donors. The research team extends special thanks to Amy Brown and Frank Degiovanni with the Ford Foundation, and to Beadsie Woo with the Annie E. Casey Foundation. We appreciate their invaluable feedback, direction, and support at every stage of this process.
Refund to Savings would not exist without the commitment of Intuit, Inc., and particularly Intuit’s Consumer Tax group. We appreciate the executive sponsorship of Phillip Poirier as well as direction and insight from David Williams. We also appreciate the efforts of key contributors from the TurboTax development, marketing, and analytics teams, which have worked diligently on the planning and implementation of the experiment: Joe Lillie, Sacha Adams, Piritta Luoto, Julia Zhuang, Topher Stevenson, Annette Hoffard, and Kathy Kirkendall. We thank the Intuit Financial Freedom Foundation for providing the TurboTax Freedom Edition platform and Susan Mason for her contributions.
The Refund to Savings Advisory Committee, which includes Ray Boshara, Amy Brown, Keith Ernst, Tim Flacke, Julian Jamison, David Rothstein, Michael Sherraden, Jennifer Tescher, and Beadsie Woo, has provided outstanding advice throughout the initiative.
Lastly, we thank the thousands of tax filers who participated in the research surveys and shared their personal financial information with us. We hope this research will generate evidence that proves useful in developing policies aimed at helping low- and moderate-income households to increase their financial security and mobility.
DISClAImER
Statistical compilations disclosed in this document relate directly to the bona fide research of and public policy dis -cussions concerning the promotion of increased savings in connection with the tax compliance process. All compila-tions are anonymous and do not disclose cells containing data from fewer than 10 tax returns. IRS Reg. 301.7216
T
he Refund to Savings (R2S) initiative, a product of a unique collaboration among partners from academia and industry, seeks to improve the financial security of low- and middle-income (LMI) households by promoting saving of federal tax refunds. Researchers from Washington University in St. Louis and Duke University have worked with Intuit, Inc., the maker of TurboTax software, to design and test scalable interventions that encourage tax filers to save a portion of their federal taxrefunds and that streamline the process of depositing refunds directly to savings vehicles. These computer-based interventions are low cost and low touch; that is, only a minimal investment of personnel is required to deliver the interventions to great numbers of people.
The annual occasion of filing taxes (“tax time”) presents a unique opportunity to encourage and facilitate saving behavior at a time when people anticipate receiving lump sums—tax refunds—beyond usual income. In 2013 (tax year 2012), approximately 680,000 refund-eligible tax filers participated in the R2S experiment, which Intuit embedded in
TurboTax Freedom Edition (TTFE), the tax-preparation software that Intuit offers for free to qualified LMI households. The experiment’s randomized controlled design enables rigorous evaluation of a variety of interventions to increase the number of savers and the dollar amounts saved. This report presents results from an evaluation of R2S interventions in 2013.
Principles of behavioral economics informed the content of messages and the format of these interventions. In addition, the experiment was designed to make saving a salient default option. We tested two main behavioral mechanisms in varying combinations throughout the 2013 tax-filing season: (a) motivational prompts and (b) suggested savings amounts (anchors).
Six primary research questions are addressed by the R2S experiment:
• Can behavioral economics techniques increase the number of people who deposit to savings at tax time?
• Can R2S encourage filers to split their refund, allocating a portion to savings?
• Does R2S increase the amount of money deposited into savings at tax time?
• Do R2S interventions increase the number of people who save their refund for 6 months?
• Can R2S increase the proportion of refund saved 6 months?
• What can R2S administrative and survey data tell us about the financial lives of LMI households? Data for this evaluation come from two sources. Data on income, tax credits and deductions claimed, tax
ExECUTIVE SUmmARy
Refund to Savings 2013:
Comprehensive Report on a
large-Scale Tax-Time Saving program
By Michal Grinstein-Weiss, Dana C. Perantie, Blair D. Russell, Krista Comer, Samuel H. Taylor, Lingzi Luo, Clinton Key, & Dan Arielyrefund amount, and the participant’s chosen method for receipt of the refund (e.g., via direct deposit into a savings account) are collected by the TTFE software. This information is complemented by data from two waves of a survey administered by the researchers. Immediately after submitting their tax returns, 20,816 filers responded to an invitation to take a detailed Household Financial Survey, which thoroughly examined assets, liabilities, intended use of tax refunds,
product preferences, behavioral characteristics, and demographic traits. Six months later, 8,484 of those respondents participated in the second wave of the survey and reported on their actual use of the refunds. Data from the longitudinal survey also offer useful insights into the financial lives of LMI households. It is important to understand the context in which those households are trying to save and the methods of coping with contingencies when savings are not available. Such knowledge is key in designing effective strategies to encourage saving. Details on the balance sheets, tax credits taken, and predictors of saving behavior can inform researchers and policymakers interested in improving the financial well-being of LMI households. The data collected via the TTFE software and Household Financial Survey enable us to assess whether the R2S interventions’ effects on savings outcomes persist 6 months after filing.
Results from the R2S experiment show that minor design changes informed by behavioral economics can increase both the number of tax filers who deposit a portion of their refund into savings vehicles and the amount saved. We estimate that an additional 4,800 tax filers deposited some part of their refund into a savings vehicle because of the R2S interventions and that R2S interventions increased the amount saved by approximately 6 million dollars. Although the effects of the tested interventions are modest, the reach is broad and cumulatively substantial for such a low-touch, low-cost approach. The potential impact on individual households may be considerable.
It is noteworthy that the R2S interventions continued to affect the probability of saving and the percentage of the refund saved for at least 6 months after participants filed their taxes. In particular, we find that high anchoring (i.e., suggesting that filers save 50% or 75% of their refund) significantly increases the probability of saving and the percentage of the refund saved.
The two-wave Household Financial Survey provides valuable insights into the financial situations and challenges of LMI households. We find that nearly two thirds of households used some part of their tax refunds to pay down debt, and more than one in 10 households has already mentally allocated next year’s
refund for paying down debt. By several measures, our findings suggest that debt repayment, even more than spending, competes with the ability to save.
A close look at the balance sheets of these LMI households reveals evidence of a challenging financial environment. The median value of nonproperty assets was $1,300, and the median value of nonproperty liabilities was $10,000. If one includes property holdings as well as debt and other liabilities, the median net worth in this population was negative ($1,100). Student debt plays an important role in these households: Over half of households reported debt from education, and the median liability was $20,000. Data from the survey also reveal that the financial lives of participants were quite volatile in the months after they filed their tax returns. Two thirds of participants reported a trip to the hospital, major vehicle
repair, period of unemployment, or legal expense. These negative financial shocks are associated with economically detrimental behaviors such as the use of high-cost alternative financial services, skipping bill and rent payments, and overdrawing bank accounts. Lessons from the 2013 R2S experiment can inform policy discussions on efficient and effective
interventions to increase the financial stability and mobility of vulnerable populations. The experiment shows that behavioral economics techniques can be used in a low-touch, scalable manner to increase saving behavior at tax time, and these effects are sustained for at least 6 months.
part One
The 2013 experiment tested two main behavioral mechanisms: (a) motivational prompts and (b) suggested savings amounts (also known as anchors). These mechanisms, employed in several combinations, are intended to increase the ease and personal relevance of saving at tax time. Instead of requiring taxpayers to opt into depositing their refunds into a savings vehicle, the experiment tested the effect of making saving a salient default option. The test employed motivational messages to prompt the participant to think about a specific reason for saving (e.g., for an unforeseen emergency, family, or the future). The electronic tax form prepopulated the relevant field with a recommended specific savings amount, or anchor. Thus, saving the suggested amount was the easiest option for the user, who would have had to adjust the form and supply new values if he or she chose not to save.
In this research, we are interested in whether small changes in the presentation of the tax-filing process can increase the likelihood that the LMI population saves and the level at which it does so. We determine this by tracking use of refunds for deposits into savings accounts and for purchases of Series I U.S. Savings Bonds. We also investigate whether motivational prompts and suggested savings amounts influence the amount of the refund directed to a savings vehicle. Although testing the efficacy of R2S interventions remains the core focus in the initiative’s efforts, the collected data can be applied to address many questions of interest to policymakers. The scale of the research and the depth and quality of the data enable us to present a detailed description of the financial lives of a large cross-section of LMI households. Data from the two-wave Household Financial Survey (HFS) paint pictures of their balance sheets, hardships, and financial strategies. The data also enable us to assess
I. OVERVIEw
T
he Refund to Savings (R2S) initiative, a collaboration among partners from academia and industry, uses insights from the field of behavioral economics to test low-cost, behavioral interventions to increase savings among low- and moderate-income (LMI) households at the time of tax filing (“tax time”). Building on the theoretical foundations of research on asset building and saving, the initiative seeks to improve the financial security and mobility of LMI households, to ensure that such improvements can be replicated on a national scale, and to inform public policy. In 2013, after pilot testing and development of an experimental design, we launched the initiative’s first full-scale randomized controlled trial to examine the possible impacts of several low-touch techniques on savings behavior. The R2S experiment is built directly into the TurboTax Freedom Edition (TTFE), an online version of TurboTax tax-preparation software. As part of its participation in the Internal Revenue Service’s Free File Alliance, Intuit offers the Freedom Edition without charge to LMI households. The R2S initiative’s 2013 work involved nearly 873,026 households, with 680,545 of those households randomly assigned in the experiment. The work utilized exceptionally accurate administrative data. In addition, the R2S team followed theexperiment with a two-wave longitudinal survey that provides deep insights into the financial lives of LMI households. The team administered the first round of the survey immediately after TurboTax users filed their returns, and 20,816 respondents provided data. Of those, 8,484 returned to take the second survey 6 months after filing. The combined data from the tax-time experiment and the longitudinal survey provide a wealth of information on the participants as well as on the impact of R2S interventions at tax time and over the subsequent 6 months.
Research questions
• Can behavioral economics techniques increase the number of people who deposit to savings at tax time? • Can R2S encourage filers to split their refund, allocating a portion to savings?
• Does R2S increase the amount of money deposited into savings at tax time?
• Do R2S interventions increase the number of people who save their refund for 6 months? • Can R2S increase the proportion of refund saved 6 months?
whether the effects of the interventions persist over 6 months. They reveal perceptions concerning the burden of student-loan debt, the availability of health insurance, and trade-offs between short- and long-term financial gains. They also show how LMI households utilize tax refunds. Thus, the R2S data set could be a valuable tool in designing policy interventions to improve financial stability and mobility.
In the pages that follow, we begin by presenting a theoretical foundation for policies to promote financial security through asset building, and we specifically discuss the importance of tax time for increasing asset levels. We provide a detailed description of the R2S research design, data, and methods before presenting results from the experiment and the HFS. We conclude with a discussion of findings and consider implications for research as well as policy.
II. BACkGROUND
ASSET BUILDINg AND IMPROVINg BALANCE SHEETS Historically, public policies in the United States have been designed to improve the financial security of LMI households by offering a combination of income maintenance, consumption support, and work incentives. Although these policies help many households meet daily needs and manage finances, they have been less effective in addressing the lack of savings and in facilitating asset accumulation. Recent surveys find that over a quarter of Americans report having no emergency savings (Ross, 2014), and many are rendered financially vulnerable if unexpected or emergency spending needs arise (Chase, Gjertson, & Collins, 2011; Collins & Gjertson, 2013). A range of psychological, social, and institutional barriers prevent LMI households from setting aside funds to meet such needs. Disparities in financial literacy and education, the paucity of saving incentives, and inadequate access to financial institutions greatly limit the capacity to save (Beverly & Sherraden, 1999; Lusardi, 2008). In recent years, proponents of asset-building policies have developed approaches to complement traditional policies for promoting the financial well-being of LMI households. These new approaches attempt to enhance the ability of those households to build savings and weather hardship (Sherraden, 1991). One such approach promotes saving at tax time.
WHy TAX TIME?
Tax filing is a nearly universal experience among Americans, and several important factors make tax time especially ideal for efforts to boost saving behavior. First, the tax refund is the largest lump sum that many households receive in a given year. In 2013 (returns for tax year 2012), the average tax refund was $2,755 per household (Internal Revenue Service, 2013a). That is a sizeable one-time windfall for many and a potential source of savings for LMI households. Results from the 2012 R2S Intention Survey support this notion: On average, participants reported the intention to save 40% of their refund (Key, Grinstein-Weiss, Tucker, Holub, & Ariely, 2013). Second,
electronic filing options have altered the nature of the interaction with tax filers and enabled administration of low-touch, low-cost savings promotion interventions to millions of people. Eighty-three percent of tax returns are filed electronically, and around one third of electronically filed returns are self-prepared (Internal Revenue Service, 2013c). Third, the ability to receive tax refunds via direct deposit enhances opportunities for saving. The Internal Revenue Service
(2013c) distributed more than 79 million refunds via direct deposits into checking or savings accounts in 2013, and this number is substantially higher than the one from the previous year. Since 2006, the Internal Revenue Service has enabled filers to direct deposit refunds to multiple accounts by completing Form 8888. And since 2010, tax filers have been able to use the form to direct a portion of their refunds to purchase Series I U.S. Savings Bonds. Thus, the direct deposit mechanism and options on Form 8888 facilitate movement of refunds directly to savings vehicles. Fourth, opportunities for saving have arisen with the growth of the network of electronic filing platforms in the Internal Revenue Service’s Free File Alliance, which focuses on tax services for LMI households. These platforms present the opportunity to scale interventions so that they promote saving to millions of tax filers at relatively minimal cost. Incorporating effective savings promotions into tax-filing software may only require minor design changes, but the changes must be made thoughtfully. If these opportunities are harnessed, they have enormous potential to increase financial security among LMI households.
Recent evidence from other tax-time interventions affirms the importance of continuing to study such efforts. Tax-time interventions may facilitate interest in and utilization of savings accounts among LMI households (Beverly, Schneider, & Tufano, 2006;
Beverly, Tescher, & Romich, 2004). They also may boost take-up of U.S. savings bonds (Tufano, 2011). In a study with tax filers in New York City who qualified for free tax preparation through the Volunteer Income Tax Assistance program, the $aveNyC program encouraged participants to deposit a portion of their tax refund into a savings account. To motivate saving, tax preparers offered monetary incentives to low-income participants who deposited a portion of their refund and did not withdraw any of the deposit for 1 year (Tucker, Key, & grinstein-Weiss, 2014).1 Around 70% of participating households saved their refunds for a full year, total savings amounted to $961,518 across all participants, and 72% continued to save after the program ended (UNC Center for Community Capital, 2013). Results from SaveUSA, the national version of the $aveNyC program, also show that most participating households saved for the full year and received a savings match (Azurdia, Freedman, Hamilton, & Schultz, 2013). Two similar incentivized-matching programs fielded through H & R Block successfully encouraged low-income tax filers to save a portion of their refund by contributing to an IRA account. In the 20% and 50% matching
1Preparers offered a 50% match to eligible participants: For every dollar of the refund held over 1 year, the $aveNyC study paid a 50¢ match.
conditions, average contributions to an IRA were four and seven times greater than contributions by participants in the no-match, control condition (Duflo, Gale, Liebman, Orszag, & Saez, 2005).
These and other tax-time interventions recognize taxpayers’ tendency to view tax refunds as financial windfalls (Shapiro & Slemrod, 2003). The tendency is based partly on people’s financial status relative to peers (Epley, Mak, & Idson, 2006) and influences consumption behavior in the United States during tax season (Chambers & Spencer, 2008). There also is a tendency to spend a windfall instead of saving it, and this may be a barrier that prevents many LMI filers from accumulating savings. However, interventions may reverse the tendency toward consumption if designed to help filers overcome psychological and behavioral barriers to saving.
THE NEED FOR SAVINgS
Asset-based interventions are driven by the perspective that financial security and well-being are determined by assets as well as by income (Grinstein-Weiss et al., 2012; Oliver & Shapiro, 2006; Shapiro, 2001; Sherraden, 1991). By saving for the future and accumulating contingency savings, a household can build financial security beyond the limits imposed by income and expenses. In LMI households, assets may also function as a protective factor, improve financial well-being, and serve as a means of economic and social development (Sherraden & Sherraden, 2000). Contrasted with households that have liquid assets (e.g., assets held in savings products), households that have no or few liquid assets are 2–3 times more likely to experience material hardship as a result of income instability, job loss, medical emergency, death of a relative, or other unexpected life event (McKernan, Ratcliffe, & Vinopal, 2009). Nonetheless, ownership of accounts that foster asset accumulation remains low among LMI households. Results from the 2012 R2S Intention Survey indicate that households with higher income are far more likely to hold asset-building accounts than LMI households are (Grinstein-Weiss, Tucker, Key, Holub, & Ariely, 2013). Most Americans will experience economic insecurity at some point in their lives (Rank, 2005). Since the late 1960s, the risk of economic insecurity has been increasing for most Americans between the ages of 25 and 60 (Rank, Hirschl, & Foster, 2014). Across all levels of the income distribution, American households are unprepared for financial shocks (Grinstein-Weiss et al., 2013, Grinstein-Weiss, Russell, Tucker, & Comer, 2014). Many recognize the importance of emergency savings, but immediate needs and a lack of resources may limit the ability of some to set money aside (Brobeck,
2008). This dilemma is not surprising in the context of economic trends and particularly the recent economic downturn. Wages for LMI households have flagged since the 1960s (Gordon & Becker, 2008). In 2011, roughly 20% of all U.S. households lost nearly a quarter of their total resources (Hacker, 2012). The unemployment rate peaked at one in 10 in 2009, and though it has slowly improved (to about 7.6% at the time of this study), more than a third of the unemployed have been so for 6 months or longer (Bureau of Labor Statistics, 2014a, 2014b). The long-term unemployed face particular difficulty in reentering the job market (Krueger,
Cramer, & Cho, 2014). These trends have contributed to the economically precarious situation of LMI households in the United States, and minority households have been disproportionately affected. A 2004 study found that 60% of households of color do not have the means to cover at least 75% of their monthly expenses, and the same is true in 40% of working-age households (Shapiro, Oliver, & Meschede, 2009). The likelihood of holding sufficient contingency savings is also correlated with factors like age, education, income, and marital status (Bhargava & Lown, 2006). Because of these factors, many households are vulnerable to the effects of unexpected loss of income and to necessary but unexpected expenses (financial shocks).
The experience of such financial shocks varies across households. Financial emergencies are more common in and have a greater impact on larger households. Expenses and child-rearing costs rise with household size. Also, households with more children have less emergency savings and are less likely to be prepared for unexpected expenses (Babiarz & Robb, 2014). Average annual expenditures per child range from $8,990 to $10,230 among LMI families (Lino, 2013), and a financial shock may significantly interfere with a family’s ability to meet these costs. Accordingly, households with children report difficulty coping with financial shocks, and the severity of such shocks is associated with the number of children (Lusardi, Schneider, & Tufano, 2011). Thus, encouraging families to save may be especially important and challenging. A financial emergency can threaten an unprepared household’s economic, social, psychological, and physical well-being. When presented with a financial shock, many households seek out alternative financial services such as those offered by payday lenders, pawn shops, and check-cashing outlets. The services tend to be predatory and financially harmful. They typically charge exorbitant interest rates and fees, placing households in a difficult, long-term struggle to repay the obligation. These services and products often limit long-term savings, purchases of necessities, and access to credit and other financial institutions (Barr, 2012; Chase et al., 2011; Couch, Daly, & Gardiner, 2011;
Heflin, London, & Scott, 2011; Rawlings & Gentsch, 2008).
Many people who encounter a financial shock and lack contingency resources experience psychological distress. Such distress can reduce the quantity and quality of interactions with members of their household (Rothwell & Han, 2010), negatively affect children and marriages, and lead to adverse effects on physical and mental health (Conger et al., 2002; Finke & Pierce, 2006). Likewise, lack of adequate funds during a financial crisis may limit access to material necessities and result in material hardship, which can negatively affect health and well-being (Pilkauskas, Currie, & Garfinkel, 2012). Families coping with such events often forgo medical care or are unable to cover the costs of food, housing, and clothing (Beverly, 2001; Heflin et al., 2011). Having savings may reduce the incidence and impact of material hardship. Families that use banking services and own bank accounts are far less likely to experience material hardship than are unbanked and underbanked families (Lim, Livermore, & Davis, 2010). However, the lack of access to or engagement with a banking institution is an important barrier to saving, and it prevents many LMI households from accumulating assets.
PSyCHOLOgICAL AND BEHAVIORAL FACTORS
Recent evidence from behavioral economics provides a framework for understanding and promoting positive financial behaviors. Policymakers are leveraging this research to develop approaches that can increase economic security (Amir et al., 2005). As such research shows, people are not the rational economic actors that traditional, neoclassical economics would suggest them to be (Ariely, 2010, 2011; Becker, 1976; Caplan, 2000; De Bondt & Thaler, 1994; Kahneman, 2003; Kahneman & Tversky, 1979; List, 2004). Their everyday economic behaviors (i.e., saving, buying, and consuming) are predictably uncalculated and driven by psychological, social, and emotional processes. Furthermore, procrastination, inertia, and limited attention limit sound financial decision making (Johnson et al., 2012).
Such insights into cognitive biases have led proponents of asset building to develop strategies to encourage positive financial choices. Taking into account human irrationality allows us to adapt the ways in which information is presented and to consider which conditions will encourage individuals to override faulty perceptions. In other words, techniques based in behavioral economics have the potential to remove psychological and behavioral barriers to saving at tax time (Congdon, Kling, & Mullainathan, 2009). Several
lessons from behavioral-economics studies may be applied to interventions that encourage people to save.
Future orientation
Typically, individuals make decisions grounded in the present, but they discount the future (Benhabib, Bisin, & Schotter, 2010). Research on this present bias can explain why many do not save enough for retirement (Diamond & Köszegi, 2003). Interventions aimed at shifting the orientation of decision makers to the future show promise as pathways to encouraging long-term savings (Bryan & Hershfield, 2012; Hershfield, et al., 2011). A related phenomenon is the tendency to assume that one’s financial, personal, and social position will be better in the future (Bryan & Hershfield, 2012). People may discount the likelihood of emergency events, including auto or home repairs, moving expenses, and health-related costs. These tendencies limit the likelihood of planning for such unforeseen events.
Findings from the 2012 R2S Intention Survey suggest ways to minimize present bias. For example, the survey prompted treatment participants to think about their future selves at retirement and asked them to register their intentions concerning the allocation of their tax refund. Among those with an annual adjusted gross income less than $35,000, treatment participants intended to allocate 13% more of their tax refunds to savings than control participants did (Key et al., 2013).
Choice architecture
Individuals are constantly presented with choices. By employing choice architecture—design features created to increase the salience and perceived attractiveness of a given financial choice—researchers can help people avoid common pitfalls in decision making (Johnson et al., 2012). In the process, researchers increase the likelihood that consumers will choose to improve their economic well-being or decrease the likelihood of that they will behave in a financially detrimental manner. For example, choice architecture might limit the number of possible choices so that the only options are financially beneficial ones. Such techniques have been used effectively in Medicare drug plans (Congdon, Kling, & Mullainathan, 2011) and investment plans (Cronqvist & Thaler, 2004).
The power of the default option
In many situations, people tend to rely on the default options given to them (Kahneman, 1991). This reliance
can stem from inertia or from their comfort in and trust of the status quo. Promising results have emerged from behavioral-economics interventions that leverage this tendency toward the default. Interventions to boost retirement savings show that making enrollment the default option (instead of requiring one to act in order to enroll) can increase utilization of savings products and might increase long-term commitment to saving (Benartzi & Thaler, 2007; Beshears, Choi, Laibson, & Madrian, 2009; Choi, Laibson, Madrian, & Metrick, 2004).
Anchoring
Informational markers or points of reference influence decisions involving the selection of a value, and this phenomenon is known as anchoring (Munro & Sugden, 2003; Sen, 1993). Research shows that individuals generate their own anchors and tend to choose values close to the initial values considered (Epley & Gilovich, 2001, 2004, 2005; Tamir & Mitchell, 2012).
Self-generated reference points are vulnerable to faulty human perception because individuals rely on missing or incomplete information to create them (Epley & gilovich, 2006). However, people have a tendency to stay on or near anchors if such reference points are provided (Simmons, LeBoeuf, & Nelson, 2010). A potential strategy to increase the amount of savings is to provide such anchors (for example, if we suggest saving 75% of the refund, we would expect filers to choose to save close to 75% of their refunds). In summary, research demonstrates the need for emergency savings and the potential benefits of such savings for LMI households. Electronic filing programs create a special opportunity to encourage and facilitate saving at a time when millions of Americans receive a substantial sum of money. Incorporating several established principles from behavioral economics may enhance strategies to boost saving. This context has influenced the design of the R2S study and the findings detailed in this report.
III. RESEARCh DESIGN
The R2S initiative is a large-scale, multiyear research project that tests the impact of interventions on saving behaviors at tax time. Designed as a randomized controlled trial, the experiment randomly assigned tax filers to one of several treatment conditions informed by behavioral economics or to a control condition with no exposure to an intervention. The use of randomization and a control group, design features that are widely accepted as benchmarks in clinical and field research, enable us to compare treatment conditions and isolate treatment effects. We expect that the different groups would have the same average outcomes if they were not exposed to the treatments and that we can attribute any differences between groups to the effect of the intervention.
PARTICIPANTS
As part of its participation in the Free File Alliance, Intuit offers the free online TTFE to filers who meet certain criteria. In 2013, tax filers were qualified to use TTFE if they (a) had an adjusted gross income of less than $31,000, (b) qualified for the Earned Income Tax Credit (EITC), or (c) were an active-duty member of the military with an adjusted gross income of less than $57,000. The TTFE platform enables testing of interventions with a large, nationwide participant pool. The experiment launched on January 31, 2013, the second day of the 2013 tax-filing season, and closed 2 days after the tax-filing deadline: April 17, 2013.2 To test many different interventions, we split the tax-filing season into three test periods: 259,429 filers participated during Period 1 (January 31–February 13), 207,215 participated during Period 2 (February 14–March 13), and 213,901 participated during Period 3 (March 14–April 17). In each subperiod, TTFE assigned all users receiving a tax refund to a control group or to one of six treatment conditions, and the probability that a participant would be assigned to a given group was equal across the groups.3 The sample for the 2013 R2S experiment consists of 680,545 LMI tax filers who submitted returns through TTFE and whose returns indicated that they were due a refund.
2Software developments necessary for the R2S experi-ment were not ready to deploy until January 31, 2013; Filers who began preparing their taxes on or before January 30 (n = 95,857) were unable to participate. 3Because they could not be assigned randomly to a
treatment condition, we excluded tax filers who start -ed the filing process in a different TurboTax product and later used TTFE (n = 91,383).
INTERVENTION
The experiment tested two behavioral mechanisms: motivational messages (i.e., prompts) and default suggestions for the amount to be saved (i.e., anchors). The 2013 prompts reflect lessons learned during previous phases of the initiative (Grinstein-Weiss, et al., 2013; grinstein-Weiss, gale, et al., 2014; Key, et al., 2013). The TTFE software presented prompts to filers near the end of the tax-filing experience, after they learned the amount of their refunds. Each prompt appeared at the top of the web page, beside a small graphic depicting a piggy bank. The experiment included three treatment prompts and one comparison prompt:
Emergency prompt: “Do you have enough money for an emergency? A Harvard study found that most Americans could not come up with $2,000 for something unexpected. We can help you stay prepared.”
Family prompt: “Have a family or thinking of starting one? Start building a bright future for them.”
Future prompt: “Save for your future, and get peace of mind. Feel more secure about your future with a little extra money in the bank.” Generic prompt: “Why not save a little money? you can split your federal refund into a savings account or get a U.S. Series 1 Savings Bond.” Any effects of the treatment messages are relative to that of the Generic message (akin to treatment as usual), which also prompted tax filers to save. The treatment prompts differ from the generic prompt in that we integrated behavioral economics principles into their designs. Thus, importantly, any superiority of a treatment prompt over the control prompt is attributable to the implementation of behavioral economics techniques—not simply to the prompting to save. All three treatment messages prompt filers to consider a concrete reason for saving. Although the Future prompt is the most explicit of the three, all treatment messages prompt filers to consider the future. The Emergency message differs from the other treatment prompts in that it includes a social proof (Cialdini, 2006). The behavioral principle of social proof is included by prompting filers to think about how their situations compare with those of “most Americans.”
Anchoring, the other major behavioral mechanism tested in R2S, involves recommending a savings level to participants in treatment groups and prepopulating a field in the web form with that amount or percentage. The 2013 R2S experiment employed five anchors:
1. 25% of the tax refund 2. 50% of the tax refund 3. 75% of the tax refund 4. $100
5. $250
The TTFE software presented a randomly assigned anchor to each refund recipient in one of the six treatment groups within each test period. Refund recipients in the control condition received no anchor. As Figure 1 shows, TTFE presented the anchors directly below the prompt, and the prompt was set in green font so that it would stand out from the other text on the page. Filers assigned to treatment groups with dollar-amount anchors (i.e., $100 or $250) did not see a suggestion to save a percentage of the refund.
Because savings bonds are available only in multiples of $50, TTFE rounded down the prepopulated savings amounts to the nearest $50. For example, a filer who was due a refund of $450 and assigned to a treatment
group with a 50% anchor saw a suggested savings amount of $200: the amount remaining after 50% of the refund ($225) is rounded down to the nearest increment of $50.4 Because rounding has a proportionally greater effect on anchors for small refunds, analyses generally exclude participants with refunds of less than $250 (n = 82,352). Interventions consisted of different combinations of prompts and anchors (see Table 1). The interventions consisted of a single screen, which was integrated with essential functions of tax-filing software and which users could easily navigate in seconds or minutes.
DATA COLLECTION
TurboTax software data
Intuit created a completely anonymous set of data on all TTFE users receiving a refund and shared this 4With rounding, the suggested amount is actually
equiva-lent to 44% of the $450 refund in the example. On aver-age, the nominal anchor was 3.3% less than the actual one. Most tax filers (79%) saw a nominal anchor that was within 5% of the actual one.
Figure 1. A screenshot within TurboTax Freedom Edition showing an Emergency prompt paired with a prepopulated savings sug-gestion anchored at 25% of the tax refund.
with the researchers for analysis. These TTFE data provide filing status (e.g., single or married and filing jointly), the number of dependents, age, income, tax credits and deductions claimed, and the amount of refund received. Because the data came directly from federal income tax returns, and there are potential financial or legal consequences for inaccurate filings, we assume they are highly accurate. The data set also indicates treatment status (assignment to the control group or to one of the treatments) and includes a measure of the outcome of highest interest: allocation of the refund. A filer could choose to receive the refund via electronic deposit or as a paper check. The entire refund could be sent to a single account (e.g., checking account) or divided (e.g., between checking and savings accounts, or between a paper check and Series I U.S. Savings Bond).5 The TTFE data capture (a) whether the participant deposited any of the refund into a savings vehicle (a savings account or savings bond); (b) whether the participant split the tax refund, allocating at least part of it to a savings vehicle; and (c) the portion—in dollars and as a percentage of the total refund—directed to a savings vehicle.
Longitudinal survey data
We supplemented TTFE data with information from two waves of the HFS, which enabled us to assess the impact of the R2S interventions over a 6-month period and to collect detailed information about the financial lives of LMI households. A link within TTFE invited experiment participants to complete the first wave of the survey (HFS1) immediately after they filed their taxes. We designed the HFS1 to take approximately 5Internal Revenue Service Form 8888 underlies the
op-tion in the TTFE platform to split the refund across more than one account or vehicle.
20 minutes and allowed participants to skip questions. We collected the survey data via Qualtrics online software, obtained explicit consent from participants (pursuant to Title 26, Section 7216, of the Internal Revenue Code), and paired the data from the survey with that from the TTFE software.
We invited TTFE users to take the HFS1 if they filed a return on or after January 31 and received a federal tax refund. About half of the HFS1 questions focused on debts and assets. The responses provide information for household-level variables rather than for individual-level ones. The survey asked respondents to report whether their households have specific types of debts and assets (see Tables 7 and 8). It also asked them to estimate the value of those obligations and holdings. If respondents did not answer the valuation question, a follow-up question asked them to choose from a list of value categories (i.e., $0, Less than $500, $501–$1,000, $1,001–$2,000, more than $2,000). Other survey sections focused on filers’ financial behaviors, such as budgeting strategies and the use of alternative financial services (e.g., payday loans), during the 12 months prior to the survey. Many HFS1 questions directly replicated previously validated survey instruments. For example, we drew upon the work of Lusardi et al. (2011, p. 88) for the following question: “How confident are you that you could come up with $2,000 if an unexpected need arose within the next month?” In the HFS1 data set, one area of high interest is the information on intended use of tax refunds. The survey asked respondents about their plans for their refunds and instructed them to specify the expected allocation of the refund by giving the percentage earmarked for each of the following categories:
1. “Paying off debt you owe now”
2. “Spending in the next month or so on products, services, or regular bills like rent or utilities”
Period 1 (January 31–February 13) Period 2 (February 14–March 13) Period 3 (March 14–April 17) Generic, no anchor (control) Generic, no anchor (control) Generic, no anchor (control)
generic, 25% generic, 50% Emergency, $100
generic, 50% generic, 75% Emergency, $250
Emergency, 25% Emergency, 50% Future, $100
Emergency, 50% Emergency, 75% Future, $250
Future, 25% Future, 75% Emergency, 25%
Family, 25% Family, 75% Future, 25%
Note: Generic, Emergency, Future, and Family indicate the prompts presented to filers via the in-product offer in TurboTax Freedom Edition. The percentages and dollar amounts indicate the suggested anchors.
3. “Savings you expect to keep for a few months” 4. “Savings you expect to have this time next year” 5. “Savings for something further in the future” To gather information about their actual use of the tax refunds, we subsequently e-mailed HFS1 respondents, inviting them to participate in a follow-up survey (HFS2) conducted 6 months after tax filing. To observe changes over time, the follow-up survey posed the same questions asked during the HFS1, but we added several items to capture household financial situations during those 6 months. In addition to the questions from HFS1, the HFS2 asked respondents whether they moved, started a new job, or experienced any of several financial shocks: A household member experienced a period of unemployment, required a trip to the hospital, needed a major vehicle repair, or paid legal fees. The HFS2 also asked respondents what they did with their tax refunds. The allocation categories differ from those used in HFS1, and saving is collapsed into one category. Respondents to the HFS2 indicated the percentage of the refund allocated for each of the following purposes:
1. “Used to pay down debt”
2. “Spent within 1 month of receiving the refund” 3. “Spent after 1 month of receiving the refund” 4. “Saved and still have”
We followed this survey item with more specific questions about use of refunds. For example, we asked those who paid down debt to specify the types of debt they paid. Similarly, we asked those who spent part of their refund to identify the kinds of items purchased, and we included an open-ended “other” category. We also asked those who saved their refund what kind of accounts they saved in, and we offered the following response options: regular savings account, checking account, prepaid card, retirement account, education account, U.S. savings bonds, or other (the respondent could specify). Those who reported saving any portion of their refunds for 6 months were also asked what they saved for: emergencies or other unexpected needs, a special purchase, retirement or other long-term needs, children or grandchildren, or other.
An important element of the HFS2 is that it allows participants to define saving: The survey asked them to specify the percentage of the refund saved, regardless of where they saved it (e.g., holding refund money as cash or in a checking account). In contrast, the TTFE data use a more limited definition: Saving is a deposit into a savings account or a purchase of savings bonds as opposed to
receipt of a mailed paper check or deposit into a checking account. One implication is that some participants identified as savers in HFS2 were not classified as savers according to the definition used in the TTFE data. As such, HFS2 provides a more accurate and complete picture of respondents’ actual tax-refund saving behaviors, which may have been influenced by prompts and anchors even if respondents did not choose to deposit their refunds into a savings account or to purchase savings bonds at tax time. The limited definition of saving in the TTFE data also may mean that the measured effects of the interventions understate the true impact. Conversely, the TTFE data may mistakenly identify participants as savers if they deposited the refund into savings at tax time but then transferred the money for other purposes. Data from HFS2 enable us to explore these possibilities.
We identified two main outcome measures of interest from the HFS2: whether participants saved any of their refunds for 6 months and the amount saved. We are interested in whether these outcomes differ by randomly assigned treatment conditions.
One caveat is that HFS data were self-reported, and the survey included several questions that may have been difficult to answer accurately. However, a comparison of data from the TTFE and the two waves of the HFS suggests that the self-reported HFS responses are highly reliable. For example, even 6 months after filing their taxes, respondents’ self-reports of tax refund amounts correlated with the refund amounts in the TTFE data (r = .95, p < .001).
We cannot determine how accurately responses reflect reality. Unless participants kept tax-refund savings separate
Summary of savings outcome measures
TTFE data: Tax-time savings deposits • Whether filers deposited any of the tax
refund to a savings vehicle
• Whether filers split the tax refund to a savings vehicle
• Dollar amounts deposited to a savings vehicle
HFS2 data: 6-month savings
• Whether survey respondents reported that they “saved, and still have” any refund (note: not necessarily in savings vehicle)
• Percentage of the refund that they reported they “saved, and still have”
from other savings and income, they may have been unable to determine at the HFS2 how much of the refunds they used for spending, saving, and debt repayment. Therefore, we consider the response to the question about the saved amount to be largely perceptual.
We also can examine measures of holdings (i.e., assets and liabilities, and calculated liquid assets and net worth) and changes over time, but we observed large, unexpected fluctuations between the time of filing and the HFS2. As such, we focus on the self-reported use of tax refunds. ANALySIS
Analysis of TTFE data is relatively straightforward: We can largely ignore issues related to selection bias and mitigating financial factors, because there was no opportunity for self-selection into the R2S experiment, and financial factors are equally distributed across groups via randomization. We also can be confident that the outcomes observed among treatment groups resulted from the exposure of those groups to the respective treatments. Descriptive comparisons of treatment-group characteristics confirm that the random assignment effectively generated roughly equivalent groups. Simple t-tests are sufficient to compare outcome means and proportions among treatment groups. In general, we believe that findings from TTFE data can be generalized to the LMI taxpayer population in the United States; however, we recognize that the sample may disproportionately represent individuals who file their own taxes and are Internet savvy.
Variation in tax filers’ characteristics by the timing of filing (i.e., when they filed during the tax season) complicates analysis. For example, people who file early in the tax season have significantly larger refunds, claim more dependents, and are more likely to file as head of household. Thus, we cannot compare outcomes of interventions across test periods without controlling for filing date.
Because we cannot assume that HFS respondents are selected randomly, analysis of HFS data—especially data from the HFS2—required a different empirical approach than the one employed in analysis of the TTFE data. Respondents to the two waves of the HFS differ from the TTFE population in several observable ways. For example, HFS respondents are somewhat older and more likely to be married. Of greater concern is the possibility that unobserved factors influence the likelihood of participating in the HFS. As a result, we generally refrain from using HFS data to make assumptions about the TTFE population. However, we compared participants within each test period and observed no differences in HFS response rates across treatment conditions. We therefore
can confidently measure treatment effects within the HFS subsample.
The HFS subsample is considerably smaller than the TTFE population. To maximize the sizes of comparison groups, we combined interventions with the same prompt or anchor in some models, rather than examining each specific intervention combination. For example, some models estimated the influence of anchor levels on savings outcomes but disregarded prompts. Others estimated the effects of the different prompts but ignored the anchor level. Findings from analysis of the 2012 TTFE data reveal that anchors are more effective than prompts in increasing the amounts of deposits to savings vehicles and that prompts are not associated with savings differences (Grinstein-Weiss, Gale, et al., 2014). Because we identified the anchor as the main mechanism for determining the level of tax-time saving, we can restrict HFS2 data analyses to focus on examining the marginal effects of anchor levels on saving behaviors in the 6 months between filing and the HFS2.
We used multiple regression techniques to control for many factors that may affect outcomes and to improve overall model fit; we selected these covariates on a model-by-model basis. We generally incorporated factors that may explain saving behaviors after tax time. Most models accounted for participant’s age, number of dependents, and tax refund amounts. When we analyzed data from the entire experiment’s sample, rather than from respondents who filed during a single test period, we included the filing date as a covariate. Sample sizes vary slightly from one analysis to another because of listwise exclusion of cases when data are missing. Because anchors were rounded down to the nearest $50 increment, we also employed a covariate to account for the difference between the nominal and actual anchors. In models that estimated the effects of anchors, we used this covariate to account for the potential downward bias of instances in which the actual and nominal anchors differ. If level of debt or assets was the outcome of interest, we included other predictors (e.g., level of education and race).
We based regression models on the outcome of interest. We employed ordinary least squares regression to
estimate continuous outcome variables (e.g., the amount deposited into a savings account) and logistic regression to estimate binary outcome variables (e.g., whether a participant saved any of the refund).
Immediately after filing taxes
Tax time
6 months later
All TurboTax Freedom Edition tax filers who received a refund
Participated in HFS1
Included in descriptive analyses Participated in HFS1Included in descriptive analyses
Participated in HFS2
Sample for analysis of sustained effects of R2S
Included in descriptive analyses
Participated in HFS2 Excluded from R2S analysis†
Included in descriptive analyses Randomized in R2S
Viewed anchor-prompt combination Sample for analysis of tax-time
effects of R2S
Not randomized*
Excluded from R2S analysis
HFS1 total n = 20,816 HFS2 total n = 8,484 (n = 873,026) (n = 680,545) (n = 192,481) (n = 12,809) (n = 8,007) (n = 4,940) (n = 3,544)
Figure 2. Overview of participant recruitment and inclusion in analyses. Note: R2S = Refund to
Savings experiment; HFS1 = Household Financial Survey, first wave; HFS2 = Household Financial
Survey, second wave.
*Those who submitted their taxes to the IRS before January 31, 2013, or who began filing in a
different TurboTax product before using TurboTax Freedom Edition were not randomized.
†The number of HFS participants excluded from the analysis of the R2S experiment includes those
who were not randomized as well as those who may have been randomized but whose consenting names did not match the IRS record. The absence of a match between the consenting name and the record rendered their randomized assignment unknown to the researchers.
IV. pARTICIpANT ChARACTERISTICS
As we have mentioned above, the 2013 R2S initiative involved data collected at three points: during TTFE filing, during the HFS1 immediately after tax filing, and during the HFS2 conducted 6 months later. During the TTFE phase of data collection, 873,026 individuals filed returns through the TTFE program and were due a tax refund. The analytical sample, which excludes individuals who were not randomly assigned to one of the experimental conditions, consists of 680,545 participants. For an overview of the acquisition of the analytical sample, see Figure 2. As Table 2 suggests, the analytical sample closely resembles the full population of 873,026 TTFE filers on most observed measures. Most filers who contributed TTFE data (95%) qualified to use the free software by having an adjusted gross income of less than $31,000; however, 4.5% qualified by claiming the EITC (the adjusted gross income of these filers was higher than $31,000), and only 0.4% qualified through active-duty military service. It should be noted that the average income of TTFE filers receiving refunds (and that of R2S participants) was less than $15,000. That is significantly lower than the maximum income threshold ($31,000) specified in TTFE eligibility criteria. As Table 2 shows, the average age of TTFE filers was about 34 years. Roughly two thirds of participants filed with a household status of single, 21% filed ashead of household, and 10% filed jointly with their spouse as a married couple. Twenty-nine percent of participants in the TTFE data claimed a dependent on their tax return, and the average federal income-tax refund was $1,833 (see Illustration 1).
Assessed population (in R2S experiment)Analytical Sample
Characteristic TTFE HFS1 HFS2 TTFE HFS1 HFS2
N 873,026 20,816 8,484 680,545 12,809 4,940 Age in years 34.1 36.1 35.2 34.0 36.4 35.5 (15.4) (14.1) (13.2) (15.7) (14.7) (13.8) Gender (% female) NA 60.6 61.3 NA 58.9 59.8 Filing status % single 66.1 63.5 63.9 68.4 68.3 69.7 % head of household 22.5 20.8 19.3 20.8 17.8 15.5
% married filing jointly 10.4 14.9 15.9 9.9 13.1 14.0
% current student NA 27.3 27.1 NA 28.2 27.8
% college educated NA 43.0 49.9 NA 43.2 51.0
% non-White race NA 21.3 20.2 NA 19.4 18.0
% Hispanic ethnicity NA 8.0 7.8 NA 8.2 8.1
% claiming dependents 31.6 33.3 33.0 29.1 28.1 26.9
Adjusted gross income ($) 14,819 16,546 17,520 14,378 15,666 16,634
(9,739) (10,208) (10,174) (9,600) (10,001) (9,968)
Federal tax refund ($) 1,964 2,105 2,179 1,833 1,835 1,875
(2,389) (2,305) (2,333) (2,332) (2,114) (2,117)
Note: IPO = in-product offer; HFS = Household Financial Survey; R2S = Refund to Savings experiment; TTFE = TurboTax Freedom Edition; HFS1 = Household Financial Survey, first wave; HFS2 = Household Financial Survey, second wave; NA = demographic characteristics are not collected with tax data. Unless otherwise specified, values are means with standard deviations in parentheses.
Table 2. Demographic Characteristics from the Experimental, Tax (TTFE), and HFS Data
Illustration 1. Characteristics of R2S participants. Values in top row are medians.
After filing their taxes, 20,816 TTFE users responded to an invitation to take the HFS1. Of these, 18,839 (92%) could be matched to the TTFE data.6 A high proportion (91%) of people who began the HFS1 finished it. The entire survey took approximately 20 minutes to complete (20 minutes was the median). Overall, the demographic characteristics of the two HFS subsamples (participants who completed only HFS1 and those who completed both waves; see Table 2) are very similar to each other and to the full TTFE population. This indicates that selection bias is limited. For the first 3 days of the tax season, the R2S team offered filers a $20 incentive to take the HFS1. Thus, response rates to the survey were higher during that time (about 10% with the incentive vs. 1.2% without). We discontinued the incentive because the response exceeded our expectations and limited resources.
Six months after completing the HFS1, the R2S team invited 17,952 individuals to participate in the HFS2. Of those invited, 8,659 clicked the e-mailed link to take the survey (48% response rate), and 8,251 (95%) of those who responded to the invitation completed the HFS2. The average time elapsed between HFS1 and HFS2 was 6 months and 9 days (SD = 9 days). The response rate helps ensure that the HFS2 subsample is demographically comparable with the HFS1 subsample. Also, the
experimental groups in the HFS2 did not differ within test period on any demographic characteristic. This indicates that group equivalence generated by randomization was retained and the ability to attribute differences to the intervention holds at the 6-month point. We offered a $20 incentive to those HFS2 participants who received an incentive for completing the HFS1 and $5 or $15 to HFS2 participants who received no previous incentive from R2S. Compared with the subsample of filers who completed the HFS1, the HFS2 subsample was younger, had higher income, and reported higher educational attainment. The demographic traits of the two subsamples are otherwise very similar (see Table 2 for a summary of descriptive characteristics).
TAX-RELATED CHARACTERISTICS
Among TTFE filers receiving a refund, only 4% itemized their tax return; in comparison, about one third of all filers in the United States submit itemized returns 6 Names of survey participants granting consent were
required to exactly match names on tax forms in or-der for Intuit to share the data with researchers at the Center for Social Development. For example, if a filer consented under a married surname but a maiden surname was on the tax record, the names would not match and data could not be shared.
(Internal Revenue Service, 2014b). About half of TTFE filers (54%) had no federal tax liability in 2012; the average tax liability among those with any was $918, and the median was $708. Most TTFE filers in this sample (93%) had taxes withheld via payroll deductions. The mean amount withheld was $1,122 in 2012, and the median was $758.
The EITC is an important policy that benefits many LMI filers; it is worth noting that 93% of refund-receiving TTFE filers reported earned income but that 59% did not qualify for the EITC. Our analysis of the TTFE data suggests that the EITC’s age requirements are the most common reason why filers without dependents were ineligible to receive the credit. A filer claiming no dependent was eligible to receive the EITC in 2013 if he or she was between the ages of 25 and 65 (Internal Revenue Service, 2013b). Among wage earners in the TTFE sample who did not receive the EITC (n = 477,398), 60% did not qualify because they were under age 25, and an additional 3% did not qualify because they were older than age 65. Income criteria excluded 23% of wage earners in this group.
The median EITC received by those who qualified was $2,142, and the mean was $2,191. Among TTFE filers who received any EITC, the credit makes up two thirds of the total federal tax refund. On average, the refund for those who received the EITC was more than 4.5 times higher than the refund for people who did not receive the credit ($882 vs. $3,498).
HOW DO R2S PARTICIPANTS COMPARE WITH THE U.S. POPULATION?
Perhaps because filing taxes online requires technical savvy, participants in the R2S experiment and the HFS tended to be younger and better educated than the general U.S. population. They also were more likely to be students. The median age of TTFE filers receiving a refund was 28 years in 2013, while the median age of U.S. taxpayers was about 45 (Internal Revenue Service, 2014b, pp. 77–78, Table 1.6). More than a quarter of HFS respondents indicated that they were enrolled students, but the rate of enrollment is only about 9% for the U.S. adult population.7 Compared with the general population of filers in the United States, HFS participants and TTFE users were also more likely to file as single and less likely to file as married filing jointly (Internal Revenue Service, 2014b). The racial makeup of HFS participants is similar to that of the 7 Estimated from the count of students enrolled in
post-secondary institutions in 2012 (National Center for Ed -ucation Statistics, 2013) and from the total U.S. adult population in 2012 (U.S. Census Bureau, n.d.).
general population in the United States: 21% of HFS participants identify themselves as White, and non-Whites comprise 22% of the U.S. population. Hispanic ethnicity is underrepresented in the HFS subsample: 8% of participants vs. 17% of the U.S. population (U.S. Census Bureau, 2013). In our study (TTFE data and HFS data), the proportion of households with dependents was about the same as the proportion of tax-filing households claiming dependents in the U.S. population (Internal Revenue Service, 2014a). Because use of TTFE is limited to filers who have low or moderate income, the median adjusted gross income of R2S participants was much lower than the U.S. median ($13,104 versus $36,055 for the U.S. population in 2012; Internal Revenue Service, 2014b, p. 27, Table 1.1). Similarly, the average tax refund of R2S participants ($1,833) was smaller than the U.S. average ($2,755) in 2013 (Internal Revenue Service, 2013a).
DIFFERENCES By FILINg DATE
Tax-preparation experts have long recognized that two surges of tax-filing activity occur during the tax season, and they often refer to two “peaks.” Early (Peak 1) filers are thought to be eager to get their refunds as soon as possible, and late-season (Peak 2) filers are generally believed to be less eager to get their refund or are considered procrastinators. Examination of our sample’s characteristics by filing date reveals trends that are important to consider in analyses and in the design of future studies. We found that several traits changed in a gradual way during the tax season and were not associated with discreet groups or peak activity. For example, adjusted gross income, refund amount, rate of depositing, and dollar amount deposited into a savings vehicle were all highest early in the season and decreased over time (see, e.g., Figure 3).
People filing on the first day of the tax season received refunds that, on average, were three times larger than those received by people who filed on the April
$0 $500 $1,000 $1,500 $2,000 $2,500 $3,000 $3,500 $4,000 April 15 April 1 1 April 4 March 28 March 21 March 14 March 7 February 28 February 21 Febryary 14 February 7 January 31 January 24 January 17
Period 1 Period 2 Period 3
Date filing began (2013)
Figure 3. Mean federal refund varies by date filing began (n = 853,674).
15 deadline. Some variance in characteristics is even apparent by day of the week: Intraweek peaks in the mean refund amount occurred mid-week, and troughs occurred on weekends. These findings informed our analyses: Because the filers differ over time, we generally refrain from comparing the effects of the R2S intervention across the three test periods. If we do make comparisons across the periods, we try to account for differences in filer characteristics over time by including filing date as a covariate in regressions. See Table 3 for a summary of characteristics by test period.
Age
% Filing
single dependents% Claiming
gross income Federal tax refund
Periods N Mean SD Mean ($) SD Mean ($) SD
Period 1 259,429 34.4 14.7 57.1 41.9 16,249 9,590 2,492 2,563
Period 2 207,215 34.0 16.2 68.9 28.3 14,460 9,561 1,785 2,496
Period 3 213,901 33.5 16.5 81.5 14.5 12,675 9,427 1,080 1,484
All participants 680,515 34.0 15.7 68.4 29.1 14,581 9,645 1,833 2,332
Note:Periods refer to the dates on which filing began in TurboTax Freedom Edition. Period 1 is January 31–February 13, Period 2 is February 14–March 13, and Period 3 is March 14–April 17. The 2013 tax season began on January 31, 2013 and ended on April 17, 2013.