University of Pennsylvania
ScholarlyCommons
Statistics Papers
Wharton Faculty Research
2001
Data Mining Criteria for Tree-Based Regression
and Classification
Andreas Buja
University of Pennsylvania
Yung-Seop Lee
Follow this and additional works at:
http://repository.upenn.edu/statistics_papers
Part of the
Computer Sciences Commons, and the
Statistics and Probability Commons
At the time of publication, author Andreas Buja was affiliated with AT&T Labs, Florham Park, NJ. Currently (August 2016), he is a faculty member at the Statistics Department at the University of Pennsylvania.
This paper is posted at ScholarlyCommons.http://repository.upenn.edu/statistics_papers/195
For more information, please [email protected].
Recommended Citation
Buja, A., & Lee, Y. (2001). Data Mining Criteria for Tree-Based Regression and Classification.Proceedings of the Seventh ACM SIGKDD International Conference on Knowledge Discovery and Data Mining, KDD '0127-36.http://dx.doi.org/10.1145/ 502512.502522
Data Mining Criteria for Tree-Based Regression and Classification
Abstract
This paper is concerned with the construction of regression and classification trees that are more adapted to data mining applications than conventional trees. To this end, we propose new splitting criteria for growing trees. Conventional splitting criteria attempt to perform well on both sides of a split by attempting a
compromise in the quality of fit between the left and the right side. By contrast, we adopt a data mining point of view by proposing criteria that search for interesting subsets of the data, as opposed to modeling all of the data equally well. The new criteria do not split based on a compromise between the left and the right bucket; they effectively pick the more interesting bucket and ignore the other.As expected, the result is often a simpler characterization of interesting subsets of the data. Less expected is that the new criteria often yield whole trees that provide more interpretable data descriptions. Surprisingly, it is a "flaw" that works to their advantage: The new criteria have an increased tendency to accept splits near the boundaries of the predictor ranges. This so-called "end-cut problem" leads to the repeated peeling of small layers of data and results in very unbalanced but highly expressive and interpretable trees.
Keywords
Boston housing data, CART, Pima Indians diabetes data, splitting criteria Disciplines
Computer Sciences | Physical Sciences and Mathematics | Statistics and Probability Comments
At the time of publication, author Andreas Buja was affiliated with AT&T Labs, Florham Park, NJ. Currently (August 2016), he is a faculty member at the Statistics Department at the University of Pennsylvania.
Data Mining Criteria for
Tree-Based Regression and Classification
ANDREAS BUJA 1, YUNG-SEOP LEE2
Abstract
This paper is concerned with the construction of regression and classification trees that are more adapted to data mining applications than conventional trees. To this end, we propose new splitting criteria for growing trees. Conventional splitting criteria attempt to perform well on both sides of a split by attempting a compromise in the quality of fit between the left and the right side. By contrast, we adopt a data mining point of view by proposing criteria that search for interesting subsets of the data, as opposed to modeling all of the data equally well. The new criteria do not split based on a compromise between the left and the right bucket; they effectively pick the more interesting bucket and ignore the other.
As expected, the result is often a simpler characterization of interesting subsets of the data. Less expected is that the new criteria often yield whole trees that provide more interpretable data descriptions. Surprisingly, it is a “flaw” that works to their advantage: The new criteria have an increased tendency to accept splits near the boundaries of the predictor ranges. This so-called “end-cut problem” leads to the repeated peeling of small layers of data and results in very unbalanced but highly expressive and interpretable trees.
1
Introduction
We assume familiarity with the basics of classification and regression trees. A standard reference is Breiman et al. (1984), hereafter referred to as CART (1984); a concise introduction can be found in Venables and Ripley (1997), and a more theoretical one in Ripley (1996).
Readers should know that tree construction consists of a greedy growing phase driven by a binary splitting criterion, followed by a pruning phase based on cost-complexity measures and/or estimates of generalization error. The growing phase yields the discoveries, the pruning phase the statistical protection against random structure. With the pruning phase in mind, the growing phase is free to overgrow the tree.
We are here concerned only with the growing phase, and hence with the splitting criteria that drive it. A typical criterion measures the quality of a proposed split in terms of a size-weighted sum of losses or impurities of the left and the right side of the split: crit(splitL,R) =wLlossL+wRlossR.
Such weighted sums constitute a compromise between the two sides. By contrast, the new splitting criteria proposed here combine the impurities of the left and right buckets of a split in such a way that low impurity of just one bucket results in a low value of the splitting criterion. These criteria need to be developed for regression and classification trees separately. Section 3 deals with regression, and Section 4 with classification.
This work originated in the course of a marketing study at AT&T in which the first author was involved. Due to the proprietary nature of the original marketing data, we demonstrate our proposals instead on public datasets from the UC Irvine Machine Learning Repository (1998). Because interpretability is the focus of this paper, we present these datasets in greater detail than usual. For the same reason we also include a larger number of tree displays than usual.
1Andreas Buja is Technology Consultant, AT&T Labs, 180 Park Ave, P.O. Box 971, Florham Park, NJ 07932-0971. [email protected], http://www.research.att.com/˜andreas/
2
Simplicity and Interpretability of Trees
We state the intent and some of the main points of the present work:
• Data mining, in contrast to traditional statistics, is not concerned with modeling all of the data. Data mining involves the search for interesting parts of the data. Therefore:
• The goal isnotto achieve superior performance in terms of global performance measures such as residual sums of squares, misclassification rates, and their out-of-sample versions. (TheR2
values and misclassification rates reported in the examples are only given for general interest.)
• The aspects of trees with which we experimented — simplicity and interpretability — are not easily quantifiable. We leave it as an open problem to find quantifications of these intuitive notions. Note that simplicity is not identical with size of a tree. This is a corollary of the example discussed next:
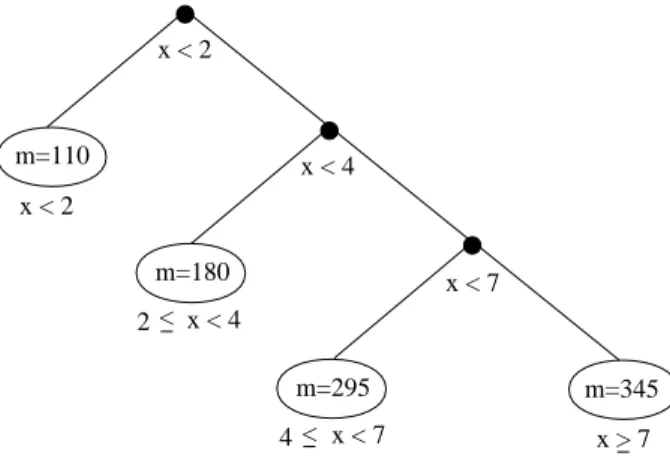
• The splitting criteria proposed here often generate highly unbalanced trees. Against a per-ception that more balanced trees are more interpretable, we argue that balance and inter-pretability are largely independent. In fact, there exists a type of maximally unbalanced tree that is highly interpretable, namely, those with cascading splits on the same variable, as illustrated in Figure 1. The simplicity of these trees stems from the fact that all nodes can be described by one or two clauses, regardless of tree depth. In Figure 1, it is apparent from the mean values in the nodes that the response shows a monotone increasing dependence on the predictor x. In the examples below we will show that tree fragments similar to the one shown in Figure 1 occur quite convincingly in real data.
x < 2 m=110 m=180 m=295 x < 2 x < 4 x < 7 m=345 x > 7 x < 7 4 x < 4 2 < <
Figure 1: An artificial example of a simple and interpretable yet unbalanced tree
3
Regression Trees
In regression, the impurity measure for buckets is the variance of the response values, and the splitting criterion is a compromise between left and right side bucket in terms of a weighted average of the variances: critLR = 1 NL+NR NLσˆL2 +NRσˆR2 , (1)
where we used the following notations for size, mean and variance of buckets: NL= #{n|xn≤c} , µˆL= 1 NL X n∈L yn , ˆσL2 = 1 NL X n∈L (yn−µˆL)2 , NR= #{n|xn> c} , µˆR= 1 NR X n∈R yn, σˆ2R= 1 NR X n∈R (yn−µˆR)2 , x being the splitting variable and cthe splitting value.
The new splitting criteria will do away with the compromise and respond to the presence of just one interesting bucket. “Interesting” could mean high purity in terms of small variance of the response, or it could mean a high or a low mean value of the response. Thus we wish to identify pure buckets (ˆσ2 small) or extreme buckets (ˆµextreme) as quickly as possible. This leads us to the
following two criteria:
• Criterion R1: One-sided purity
In order to find a single pure bucket, we replace the weighted average of left and right variances by their minimum:
critLR = min(ˆσL2, σˆ2R)
By minimizing this criterion over all possible splits, we find a split whose left or right side is the single bucket with smallest variance (purity). Note that for subsequent splits, both the high-purity bucket and the ignored bucket are candidates for further splitting. Thus, ignored buckets get a chance to have further high-purity buckets split off later on. Typically, a high-purity bucket is less likely to be split again.
• Criterion R2: One-sided extremes
In order to find one single bucket with a high mean, use the mean as the criterion value and pick the larger of the two:
critLR = max(ˆµL, µˆR)
Implicitly one of the bucket with the lower mean is ignored. By maximizing this criterion over all possible splits, we find a split whose left or right side is the single bucket with the highest mean. — An obvious dual for finding buckets with low means is:
critLR = min(ˆµL, µˆR)
These criteria are a more radical departure from conventional approaches because they dis-pense with the notion of purity altogether. The notion of purity seems to have been large unquestioned in the tree literature. Mean values have not been thought of as splitting criteria although they are often of more immediate interest than variances. From the present point of view, minimizing a variance-based criterion is a circuitous route to take when searching for extreme means.
At this point, a natural criticism of the new criteria may arise: their potentially excessive greediness. The suspicion is that they capture spurious groups on the periphery of the variable ranges, thus exacerbating the so-called “end cut problem” (CART, 1984, p. 313). This criticism is valid in the facts but not in the conclusion. First, the end cut problem exists but it can be controlled with a minimum bucket size requirement or a penalty for small bucket size. Second, there is an argument that the criteria for one-sided extremes may have a chance of succeeding in many situations: in real data the dependence of the mean response on the predictor variables is often monotone; hence extreme response values are often found on the periphery of variable ranges, just the kind of situations to which the criteria for one-sided extremes would respond. Finally, recall that the present goal is not to achieve superior fit but enhanced interpretability.
4
Two-Class Classification Trees
We consider only the two-class situation and leave more than two classes as an open problem. The class labels are denoted 0 and 1. Given a split into left and right buckets, let p0
L+p1L = 1, p0R+p1R= 1 be the probabilities of 0 and 1 on the left and on the right, respectively. Here are some of the conventional measures of loss or impurity, expressed for the left bucket:
• Misclassification rate: min(p0L, p1L). Implicitly one assigns the bucket to a class by majority vote and estimates the misclassification rate by the proportion of the other class.
• Entropy: −p0
L logp0L−p1Llogp1L. This can also be interpreted as the expected value of the
minimized negative log-likelihood of the Bernoulli model forY ∈ {0,1}, n∈L.
• The Gini index: p0Lp1L. It can be interpreted as the Mean Squared Error (M SE) when fitting the mean,p1L, to the Bernoulli variable Y ∈ {0,1}, n∈L: M SEL= EL(Y −p1L)2 =p0Lp1L.
These impurity criteria for buckets are conventionally blended into compromise criteria for splits by forming weighted sums of the left and right buckets. Denoting with pL+pR = 1 the marginal
probabilities of the left and the right bucket given the mother bucket, the compromise takes this form:
misclassification rate : pL min(p0L, p1L) + pRmin(p0R, p1R)
entropy : pL(−p0L logp0L − p1L logp1L) +pR(−p0R logpR0 − p1R logp1R)
Gini index : pLp0Lp1L + pRp0Rp1R
These impurity functions are the smaller the stronger the majority of either label is. Misclassifica-tion rate is problematic because it may lead to many indistinguishable splits, some of which may be intuitively more desirable than others. The problem is illustrated, for example, in CART (1984, p.96). One therefore uses entropy or the Gini index instead, both of which avoid the problem. CART (1984) uses the Gini index, while C4.5 (Quinlan, 1993) and S-Plus (Statsci 1995, or Ven-ables and Ripley 1997) use entropy. For two classes there does not seem to exist a clear difference in performance between entropy and the Gini index. In the multi-class case, however, Breiman (1996) has brought to light significant differences.
We now approach two-class classification the same way as regression by attempting to identify pure or extreme buckets as quickly as possible. While the criteria for regression trees are based on variances or means, the criteria for classification trees are only based on the probabilities of class 0 and 1. For one-sided purity, the goal can be restated as finding splits with just one bucket that has a clear majority label. Another approach is to select a class of interest, 1, say, and look for buckets that are very purely class 1. For example, in a medical context, one might want to quickly find buckets that show high rates of mortality, or high rates of treatment effect. As in Section 3, we introduce two criteria for splitting, corresponding to the two approaches:
• Criterion C1: One-sided purity
In order to find a single pure bucket, regardless of its class, we replace the weighted average with the minimum:
critLR = min(p0L, pL1, p0R, p1R),
which is equivalent to
because min(p0L, p1L) andp0Lp1L are monotone transformations of each other. The criteria are also equivalent to
critLR = max(p0L, p1L, p0R, p1R)
because if one of p0L, p1L is maximum, the other is minimum. This latter criterion expresses the idea of pure buckets more directly.
• Criterion C2: One-sided extremes
Having chosen class 1, say, as the class of interest, the criterion that searches for a pure class 1 bucket among Land R is
critLR = min(p0L, p0R) ,
which is equivalent to the more intuitive form
critLR = max(p1L, p1R) .
The following table shows a synopsis of the new criteria for regression and two-class classification: Regression Trees Classification Trees
One-sided purity min(ˆσ2L, σˆR2) min(p0Lp1L, p0Rp1R) One-sided extreme max(ˆµL, µˆR) max(p1L, p1R)
5
An Example of Regression Trees: The Boston Housing Data
Following CART (1984), we demonstrate the application of the new splitting criteria on the Boston Housing data. These well-known data were originally created by Harrison and Rubinfeld (1978), and they were popularized by Belsley, Kuh and Welsch (1980). Data files are available from the UC Irvine Machine Learning Repository (1998).
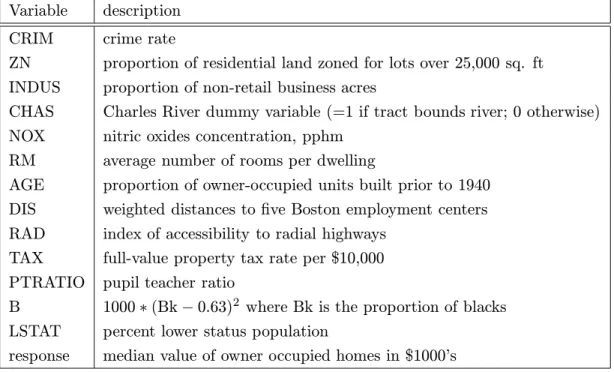
Harrison and Rubinfeld’s main interest in the data was to investigate how air pollution con-centration (NOX) affects the value of single family homes in the suburbs of Boston. Although NOX turned out to be a minor factor if any, the data have been frequently used to demonstrate new regression methods. These data are such well-treaded ground that if anything new is found in them, it should be remarkable. The data contain the median housing values as a response, and 13 predictor variables for 506 census tracts in the Boston area; see Table 1 for details.
We constructed several trees based on both CART and the new criteria. To facilitate com-parisons, all trees were generated with equal size, namely, 16 terminal nodes. A minimum bucket size of 23 was chosen, which is about 5% of the overall sample size (506). The resulting trees are displayed in Figures 3 through 6. For each node, the mean response (m) and the size (sz) is given. Here is a summary of the main features of these trees:
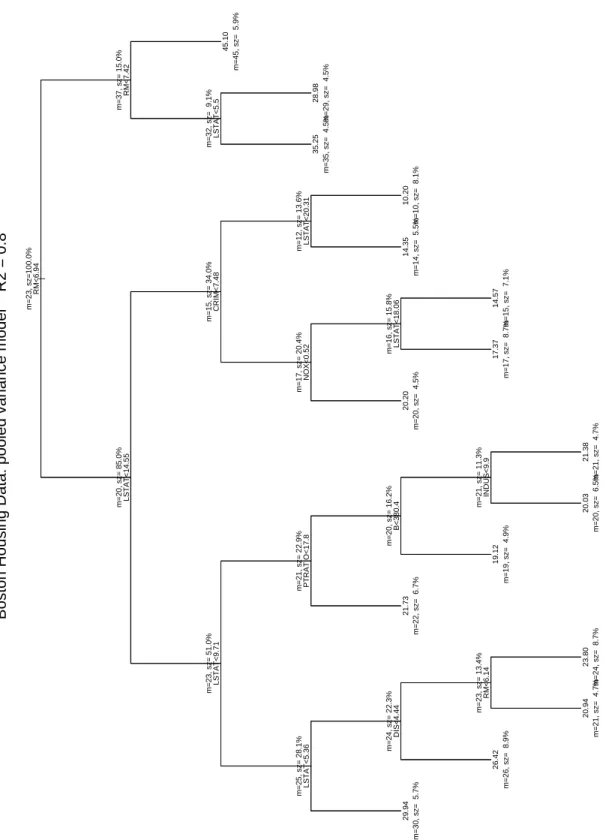
1. CART, Figure 3
Somewhat balanced tree of depth 6. The major variables are RM (3x) and above all LSTAT (6x). Minor variables appearing once each are NOX, CRIM, B, PTRATIO, DIS, INDUS, with splits mostly in the expected directions. Two of the top splits act on the size of the homes (RM), and below it, especially for areas with smaller homes, an monotone decreasing dependence on the fraction of lower status population (LSTAT) is apparent. Except for the peeling on RM at the top and the subsequent peeling on LSTAT, the tree is not simple.
Variable description CRIM crime rate
ZN proportion of residential land zoned for lots over 25,000 sq. ft INDUS proportion of non-retail business acres
CHAS Charles River dummy variable (=1 if tract bounds river; 0 otherwise) NOX nitric oxides concentration, pphm
RM average number of rooms per dwelling
AGE proportion of owner-occupied units built prior to 1940 DIS weighted distances to five Boston employment centers RAD index of accessibility to radial highways
TAX full-value property tax rate per $10,000 PTRATIO pupil teacher ratio
B 1000∗(Bk−0.63)2 where Bk is the proportion of blacks LSTAT percent lower status population
response median value of owner occupied homes in $1000’s
Table 1: Predictor Variables for the Boston Housing Data.
2. One-sided purity, Figure 4
Unbalanced tree of depth 9. The minor variable PTRATIO (1x) is allowed the first split with a small bucket of size 9%; apparently a cluster of school districts has significantly worse pupil-to-teacher ratios than the majority. Crime-infested neighborhoods are peeled off next in a small bucket of size 5% (CRIM, 1x) with extremely low mean. NOX makes surprisingly 3 appearances, which would have made Harrison and Rubinfeld happy. In the third split from the top, NOX breaks off 12% of highly polluted areas with a low bucket mean of 16, as compared to 25 for the rest. LSTAT (3x) creates next a powerful split into buckets of size 41% and 34%, with means of 30 and 19, respectively. RM (2x) plays a role only in “high-status” neighborhoods.
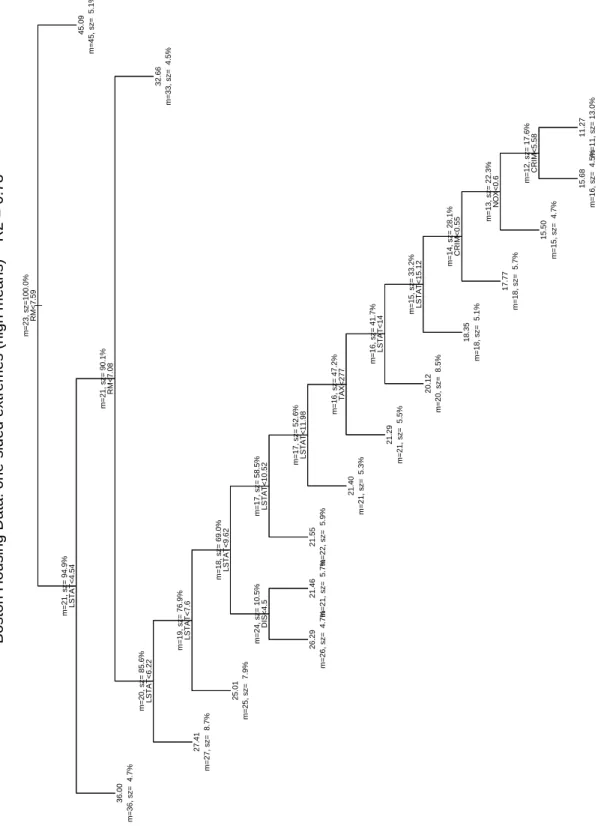
3. One-sided extremes: high mean, Figure 5
An extremely unbalanced tree. There are no single powerful splits, only peeling splits with small buckets on one side. The repeated appearance of just two variables, RM (2x, levels 1 and 3) and LSTAT (8x), however, tells a powerful story: For highest housing prices (bucket mean 45), the size of homes (RM > 7.59) is the only variable that matters. For RM <
7.08, a persistent monotone decreasing dependence on LSTAT takes over, down to a median housing value of about 17. This simple interplay between RM and LSTAT lends striking interpretability to the tree and tells a simple but convincing story. At the bottom, crime (CRIM, 2x) and pollution (NOX, 1x) show some remaining smaller effects in the expected directions.
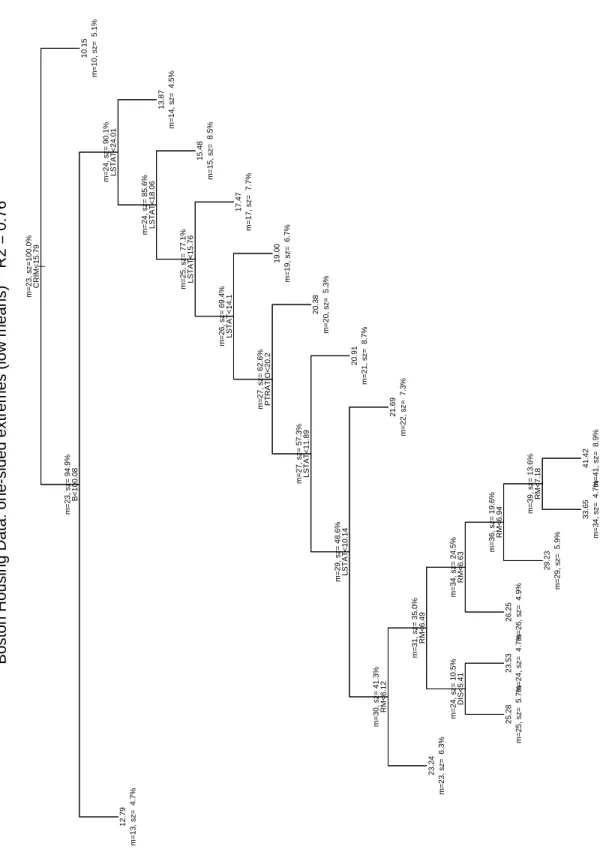
4. One-sided extremes: low mean, Figure 6
Again an extremely unbalanced tree. It tells a similar story as the previous one, but greater precision is achieved for low housing values, because this is where the criterion looks first. The first peeling split sets aside a 5% bucket of crime-infested neighborhoods with lowest
housing values around 10. The second lowest mean bucket (B <100) consists of 5% census tracts with high African-American population (63%±32%; due to an arcane transformation). Thereafter, monotone decreasing dependence on LSTAT takes over in the form of six peeling splits, followed by monotone increasing dependence on RM in the form of five peeling splits. These two successive monotone dependencies are essentially the same as in the previous tree, which found them in reverse order due to peeling from high to low housing values.
After perusing the last two trees and their crisp stories, it is worthwhile to return to the CART tree of Figure 3 and apply the lessons learnt. We see in retrospect that the CART tree tries to tell the same story of monotone dependence on LSTAT and RM, but because of its favoring of balanced splits, it is incapable of clearly layering the data: The split on LSTAT at the second level divides into buckets of size 51% and 34%, of which only the left bucket further divides on LSTAT. By comparison, the high means criterion creates at level 3 a split on LSTAT with buckets of sizes 9% and 77%, clearly indicating that the left bucket is only the first of a half dozen “tree rings” in ascending order of LSTAT and descending order of housing price.
In summary, it appears that, in spite of the highest R2 value, the CART tree is considerably
harder to interpret compared to the extreme means trees. Even the one-sided purity criterion has certain advantages for “data mining” in that it is better able to find interesting small buckets. Ironically the greater end-cut problem of the new criteria works in their favor. Conversely, CART’s end-cut problem is not sufficiently strong to allow it to clearly detect monotone dependencies and express them in terms of highly unbalanced layering trees.
After a tree-based analysis that resulted in an interpretable tree, it is plausible to re-express the tree in terms of linear models by describing monotone dependencies with linear or additive terms and localizing them with suitable dummy variables. For example, the tree generated with the low means criterion might suggest a linear model of the following form:
M ED VAL = βCRIM ∗1[CRIM >15.79]+
βB∗1[B≤100.08]∗1[CRIM≤15.79]+
βLSTAT ∗LSTAT ∗1[LSTAT >10.14]∗1[B>100.08]∗1[CRIM≤15.79]+ βRM ∗RM∗1[LSTAT≤10.14]∗1[B>100.08]∗1[CRIM≤15.79]+ERROR
This type of exercise shows the power of adaptive model building that is implicit in interpretable trees.
6
An Example of Classification Trees: Pima Indians Diabetes
We demonstrate the application of the new criteria for classification trees with the Pima Indians Diabetes data (Pima data, for short). These data were originally owned by the “National Institute of Diabetes and Digestive and Kidney Diseases,” but they are now available from the UC Irvine Machine Learning Repository (1998).
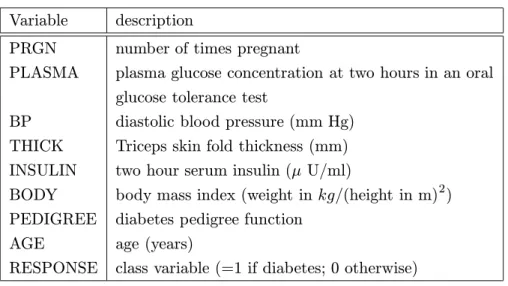
The class labels of the Pima data are 1 for diabetes and 0 otherwise. There are 8 predictor variables for 768 patients, all females, at least 21 years of age, and of Pima Indian heritage near Phoenix, AZ. Among the 768 patients, 268 tested positive for diabetes (class 1). For details see Table 2 and the documentation at the UC Irvine Repository.
We constructed four trees based on entropy and the new criteria. A minimum bucket size of 35 was imposed, amounting to about 5% of the overall sample size (768). The resulting trees are
Variable description
PRGN number of times pregnant
PLASMA plasma glucose concentration at two hours in an oral glucose tolerance test
BP diastolic blood pressure (mm Hg) THICK Triceps skin fold thickness (mm) INSULIN two hour serum insulin (µU/ml)
BODY body mass index (weight inkg/(height in m)2) PEDIGREE diabetes pedigree function
AGE age (years)
RESPONSE class variable (=1 if diabetes; 0 otherwise)
Table 2: Predictor Variables for the Pima Indians Diabetes Data.
shown in Figures 7 through 10. For each node, the proportion (p) of each class and the size (sz) are given. Here is a summary of the trees:
1. Entropy, Figure 7
Typical balanced tree of depth 6. The strongest variable is PLASMA (5x), which creates a very successful split at the top. BODY (3x) is the next important variable, but much less so, followed by PEDIGREE (3x) and AGE (2x). The class ratios in the terminal buckets range from 1.00:0.00 on the left to 0.16:0.84 on the right. All splits are in the expected direction. Overall, the tree is plausible but does not have a simple interpretation.
2. One-sided purity, Figure 8
Extremely unbalanced tree of depth 12. In spite of the depth of the tree, its overall structure is simple: As the tree moves to the right, layers high in class 0 (no diabetes) are being shaved off, and, conversely, as the tree steps left, layers high in class 1 (diabetes) are shaved off (with the exception of the BP split near the bottom). The top of the tree is dominated by BODY and PLASMA, while AGE and PEDIGREE play a role in the lower parts of the tree, where the large rest bucket gets harder and harder to classify.
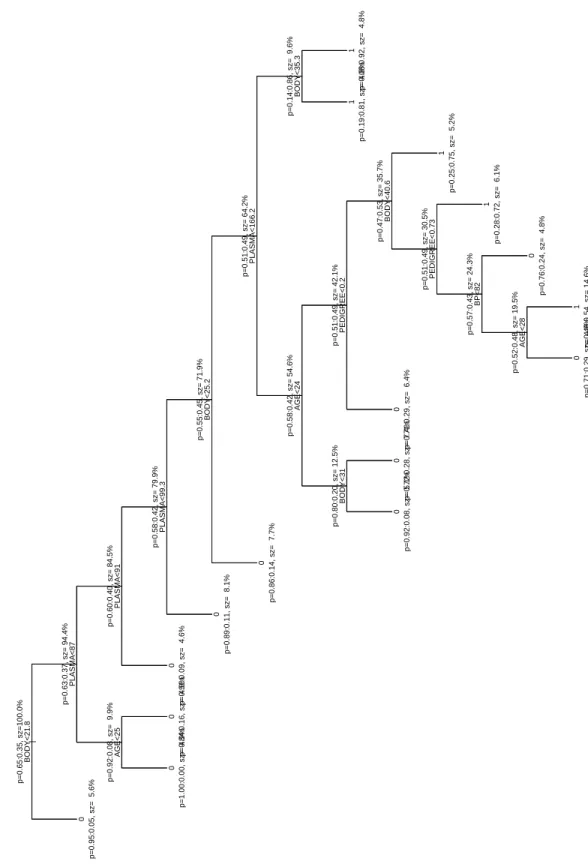
3. One-sided extremes: high class 0, Figure 9
Extremely unbalanced tree with simple structure: Because the criterion searches for layers high in class 0 (no diabetes), the tree keeps stepping to the right. In order to describe con-ditions under which class 0 is prevalent, it appears that only BODY and PLASMA matter. The tree shows a sequence of interleaved splits on these two variables, indicating a com-bined monotone dependence on them. See below for an investigation of this behavior. For interpretability, this tree is the most successful one.
4. One-sided extremes: high class 1, Figure 10
Another extremely unbalanced tree with simple structure: The criterion searches for layers high in class 1 (diabetes), which causes the tree to step to the left. The top split on PLASMA identifies a 0.86 diabetic bucket of size 9.9%. BODY refines it to 90%. This is the major story because the remaining cascade to the left works off a bucket with a fraction 0.71 non-diabetics, obviously with only mild success.
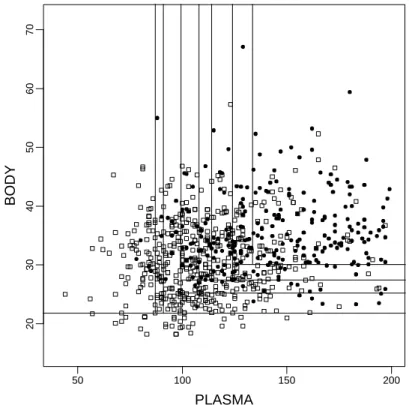
From the trees and the summary, it becomes clear that PLASMA is the most powerful predictor, followed by BODY. In particular the third tree is almost completely dominated by these two variables. Their interleaved appearance down this tree suggests a combined monotone dependence which should be studied more carefully. Figure 2 shows how the third tree in Figure 9 tries to approximate the class probability surface with a step function on axes-aligned rectangular tiles.
50 100 150 200 20 30 40 50 60 70 PLASMA BODY
Figure 2: The Pima Diabetes Data, BODY against PLASMA. The plain is tiled according to the buckets of the tree in Figure 9. Open squares: no diabetes (class 0), filled circles: diabetes (class 1).
7
Summary
The following are a few conclusions from our experiments:
• Hyper-greedy data mining criteria can produce highly interpretable trees.
• Highly unbalanced trees can reveal monotone dependence.
• The end-cut “problem” can turn into a virtue.
• If trees are grown for interpretation, global measures for quality of fit are not very informative. The following are a few topics that merit further research:
• Develop quality measures for interpretability and simplicity of trees.
• Extend the new 2-class criteria to more than two classes.
References
[1] Belsley, D. A., Kuh, E., and Welsch, R. E. (1980), Regression Diagnostics, New York, NY: John Wiley & Sons, Inc..
[2] Breiman, L. (1996), ”Technical Note: Some Properties of Splitting Criteria,” Machine Learn-ing, 24, 41-47.
[3] Breiman, L., Friedman, J. H., Olshen, R. A., and Stone, C. J. (1984), Classification and Regression Trees(CART), Pacific Grove, CA: Wadsworth.
[4] Harrison, R. J., and Rubinfeld, D. L. (1978), ”Hedonic Prices and the Demand for Clean Air,”
Journal of Environmental Economics and Management, 5, 81-102.
[5] Merz, C. J., and Murphy, P. M. (1998), UCI repository of machine learning data bases (http://www.ics.uci.edu/˜mlearn/MLRepository.html).
[6] Quinlan, J. R. (1993), C4.5: Programs for Machine Learning, San Mateo, CA: Morgan Kauf-mann.
[7] Ripley, B. D. (1996), Pattern Recognition and Neural Networks, Cambridge: Cambridge Uni-versity Press.
[8] StatSci (1995), S-PLUS Guide to Statistical and Mathematical Analysis, Version 3.3, Seattle: MathSoft, Inc.
[9] Venables, W. N., and Ripley, B. D. (1997), Modern Applied Statistics with S-Plus, New York, NY: Springer-Verlag.
| RM<6.94 LSTAT<14.55 LSTAT<9.71 LSTAT<5.36 DIS<4.44 RM<6.14 PTRATIO<17.8 B<380.4 INDUS<9.9 CRIM<7.48 NOX<0.52 LSTAT<18.06 LSTAT<20.31 RM<7.42 LSTAT<5.5 29.94 26.42 20.94 23.80 21.73 19.12 20.03 21.38 20.20 17.37 14.57 14.35 10.20 35.25 28.98 45.10 m=30, sz= 5.7% m=26, sz= 8.9% m=21, sz= 4.7% m=24, sz= 8.7% m=22, sz= 6.7% m=19, sz= 4.9% m=20, sz= 6.5% m=21, sz= 4.7% m=20, sz= 4.5% m=17, sz= 8.7% m=15, sz= 7.1% m=14, sz= 5.5% m=10, sz= 8.1% m=35, sz= 4.5% m=29, sz= 4.5% m=45, sz= 5.9% m=23, sz=100.0% m=20, sz= 85.0% m=23, sz= 51.0% m=25, sz= 28.1% m=24, sz= 22.3% m=23, sz= 13.4% m=21, sz= 22.9% m=20, sz= 16.2% m=21, sz= 11.3% m=15, sz= 34.0% m=17, sz= 20.4% m=16, sz= 15.8% m=12, sz= 13.6% m=37, sz= 15.0% m=32, sz= 9.1%
Boston Housing Data: pooled variance model R2 = 0.8
| PTRATIO<20.9 CRIM<16.81 NOX<0.7 LSTAT<10.15 DIS<7.31 RM<7.46 RM<7.07 AGE<22.1 ZN<20 NOX<0.46 NOX<0.52 DIS<2.75 DIS<2.24 LSTAT<19.78 LSTAT<16 26.32 26.74 26.21 34.36 46.08 26.36 19.27 21.61 18.95 11.32 20.10 20.44 19.69 13.93 10.33 17.39 m=26, sz= 5.1% m=27, sz= 14.6% m=26, sz= 5.3% m=34, sz= 4.5% m=46, sz= 5.3% m=26, sz= 6.1% m=19, sz= 5.1% m=22, sz= 6.1% m=19, sz= 5.5% m=11, sz= 5.3% m=20, sz= 4.7% m=20, sz= 6.7% m=20, sz= 4.7% m=14, sz= 7.1% m=10, sz= 4.5% m=17, sz= 8.9% m=23, sz=100.0% m=23, sz= 91.1% m=24, sz= 86.6% m=25, sz= 74.7% m=30, sz= 41.1% m=31, sz= 35.0% m=28, sz= 29.6% m=27, sz= 25.1% m=27, sz= 20.0% m=19, sz= 33.6% m=19, sz= 28.5% m=18, sz= 22.3% m=17, sz= 15.6% m=15, sz= 10.9% m=16, sz= 11.9%
Boston Housing Data: raw one-sided purity R2 = 0.75
| RM<7.59 LSTAT<4.54 RM<7.08 LSTAT<6.22 LSTAT<7.6 LSTAT<9.62 DIS<4.5 LSTAT<10.52 LSTAT<11.98 TAX<277 LSTAT<14 LSTAT<15.12 CRIM<0.55 NOX<0.6 CRIM<5.58 36.00 27.41 25.01 26.29 21.46 21.55 21.40 21.29 20.12 18.35 17.77 15.50 15.68 11.27 32.66 45.09 m=36, sz= 4.7% m=27, sz= 8.7% m=25, sz= 7.9% m=26, sz= 4.7% m=21, sz= 5.7% m=22, sz= 5.9% m=21, sz= 5.3% m=21, sz= 5.5% m=20, sz= 8.5% m=18, sz= 5.1% m=18, sz= 5.7% m=15, sz= 4.7% m=16, sz= 4.5% m=11, sz= 13.0% m=33, sz= 4.5% m=45, sz= 5.1% m=23, sz=100.0% m=21, sz= 94.9% m=21, sz= 90.1% m=20, sz= 85.6% m=19, sz= 76.9% m=18, sz= 69.0% m=24, sz= 10.5% m=17, sz= 58.5% m=17, sz= 52.6% m=16, sz= 47.2% m=16, sz= 41.7% m=15, sz= 33.2% m=14, sz= 28.1% m=13, sz= 22.3% m=12, sz= 17.6%
Boston Housing Data: one-sided extremes (high means) R2 = 0.78
| CRIM<15.79 B<100.08 LSTAT<24.01 LSTAT<18.06 LSTAT<15.76 LSTAT<14.1 PTRATIO<20.2 LSTAT<11.89 LSTAT<10.14 RM<6.12 RM<6.49 DIS<5.41 RM<6.63 RM<6.94 RM<7.18 12.79 23.24 25.28 23.53 26.25 29.23 33.65 41.42 21.69 20.91 20.38 19.00 17.47 15.48 13.87 10.15 m=13, sz= 4.7% m=23, sz= 6.3% m=25, sz= 5.7% m=24, sz= 4.7% m=26, sz= 4.9% m=29, sz= 5.9% m=34, sz= 4.7% m=41, sz= 8.9% m=22, sz= 7.3% m=21, sz= 8.7% m=20, sz= 5.3% m=19, sz= 6.7% m=17, sz= 7.7% m=15, sz= 8.5% m=14, sz= 4.5% m=10, sz= 5.1% m=23, sz=100.0% m=23, sz= 94.9% m=24, sz= 90.1% m=24, sz= 85.6% m=25, sz= 77.1% m=26, sz= 69.4% m=27, sz= 62.6% m=27, sz= 57.3% m=29, sz= 48.6% m=30, sz= 41.3% m=31, sz= 35.0% m=24, sz= 10.5% m=34, sz= 24.5% m=36, sz= 19.6% m=39, sz= 13.6%
Boston Housing Data: one-sided extremes (low means) R2 = 0.76
| PLASMA<129 AGE<28 BODY<30.96 PLASMA<105.1 PEDIGREE<0.5 PEDIGREE<0.26 BODY<26.72 PEDIGREE<0.56 PLASMA<111.6 PLASMA<99 BODY<29.7 PLASMA<158.05 AGE<30 INSULIN<0 0 0 0 0 0 0 0 0 0 1 0 0 1 1 1 p=1.00:0.00, sz= 13.2% p=0.93:0.07, sz= 7.0% p=0.82:0.18, sz= 4.9% p=0.92:0.08, sz= 4.9% p=0.73:0.27, sz= 6.6% p=0.93:0.07, sz= 6.0% p=0.87:0.13, sz= 5.1% p=0.70:0.30, sz= 4.8% p=0.53:0.47, sz= 6.6% p=0.36:0.64, sz= 7.2% p=0.67:0.33, sz= 8.6% p=0.53:0.47, sz= 5.9% p=0.28:0.72, sz= 7.9% p=0.08:0.92, sz= 4.8% p=0.16:0.84, sz= 6.4% p=0.65:0.35, sz=100.0% p=0.79:0.21, sz= 66.4% p=0.90:0.10, sz= 36.7% p=0.97:0.03, sz= 20.2% p=0.81:0.19, sz= 16.5% p=0.87:0.13, sz= 9.9% p=0.66:0.34, sz= 29.7% p=0.59:0.41, sz= 23.7% p=0.69:0.31, sz= 16.5% p=0.79:0.21, sz= 9.9% p=0.37:0.63, sz= 33.6% p=0.27:0.73, sz= 25.0% p=0.39:0.61, sz= 13.8% p=0.13:0.87, sz= 11.2%
Pima Data: entropy misclass. error = 0.21 (162/768)
| BODY<21.8 PLASMA<87 AGE<25 PLASMA<91 PLASMA<99.3 BODY<25.2 PLASMA<166.2 AGE<24 BODY<31 PEDIGREE<0.2 BODY<40.6 PEDIGREE<0.73 BP<82 AGE<28 BODY<35.3 0 0 0 0 0 0 0 0 0 0 1 0 1 1 1 1 p=0.95:0.05, sz= 5.6% p=1.00:0.00, sz= 4.9% p=0.84:0.16, sz= 4.9% p=0.91:0.09, sz= 4.6% p=0.89:0.11, sz= 8.1% p=0.86:0.14, sz= 7.7% p=0.92:0.08, sz= 5.1% p=0.72:0.28, sz= 7.4% p=0.71:0.29, sz= 6.4% p=0.71:0.29, sz= 4.9% p=0.46:0.54, sz= 14.6% p=0.76:0.24, sz= 4.8% p=0.28:0.72, sz= 6.1% p=0.25:0.75, sz= 5.2% p=0.19:0.81, sz= 4.8% p=0.08:0.92, sz= 4.8% p=0.65:0.35, sz=100.0% p=0.63:0.37, sz= 94.4% p=0.92:0.08, sz= 9.9% p=0.60:0.40, sz= 84.5% p=0.58:0.42, sz= 79.9% p=0.55:0.45, sz= 71.9% p=0.51:0.49, sz= 64.2% p=0.58:0.42, sz= 54.6% p=0.80:0.20, sz= 12.5% p=0.51:0.49, sz= 42.1% p=0.47:0.53, sz= 35.7% p=0.51:0.49, sz= 30.5% p=0.57:0.43, sz= 24.3% p=0.52:0.48, sz= 19.5% p=0.14:0.86, sz= 9.6%
Pima Data: one-sided purity misclass. error = 0.21 (163/768)
| BODY<21.8 PLASMA<87 AGE<25 PLASMA<91 PLASMA<99.3 BODY<25.2 BODY<27.42 PLASMA<108 PEDIGREE<0.38 PLASMA<114 PLASMA<124 THICK<28 BODY<30.1 AGE<24 PLASMA<133.6 0 0 0 0 0 0 0 0 0 0 0 0 0 0 1 1 p=0.95:0.05, sz= 5.6% p=1.00:0.00, sz= 4.9% p=0.84:0.16, sz= 4.9% p=0.91:0.09, sz= 4.6% p=0.89:0.11, sz= 8.1% p=0.86:0.14, sz= 7.7% p=0.76:0.24, sz= 6.5% p=0.81:0.19, sz= 4.7% p=0.63:0.37, sz= 4.6% p=0.65:0.35, sz= 5.6% p=0.53:0.47, sz= 4.7% p=0.71:0.29, sz= 4.6% p=0.59:0.41, sz= 5.3% p=0.50:0.50, sz= 4.9% p=0.39:0.61, sz= 4.7% p=0.23:0.77, sz= 18.6% p=0.65:0.35, sz=100.0% p=0.63:0.37, sz= 94.4% p=0.92:0.08, sz= 9.9% p=0.60:0.40, sz= 84.5% p=0.58:0.42, sz= 79.9% p=0.55:0.45, sz= 71.9% p=0.51:0.49, sz= 64.2% p=0.48:0.52, sz= 57.7% p=0.72:0.28, sz= 9.2% p=0.44:0.56, sz= 48.4% p=0.41:0.59, sz= 42.8% p=0.62:0.38, sz= 9.2% p=0.35:0.65, sz= 33.6% p=0.30:0.70, sz= 28.3% p=0.26:0.74, sz= 23.3%
Pima Data: one-sided extremes (class 0) misclass. error = 0.24 (183/768)
| PLASMA<167 PLASMA<148 PLASMA<138 PLASMA<129 PRGN<8 PRGN<6 PLASMA<122 AGE<40 BP<80 PLASMA<114 THICK<34.1 THICK<28 BODY<31.48 PEDIGREE<0.53 BODY<34.5 0 0 0 0 0 0 0 0 0 0 0 0 0 1 1 1 p=1.00:0.00, sz= 12.5% p=0.95:0.05, sz= 5.3% p=0.91:0.09, sz= 4.6% p=0.87:0.13, sz= 4.9% p=0.81:0.19, sz= 4.8% p=0.77:0.23, sz= 5.6% p=0.72:0.28, sz= 4.7% p=0.69:0.31, sz= 4.6% p=0.64:0.36, sz= 7.6% p=0.60:0.40, sz= 5.6% p=0.58:0.42, sz= 6.2% p=0.53:0.47, sz= 6.9% p=0.51:0.49, sz= 7.9% p=0.38:0.62, sz= 8.9% p=0.20:0.80, sz= 4.6% p=0.10:0.90, sz= 5.3% p=0.65:0.35, sz=100.0% p=0.71:0.29, sz= 90.1% p=0.74:0.26, sz= 81.2% p=0.77:0.23, sz= 73.3% p=0.79:0.21, sz= 66.4% p=0.81:0.19, sz= 60.2% p=0.84:0.16, sz= 54.6% p=0.87:0.13, sz= 47.0% p=0.89:0.11, sz= 42.4% p=0.91:0.09, sz= 37.8% p=0.93:0.07, sz= 32.2% p=0.95:0.05, sz= 27.3% p=0.97:0.03, sz= 22.4% p=0.99:0.01, sz= 17.8% p=0.14:0.86, sz= 9.9%
Pima Data: one-sided extremes (class 1) misclass. error = 0.26 (198/768)