This is an author produced version of
Iterative Information Granulation for Novelty
Detection in Complex Datasets
.
White Rose Research Online URL for this paper:
http://eprints.whiterose.ac.uk/116415/
Proceedings Paper:
Rubio-Solis, A. and Panoutsos, G. (2016) Iterative Information Granulation for Novelty
Detection in Complex Datasets. In: 2016 IEEE International Conference on Fuzzy Systems
(FUZZ-IEEE). 2016 IEEE World Congress on Computational Intelligence,
24/07/2016-29/07/2016, Vancouver, Canada. Institute of Electrical and Electronics
Engineers . ISBN 978-1-5090-0626-7
https://doi.org/10.1109/FUZZ-IEEE.2016.7737791
© 2016 IEEE. Personal use of this material is permitted. Permission from IEEE must be
obtained for all other users, including reprinting/ republishing this material for advertising or
promotional purposes, creating new collective works for resale or redistribution to servers
or lists, or reuse of any copyrighted components of this work in other works. Reproduced
in accordance with the publisher's self-archiving policy.
promoting access to
White Rose research papers
[email protected] http://eprints.whiterose.ac.uk/
Iterative Information Granulation for Novelty
Detection in Complex Datasets
Adrian Rubio-Solis, George Panoutsos
Automatic Control and Systems Engineering DepartmentThe University of Sheffield, UK
Email: [a.rubiosolis,g.panoutsos]@sheffield.ac.uk
Abstract—Recognition memory in a number of mammals is
usually utilised to identify novel objects that violate model predictions. In humans in particular, the recognition of novel objects is foremost associated to their ability to group objects that are highly compatible/similar. Granular computing not only mimics the human cognition to draw objects together but also mimics the ability to capture associated properties by similarity, proximity or functionality. In this paper, an iterative information granulation approach is presented, for the problem of novelty detection in complex data. Two granular compatibility measures are used, based on principles of Granular Computing, namely the multidimensional distance between the granules, as well as the granular density and volume. A two-stage iterative information granulation is proposed in this work. In the first stage, a prede-fined number of granular detectors are constructed. The granular detectors capture the relationships (rules) between the input-output data and then use this information in a second granulation stage in order to discriminate new samples as novel. The proposed iterative information granulation approach for novelty detection is then applied to three different benchmark problems in pattern recognition demonstrating very good performance.
Index terms— Iterative information granulation, granular detec-tors, compatibility criterion, information granules, novelty detection.
I. INTRODUCTION
In biological systems and in the majority of mammals, detection of novel events usually requires a memory system, which allow them to store representations of the environment to make future predictions [1]. According to [1], the concept of novelty detection in humans encompasses a diversity of phenomena ranging from stimulus novelty to associative and contextual novelty. Moreover, the novelty discrimination sys-tem in humans mostly relies on the process of recall and a number of comparator mechanisms in the hippocampus whereby an entire stored pattern is retrieved in response to a partial novel input. This ability is frequently associated to the human cognition system to categorise/group objects according to their compatibility/similarity hence use this in-formation as a comparator memory system to identify novel objects or patterns that violate abstract properties. As such, in computational intelligence, granular computing has emerged as a computational paradigm that mimics this human ability to abstract the compatibility between two or more entities in terms of specific characteristics such as functionality, prox-imity, volume, density, etc [2]. Moreover, granulation plays a crucial role in human cognition itself [3]. Granulation has been the motto for data compression as a result of the confluence of
two streams, i.e. a) Fuzzy Logic and b) test-score semantics [2]. In other words, the theoretical structure of granulation involves integration of parts into a whole where granules are drawn together by specific canonical forms usually viewed as fuzzy constraints that lead to a conclusion expressed in natural language [2]. Within this context, several efforts have been devoted to data compression algorithms based on granulation that are able not only to group compatible data but also to capture relationships-rules within information [3-9]. For instance, in [2] the authors developed a granulation mechanism that captures data relationships in the form of information granules (hyperboxes), while also emphasising process transparency. In addition, the compatibility criterion introduced in [10] favours the creation of highly dense and compact information granules. In [6], a compatibility measure based on proximity was employed to construct a number of fuzzy logic rules which were used as the initial parameters of a Radial-Basis-Function Neural Network viewed as an Interval Type-II. The fuzzy rules were then optimised by applying an adaptive gradient descent approach. For instance, in [10] a hierarchical granular clustering algorithm was developed as a mechanism that is able to capture the overall architecture of the information granules as a hierarchy using granular interval fuzzy sets. This method aims to address cases where the datasets are not well defined (high uncertainty).
In this paper, we develop a iterative information granulation approach that mimics the human ability to discriminate novel information based on the granular nature of the data. Such an approach involves a two-stage iterative process that first granulates a sample data set and then builds a predefined number of granules which we call granular detectors (can be considered as information prototypes). The detectors serve as a local comparator mechanism that describe the granular archi-tecture of the data in order to discriminate novel information as new or unknown in the second stage. We use three different benchmarking examples in order to test the efficiency of the proposed approach. The examples include the 1) classification of the Iris data set, 2) colour segmentation of two multi-class and a two-multi-class images, and 3) the diabetic retinopathy Debrecen data Set. The simulation results show a very good overall performance when identifying the new datasets.
The rest of this paper is organised as follows: section II briefly revisits the basic theory of data granulation and describes the notation utilised throughout this paper. Section
III, a fuzzy membership that is used to improve the classif-cation properties of the granulation process is suggested. A detailed description of the proposed approach is provided in section IV and a number of simulations are carried out in section V in order to study the performance of the proposed algorithm. Finally, section V concludes the paper and provides recommendations for future research work.
II. PRELIMINARIES
We begin with a descritpion of a special case where X ⊂
Rn. It is possible to represent a data set that we call the sample
data setXS ⊂Xwhich is used to extract granular information
and will also be used to detect new and unknown data. The novel data set is denoted asXnd⊂X. Therefore, the notation
that will be used in this paper is:
xi : ith n-dimensional input vector in the sample data
set, i= 1, . . . , N wherexi={xsi} ands= 1, . . . , n
xk : kth n-dimensional input vector in the novel data
set, k= 1, . . . , M, where xk ={xsk} ands= 1, . . . , n
We use the sample data set as a representative set in order to generate a number of granules that we call granular detectors. Such detectors result from a process of iterative information granulation and then used to identify novel data.
A. Iterative information granulation
Iterative information granulation is a clustering technique [2] used to cluster similar input entities according to their geometrical and statistical properties. The final granules may be viewed as fuzzy constraints that can enhance the in-terpretability of systems. To achieve information grouping, Iterative information granulation uses a criterion measure that calculates a compatibility index based on granular similarity. In essence, granulation is an iterative process, which consists of two main steps.
• Find the two most ’compatible’ information granules A and B and merge them together as a new information granule containing both original granules.
• Repeat the process of finding the two most compatible granules until a satisfactory data abstraction level is achieved.
This process is repeated′t′ times until a predefined number ′m′ of granules is achieved. The compatibility between any two granulesAandBis denoted ascompat(A, B)which de-fines how good a merging operation of two different granules is [5], [4]:
compat(A, B) =distanceM AX−dA,Be(−α∗dT) (1)
such as
dT =
CA,B/CardinalityM AX
LA,B/LengthM AX
(2) where CardinalityM AX and LengthM AX is the maximum
possible cardinality and length of a granule in the input data set respectively. CA,B and LA,B is the resulting cardinality
and length generated by merging any two granules AandB.
B. Compatibility index based on Granular volume and density In this section we define an extended compatibility measure that is based on the compatibility criterion introduced in [2] and then generalised in [5]. The rationale behind the proposed measure is to create granules that are highly densed and compact resulting in more distinguishable fuzzy constraints which will serve as granular prototypes for the discrimination of novel data. Thus, the compatibility can be stated as:
compat(A, B) =volumeM AX −dA,Be(−α∗densityA,B) (3)
The local granular density between a granuleAandB can be stated as:
densityA,B=
cardA,B/CardinalityM AX
volumeM AX/volumeA,B
(4) and dA,B= 1 n n X s=1 ws∗LsA,B (5) where:Ls
A,B= (max(uAs, uBs)−min(lAs, lBs))
volumeA,B= n Y s=1 ∆s∗LsA,B (6) and volumeM AX = n Y s=1 ∆s∗LsM AX (7) whereLs
M AX is the maximum possible length in the
dimen-sionsof the input space.volumeM AX andvolumeA,Bare the
maximum possible volume and the volume of each resulting granule (A, B) in the data set respectively. Note that if any side of a granule is zero, then the volume becomes zero. In order to alleviate this problem we use a term∆sas follows.
∆s=
(
1, ifLs A,B6= 0
0<∆s≤0.01, if LsA,B= 0
ws plays the importance weight for the dimensions such as
s = 1, . . . , n and α weights the requirements between the granular density and cardinality/length. In Eq. (5), lAs and
uAsare the lower and upper limits (corners) of the granuleA
respectively.
III. HARD VERSUSFUZZY-BASEDITERATIVE GRANULATION
As it is mentioned in [7] iterative information granulation is a process that groups similar entities according to their compatibility, functionality and similarity. However there is not a measure that leads how much a granule must grow producing a grade of inclusion uncertainty among the final granules (m). This ravenous behaviour biases the granulation process to the creation of highly overlapped granules affecting the average classification performance.
As described in [2] the main purpose of iterative information granulation is the creation of a set of compact granules which contain a number of information properties that describe the
general architecture of a data set. It has also been demonstrated that iterative information granulation performance can be compared with some other techniques such as Fuzzy C-Means and k-means clustering. However, the granulation algorithm described by the Eq. (1) and (3) inherits the limitations of hard partitioning techniques to not properly discrimate the data el-ements that belongs to two or more classes (fuzzy clustering). We believe that a fuzzy version of the granulation approach might improve the classification capabilities of the iterative information granulation. For instance, in [11], a supervised learning neural network whose firing strentghs depends on the construction of a predefined number of fuzzy hyperboxes was introduced. Each hyperbox replaces the crisp decision boundaries of a perceptron neural network whose values range from 0 to 1 in each dimension by fuzzy memberships. As reported in [11] the fuzzy version of the neural network demonstrated to be more efficient to its crisp counter part. Thus, we suggest a granular membership µgi that evaluates
the fuzzines of any input vectorxiwith respect to the granule
gi ( granular detector) as follows:
µi= 1 n n X s=1 µs (8)
such as the dimensional membership µsis computed as:
µs= max xsi−l s i xavr−ls i, γ , ifls i ≤xsi < xsavr max usi−x s i us i−xsavr, γ , ifxs avr ≤xsi ≤usi (9) Where γ, µs, µgi∈[0,1]andx s avr is xs avr= 1 cardi n X s=1 xs i (10)
The parameter γ ∈ [0,1] is a sensitivity parameter that indicates how crisp is xs
i. That is, the higher the value of
γ, the more crispxs
i is. For example ifγ= 1, the granulation
approach can be viewed as a hard partition clustering of its fuzzy counterpart where 0< γ≤1.
IV. ITERATIVE INFORMATION GRANULATION FOR NOVELTY DETECTION
The proposed approach is inspired by the cognitive ability of humans to granulate similar objects/entities and then use this information to discriminate novel data as new or unknown. The rationale behind the proposed approach is to create a set of granular detectors that are highly dense and compact resulting in a set of distinguishable fuzzy constraints which will serve as granular prototypes to discriminate information as new or unknown, compared to an initial (original) dataset XS. The proposed iterative information granulation for novelty
detection is a two-stage iterative clustering approach whose main task is to extract relevant information of a sample data set XS in order to generate a number of′m′granular detectorsgi.
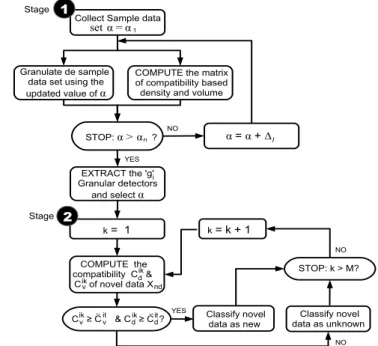
Such detectors are used as information prototypes of relevant granular information captured during the granulation process. As illustrated in Fig. 1, the first stage consists of an algorithmic
loop that granulates the sample data set m times by using a different weighting factor α, α∈[α1, αn]. This loop is also
used to determine the optimum value of α and to build the set granular detectors gi. Each granular detector is generated
using Eq. (1); Eq. (3) is used to extract the associated information that results from the granular density including the geometrical boundaries of each cluster (granule-[ls
i, usi]),
the corresponding cardinality (number of elements per cluster-cardi), the compatibility based on the local granular density
and volumeCi
v and the local compatibility based on the local
proximityCi
v. Thus, we define eachgi as a tuple of granular
information stated as follows:
gi=< lsi, usi, Cdit, Cvit, cardi >, i= 1, . . . , m (11)
where the terms Cit
d = {Cdi1, . . . , C icardi
d } and Cvit =
{Ci1
v , . . . , Cvicardi}, andcardi≤cardM AX.’i’represents the
index for the final number of granular detectors/clusters andt the iteration number.
Collect Sample data
Granulate de sample data set using the updated value of α STOP: α > ?αn α1 α = EXTRACT the 'g' Granular detectors and select α
COMPUTE the matrix of compatibility based density and volume
α = α + ∆ COMPUTE the compatibility C & C of novel data Xv d k= k+ 1 Classify novel data as new NO NO YES k= 1 i STOP: k > M? Classify novel data as unknown YES 1 2 it Stage Stage l set ik ik nd C ≥ C & C ≥ C ?v ik _v it dik _d NO
Fig. 1. Flow diagram of the proposed iterative information granulation for novelty detection.
The second stage is used as a comparator mechanism where the information that is captured by the granular detectors is used to discriminate novel data as new or unknown. Thus, a loop of Iterative information granulation is carried out. At each iteration the compatibility based on distanceCik
d and granular
density and volumeCik
v (where k= 1, . . . , cardi) of a novel
input vectorxk with respect to each granular detector gi are
computed. The most two compatible vectors gi and xk are
then selected. The input vector xk is merged or considered
as new to gi if its associated compatibility Cdik ≥ C¯dit and
Cik
v ≥ C¯vit, where C¯dit = min(Cdit) and C¯vit = min(Cvit).
In other words, C¯it
thresholds to merge novel data to the granular detectors gi
as new or deleted as unknown. Once the novel data have been classified, the granular detectors are employed as the final clusters that contain information in relation to the functionality and compability of the original data.
V. SIMULATIONRESULTS
In order to study the performance of the proposed novelty detection methodology, three different examples are used, namely: 1) classification of the Iris data set, 2) colour seg-mentation of two multi-class and a two-class images, and 3) the diabetic retinopathy Debrecen data set.
1) Iris plant classification: The Iris data set is a popular data set found in the pattern recognition community that contains three classes, namely: a) Iris setosa, b) Iris versicolour and c) Iris virginica of 50 instances each, where each class refers to a type of an iris plant. One class is linearly separable from the others and the latter are not linearly separable from each other. We perform a set of 5 simulations of 10 trials each with three granular detectors. In each experiment the Iris data set was randomly divided into two sub-sets, i.e. 1) a set that is employed as the sample data set and hence granulated during the first stagein order to create a set of granular detectorsgi.
The 2) second set which consists of the rest of the instances which are used to test the efficiency of the granular detectors gi. An increment ∆i = 0.05 was also used to identify the
fuzzy weighting factor′α′ that produces the smallest Average Missclassification of Novel points (AMN).
TABLE I
AVERAGED RESULTS OF10TRIALS FOR NOVELTY DETECTION BY USING THE IRIS DATA SET WITH3GRANULAR DETECTORSgi.
Average number of Missclassifications
% α Setosa Versicolour Virginica AM
Iterative Information Granulation Results Stage 1: Granulation of the sample data
10 0.05 0 1.7 2.2 3.9
30 0.15 0 2.8 4.1 6.9
50 0.25 0 3.4 7.4 10.8
80 0.3 0 2.1 5.0 7.1
100 0.2-0.3 0 2.0 3.0 5.0
Stage 2: Novelty detection results AMN
90 0.05 0 5.2 14.7 19.9
70 0.15 0 4.5 16.8 21.3
50 0.25 0 7.9 3.7 11.6
20 0.3 0 4.0 4.0 8.0
Classification Results
Neural Fuzzy Classification of type-1 (NFM-T1) [7] AM
50 0.3 1.0 3.0 2.0 6.0
100 0.3 1.0 2.0 0.0 3.0
Interval Type-2 RBF Neural Network (IT2-RBF-NN) [6]
50 0.3 0.0 2.0 1.0 3.0
100 0.3 0.0 0.0 0.0 0.0
Fuzzy C-Means (FCM)
100 - 1.0 7.0 8.0 16
In table I, the numerical simulation results produced by the proposed iterative granulation approach are compared to three different classification techniques, namely 1) Neural Fuzzy Model of Type-I (NFM-T1), 2) an Interval Type-2 RBF Neural Network (IT2-RBF-NN) and the well known 3) Fuzzy C-Means (FCM).
The results obtained by using the proposed methodology for novelty detection are presented in table I according to two different stages. First, at stage 1 the Average number of Missclassifications (AM) that results from the construction of the granular detectors (gi) and from the granulation of
the sample data set are presented. Secondly, At stage 2, the Average number Missclassification of Novel points (AMN) by using an input data set of different sizes is showed. The column (%) can be seen in two parts, i.e. while at the stage 1 it indicates the percentage of samples that were used to create the sample data, at the stage 2 the value (%) represents the percentage of instances that were used as testing or novel data. The middle columns (setosa, versicolour and virginica) are the average number of misclassifications per class and the same factorαis used in the first and second stage. However, the value of α was set up with a different value at each experiment. Finally, we included in the bottom section of table I the simulation results produced by three different classifiers. For the training of the NFM-T1, IT2-RBF-NN50%and100%
out of the total instances were employed. According to [6] and [7], two different phases are involved in order to estimate the final parameters of the NFM-T1 and the IT2-RBF-NN. Firstly, the initial parameters of the NFM-T1 and IT2-RBF-NN are computed by granulating the training data set (50%and
100%), and then a second step based on an adaptive gradient descent approach is employed to optimise the fuzzy inference mechanism.
As it can be seen in table I, in spite of the fact that the proposed novelty detection approach does not employ a second optmisation step, the associated classification results are comparable. Moreover, from table I, it is also clear that the proposed methodology for novelty detection overcomes its counterpart the Fuzzy C-Means particularly when the percentage of data used to construct the granular detectors is equal or larger than50%.
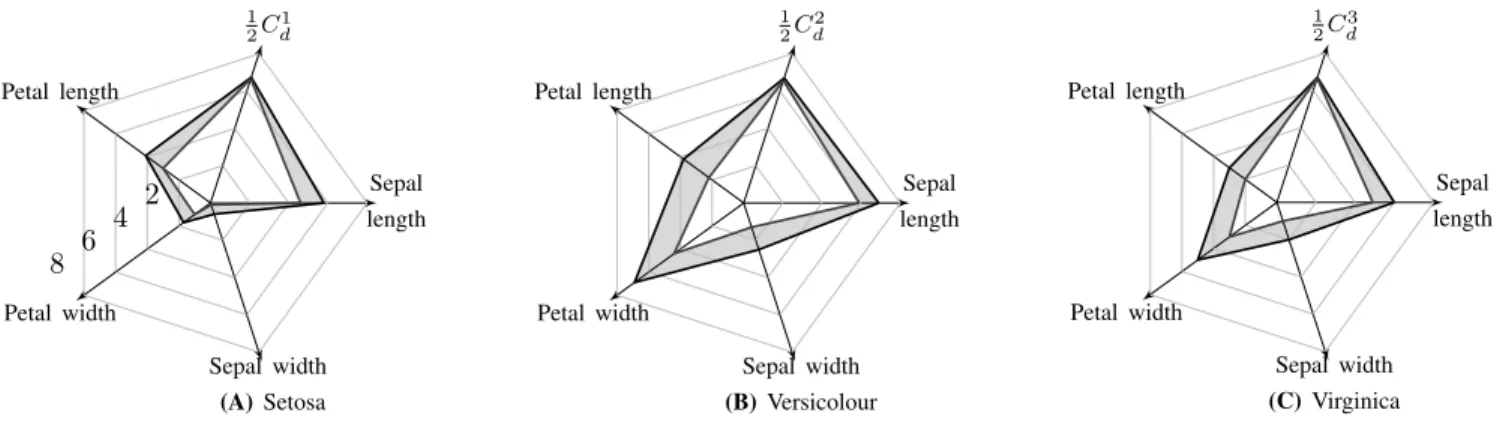
In Fig. 2, radar plots are used to depict the granular detectors with solid line produced by the granulation approach that is performed in the first stage. As mentioned in [10], it becomes apparent that (interval-valued) detectors (prototypes) deliver a better representation of the discovered structure than their numeric counterparts. It is also evident that the granular detector for the Iris Setosa (linear class) is characterised by a broad range of values in the Petal length and Sepal length features, while the versicolour and virginica classes are more characterised by the Petal width and Petal length features (dimensions). The lowest value of Ci
v and Cdi are used as
classification thresholds in the second stage to discriminate novel data as new or unknown. Furthermore, the behaviour of the compatibility Ci
d andCvi vs cardinality exhibits a similar
Sepal length 1 2C 1 d Petal length Petal width Sepal width (A)Setosa 2 4 6 8 Sepal length 1 2C 2 d Petal length Petal width Sepal width (B)Versicolour Sepal length 1 2C 3 d Petal length Petal width Sepal width (C)Virginica
Fig. 2. Granular prototypes used as detectors for the classification of the IRIS data set.
0 10 20 30 86 88 90 92 94 96 Granular Cardinality Compatibility C v it (cm 3) (A) 0 10 20 30 12 12.5 13 13.5 Granular Cardinality Compatibility C d it (cm) (B) C v 1t Cv2t C v 3t C d 1t Cd2t C d 3t
Fig. 3. Behaviour of the compatibility ofCit v andC
it d.
That means the density and the volume of each detector decrease when the granulation is not able to find highly com-patible data. For this reason we suggest to use the minimum of the compatibility Ci
v and Cdi as comparator thresholds to
classify novel data. In Fig. 3, the individual behaviour of the compatibility measures based on the distance Ci
v (Fig. 3.A)
and the granular density and volume Ci
d (where i = 1,2,3,
Fig. 3.B) are illustrated. A. Color Image Segmentation
Colour segmentation is a process of grouping an image into units that are homogeneous with respect to one or more char-acteristics/regions of colour [12]. Segmentation of an image may also viewed as an image classification problem based on colour and spatial features. Several research works have used unsupervised techniques such adaptive thresholding, k-means clustering, Fuzzy C-Means, principal components transform, split and merge and multiresolution segmentation. Usually in supervised techniques such as neural networks the classified pixels are employed to generate a number of prototypes which are optimised by the application of learning strategies. In this example, we use two multiclass images (Fig. 4(A) fruits and 4(B) chillies) and a two-class image (Fig. 4(C) tree) to futher test the performance of the proposed methodology with a factor α = 0.1. According to the proposed methodology, a
sample data set of pixels is initially extracted of each image (see Fig. 4) that is then converted from RGB color space to L∗a∗b color space [13]. Consequently, a predefined number of granular detectors are obtained from granulating the sample data set (stage 1). Such detectors are finally employed in a second stage in order to segment the entire images (stage 2). Particularly in this problem, we use the granular detectors not only to cluster data but also to identify novelt data.
We compared our results against the segmentation obtained by the application of the k-means algorithm (Fig. 4, second column) where the number of detectors ′m′ was empirically determined. According to our simulation results (Fig. 4, third column), the iterative information granulation approach pro-posed in [2] and [5] can not be applied directly since the associated computational cost results highly expensive. For this reason, we believe the application of the proposed novelty detection represents an attractive computational technique for colour image segmentation. As can be seen from Fig. 4, a small sample data set that is extracted from each image is required to produce comparable results to those obtained by applying the k-means algorithm. However, a limitation of the proposed approach is that the granular detectors are able to capture only the associated properties contained in the sample data set. Therefore, unknown data are clustered to that detector with the lowest compatibility. For example, in Fig. 4.A those regions in red colour would be grouped with the regions in light yellow. This is due to the similarity of the granular volume and density in both regions. For example, the colour segmentation of the image chillies (third column of Fig. 4(B)), it is clear that the proposed approach was able to better identify the dark areas (blue regions) compared to k-means which is only based on distance metrics. We also found that in the range
0.01≤α≤0.15similar colour segmentation results by using the proposed iterative granulation can be produced.
B. Diabetic Retinopathy Debrecen (DRD) Data Set.
The last example is a data set that contains features extracted from the Messidor Image set used to predict whether an image contains signs of diabetic retinopathy (DR) or not [14].
(A) (B) (C) S a m p le d a ta s e t
k-means clustering Data granulation approach for novelty detection
m = 5 m= 5
m = 5 m = 5
m = 2 m = 2
Fig. 4. Test images. (A)-(B) Multi-class images: (A) fruits and (B) chillies. (C) two-class tree image.
Diabetic retinophaty (DR) is a type of disease that results from diabetes mellitus affecting the retina. The key to success-fully recognise the DR is the detection of microaneurysms (MAs) on the retina. The DRD data set consists of 1151 twenty-feature vectors that represent either a detected lesion, a descriptive feature of a anatomical part or an image-level descriptor. The following list describes the attribute informa-tion:
1 The binary result result of quality assessment. 0 = bad quality 1 = sufficient quality
2 The binary result of pre-screening, where 1 indicates severe retinal abnormality and 0 lack of abnormality.
3-8 The results of MA detection. Each feature value stand for the number of MAs found at the confidence levels alpha
= 0.5, . . . ,1, respectively.
9-16 contain the same information as features 3-8) for ex-udates. However, as exudates are represented by a set of points rather than the number of pixels constructing the lesions, these features are normalized by dividing the number of lesions with the diameter of the ROI to compensate different image sizes.
17 The Euclidean distance of the center of the macula and the center of the optic disc to provide important information regarding the patients condition. This feature is also normalized with the diameter of the ROI.
18 The diameter of the optic disc.
19 The binary result of the classification that is based on the Amplitud-Modulation Frequency-Modulation (AM/FM).
CL Class label. 1 = contains signs of DR, 0 =no signs of DR.
In this case study, we evaluate the efficiency of both hard and fuzzy-based iterative granulation for novelty detection, as described in section III. To gain a more detailed insight of the proposed study, in this section we perform two different types of experiments of 10 random trials. In the first experiment the entire input data set is used to evaluate the performance of the fuzzy version of the iterative information granulation. For the ease of comparison with existing techniques, in table II the simulation results produced by the proposed fuzzy version are presented. The columns ’NO DR’ and ’DR’ show the average number of missclassification per attribute/dimension of each experiment. The last column indicates the Average Classification Performance (ACP) which is the average number of missclassifications overall.
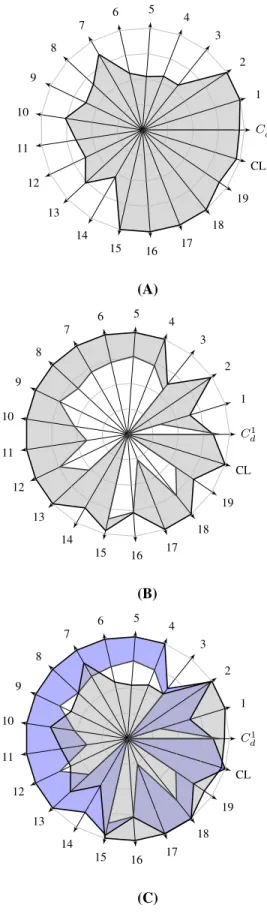
As expected, the results illustrated in table II confirm that the evaluation of a fuzzy membership during the process of granulation enhanced its classification properties. It is also interesting to note that the associated behaviour of the FCM is limited compared to k-means. We believe that the hard version of granulation (iterative information granulation) outperformed the k-means and particularly small values in the factorαmake the iterative information granulation similar to algorithms based on distance metrics and favour the creation of small granules that are high density. In order to illustrate the final shape of the granular detectors produced in the first experi-ment, in Fig. 5.A and 5.B we use radar plots. Note that the shaded area represents the lower and upper limits ofgi, where
it is also included the final compatibility Ci
d. Particularly in
Fig. 5.C the final overlapping among the granular detectors is shown. As described above, a significant overlapping is usually exhibited which might result in a deterioration of the final classification.
The second set of experiments consists of the application of the proposed fuzzy-based iterative information granulation for novelty detection. In a like manner to the previous examples, we divide the DRD data set into two sets, namely a) a sample data set and b) the novel data set. In table III, the first column (%) represents the percentage of instances extracted from the entire data set that was used to create the final granular detectors (gi). For the case of fuzzy granulation, it
was found that the best value for γ = 0.2. However, the classification results were significantly different compared to using a granular membership.
TABLE II
AVERAGED CLASSIFICATION RESULTS OF10TRIALS BY USINGFCM,
K-MEANS ANDITERATIVE INFORMATION GRANULATION FOR THEDRD
DATA SET. Average missclassification Approach α m NO DR DR ACP FCM - 2 304.7 18.1 161.4 k-means - 2 92.7 38.8 65.7 Hard Granulation 0.012 2 52.0 26.0 39.0 Fuzzy Granulation 0.012 2 20.0 19.0 18.0 C1 d 1 2 3 4 5 6 7 8 9 10 11 12 13 14 15 16 17 18 19 CL (A) C1 d 1 2 3 4 5 6 7 8 9 10 11 12 13 14 15 16 17 18 19 CL (B) C1 d 1 2 3 4 5 6 7 8 9 10 11 12 13 14 15 16 17 18 19 CL (C)
Fig. 5. Granular detectors normalised in the range[0−1]: (A) NO signs of
DR, (B) Signs of DR and (C) Overlapping area of the final detectors.
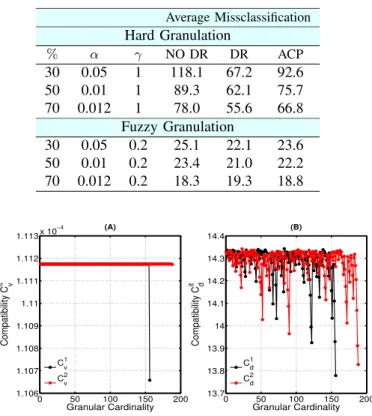
Consequently, in Fig. 6, the behaviour of the compatibility index based on the granular density and volume (Fig. 6.A)
and on the granular distance (Fig. 6.B) for a sample data set of 30%are illustrated. Similar to the simulation results in the first experiment, from Fig. 6 it is clear that small values of the factor α favours the creation of highly densed granular detectors (small values of Cit
v) that depends more on the
distance (Cit
d). In other words, as described in [5], the termα
plays the role of a compatibility weight while the term γ is used to define the fuzziness of the input data in each granule that we call granular universe of discourse.
TABLE III
AVERAGEDMISSCLASSIFICATION RESULTS OF10TRIALS USING2
GRANULAR DETECTORS. Average Missclassification Hard Granulation % α γ NO DR DR ACP 30 0.05 1 118.1 67.2 92.6 50 0.01 1 89.3 62.1 75.7 70 0.012 1 78.0 55.6 66.8 Fuzzy Granulation 30 0.05 0.2 25.1 22.1 23.6 50 0.01 0.2 23.4 21.0 22.2 70 0.012 0.2 18.3 19.3 18.8 0 50 100 150 200 1.106 1.107 1.108 1.109 1.11 1.111 1.112 1.113x 10 −4 Granular Cardinality Compatibility C v it (A) 0 50 100 150 200 13.7 13.8 13.9 14 14.1 14.2 14.3 14.4 Granular Cardinality Compatibility C d it (B) C v 1 C v 2 Cd1 C d 2
Fig. 6. Behaviour of the compatibilityCit v andC
it d.
VI. SUMMARY ANDFUTURE WORK
In this research paper a novelty detection approach is proposed, based on iterative information granulation. This is achieved by creating a systematic algorithmic process that first granulates a sample data set capturing the associated structure (relationships/rules) of the data in terms of granular information. Subsequently, this information is used in a follow-up algorithmic process in order to identify new or unknown data (novelty detection). The second stage plays the role of a comparator mechanism based on a number of granular and threshold measures such as cardinality, granular volume and density, proximity and the corresponding granular compatibil-ity generated by this information. The granular ”detectors”
(or information prototypes) are considered as a ”f ootprint”
of the process of granulation where important relationships are recorded as granular information.
In order to test the performance of the proposed approach we employ three different benchmark case studies, including categorical information/data, colour image segmentation, and biomedical classification problem. Furthermore, by introduc-ing a granular membership function, the granulation approach has the ability to find reasonable decision boundaries in overlapping classes.
Since the introduction of granulation as a clustering ap-proach, there are still some analytical issues to be addressed. For example, the uncertainty generated by the overlapping phenomenon which may hind the classification performance of iterative information granulation.
ACKNOWLEDGMENT
The authors would like to acknowledge InnovateUK for the financial support, under grant agreement 101947, SPEEAK-PC, as well the EU H2020 programme under grant agreement 636902, project: COMBILASER.
REFERENCES
[1] H. Tiitinen, et al.Attentive novelty detection in humans is governed by pre-attentive sensory memory, pp. 90-92, 1994.
[2] W. Pedrycz, and A. Bargiela.Granular clustering: a granular signature of data, Systems, Man, and Cybernetics, Part B: Cybernetics, IEEE Transactions on 32.2 (2002): 212-224.
[3] D. Kumaran and E.A. MaguireWhich computational mechanisms operate in the hippocampus during novelty detection?, Hippocampus 17.9 (2007): 735-748.
[4] A.R.-Solis, and G. Panoutsos. Fuzzy uncertainty assessment in RBF Neural Networks using neutrosophic sets for multiclass classification, Fuzzy Systems (FUZZ-IEEE), IEEE International Conference on, Beijing 2014, 1591-1598.
[5] G. Panoutsos, and M. Mahfouf. A neural-fuzzy modelling framework based on granular computing: Concepts and applications, Fuzzy Sets and Systems 161.21 (2010): 2808-2830.
[6] A. Rubio-Solis, and G. Panoutsos.Interval Type-2 Radial Basis Function Neural Network: A Modeling Framework, Fuzzy Systems, IEEE Trans-actions on 23.2 (2015): 457-473.
[7] A. Rubio-Solis, and G. Panoutsos. Granular computing neural-fuzzy modelling: A neutrosophic approach, Applied Soft Computing, 13.9 (2013): 4010-4021.
[8] A. Rubio-Solis, S. Thornton and G. Panoutsos. Data-Driven Fuzzy Modelling Framework for Classification of Imbalanced Data, IEEE In-ternational Conference ”Intelligent Systems”, Sofia, Bulgaria, September 2016, in press.
[9] L.A. Zadeh,Fuzzy logic= computing with words, Fuzzy Systems, IEEE Transactions on, 4(2), pp. 103-111, 1996.
[10] W. Pedrycz, et al.Hierarchical Granular Clustering: An Emergence of Information Granules of Higher Type and Higher Order, Fuzzy Systems, IEEE Transactions on, 23(6), pp. 2270-2283, 2015.
[11] P.K. Simpson. Fuzzy min-max neural networks part 1: Classification, IEEE Transactions on Neural Networks, 3.5 (1992): 776 786.
[12] Y.W. Lim and S.U. Lee.On the color image segmentation algorithm based on the thresholding and the fuzzy c-means techniques, Pattern recognition 23.9 (1990): 935-952.
[13] H.D. Cheng, et al. Lee. Color image segmentation: advances and prospects, Pattern recognition 34.12 (2001): 2259-2281.
[14] A. Blint, and A. Hajdu. An ensemble-based system for automatic screening of diabetic retinopathy, Knowledge-Based Systems, 60 (2014): 20-27.