Energy Reduction Technique in Cloud Computing
Pulkit Asthana1, Er. Ajendra Isaacs2
1
Department of Computer Science and Information Technology,Sam Higginbottom University of Agriculture, Technology and Sciences, Naini, Prayagraj – 211007
2
Advisor, Assistant Professor VIAET, SHUATS, Prayagraj
Abstract: Cloud Computing provides varieties of new services. It involves various internet service providers that provide a number of internet based computing services around the globe that can be accessed through various data-centers that have been established all around the world. With the increase in number of users of cloud computing there has been also increase in the number of data-centre establishment in order to cater to the requests of the users. The power consumption to maintain these data centers and the transportation networks lead to a huge amount of carbon footprint in the atmosphere. Storing data in the cloud is becoming a common trend forboth end-costumers and data center operators. Here, a method for deciding where to host data storage tasks under the constraints of minimal CO2 emission is proposed. The decision on whether to store data locally or store it
remotely at a cleaner data center relies on the models for the local and remote data centers and the network connecting them. We conclude that the transport network that connects a local node and a “cleaner” remote data center plays a significant role in the process of decision making that where to store data and that the frequency of the access of the data is an important and related factor.
I. INTRODUCTION TO CLOUD COMPUTING
Cloud computing is a network based service which enables sharing of computing resources among users. It facilitates the on-demand access to shared computing resources such as servers, storage, applications etc. Cloud computing helps users in saving and processing their data at third party data centres. The term “Cloud” is meant for “Internet”. Thus, the internet is used in cloud computing to provide services of applications, devices, databases and storage etc. to groups or individuals. To provide services to those millions of users, the cloud service providers are continuously improving and expanding the infrastructure of their data-centres. Data-Centres are the places where a numbers of such servers are kept in the systemized manner that they can efficiently respond to the users’ requests.The biggest advantage of cloud computing is the sharing of resources among the end users that helps alot in minimising the quantity of the hardwares used in an organisation thus resulting to less usage of electricity and ultimately helping in reducing the amount of carbon emission.The following “figure-1” shows some of the services that are provided by the cloud service providers:
Figure-1 : Services provided by the cloud
By getting access to such services, the organisations are able to focus on their core functions and they do not have to worry about developing a computing infrastructure to process their data.
A. Types of Cloud Services
The services that are provided by cloud infrastructures are broadly classified into three categories:
unnecessary expenditure in acquiring, establishing and maintaining complex physical servers and other hardwares. Each resource is provided as a separate service component and the user only needs to rent a particular resource for as long as he needs it.Common IaaS business scenarios are mentioned below:
Users can quickly setup and dismantle testing and development environment and launch the products in the markets faster.
Storage management requires skilled staff to manage and maintain the legal compliance of the data. It also requires acquisition of complex hardwares. Such expenses can also be reduced using IaaS.
Hosting websites through IaaS helps in reducing the expenditure required for website hosting as compared to traditional ways. Processing of Big Data to extract hidden patterns and useful information also requires huge amount of processing that can economically be provided through IaaS.
Figure-2: Scopes of IaaS Advantages of using IaaS:
a) No need to own the hardware.
b) Provides scalability on demand.
c) Provides flexibility.
2) Platform as a Service: Platform as a Service provides various types of platforms that are required for the development and deployment of any type of cloud based application on the pay as you use basis. In addition to the hardwares required it also provides the middleware that are required for the development of a particular application. It means that by using PaaS, the users do not have to purchase the license of particular development softwares as they can easily rent them according to their usage requirement thus allowing them to reduce their expenditure on acquiring and managing those softwares.
Common PaaS business scenarios are mentioned below:
a) Development Framework: PaaS provides a framework that developers can build upon to develop or customise cloud-based applications. Similar to the way you create an Excel macro, PaaS lets developers create applications using built-in software components. Cloud features such as scalability, high-availability and multi-tenant capability are included, reducing the amount of coding that developers must do.
b) Analytics Or Business Intelligence: Tools provided as a service with PaaS allow organisations to analyse and mine their data, finding insights and patterns and predicting outcomes to improve forecasting, product design decisions, investment returns and other business decisions.
c) Additional Services: PaaS providers may offer other services that enhance applications, such as workflow, directory, security and scheduling.
d) Advantages of PaaS: By delivering infrastructure as a service, PaaS offers the same advantages as IaaS. But its additional features—middleware, development tools and other business tools—give you more advantages:
e) Cut Coding Time: PaaS development tools can cut the time it takes to code new apps with pre-coded application components built into the platform, such as workflow, directory services, security features, search and so on.
f) Add Development Capabilities Without Adding Staff: Platform as a Service components can give your development team new capabilities without your needing to add staff having the required skills.
g) Develop For Multiple Platforms—Including Mobile—More Easily: Some service providers give you development options for multiple platforms, such as computers, mobile devices and browsers making cross-platform apps quicker and easier to develop.
i) Support Geographically Distributed Development Teams: Because the development environment is accessed over the Internet, development teams can work together on projects even when team members are in remote locations.
j) Efficiently manage the application lifecycle: PaaS provides all of the capabilities that you need to support the complete web application lifecycle: building, testing, deploying, managing and updating within the same integrated environment.
Figure-3: Benefits of using PaaS
3) Software as a Service: It eliminates the requirement of companies to use applications on their own systems. It helps in reducing the need of purchasing hardwares as well as softwares and maintaining them. Instead of buying licences for running softwares users can go to Software as a Service providers to automatically perform their operations. It helps in reducing the workload of the IT Teams. As SaaS’s are provided over the internet, any subscriber can access these services from any device connected to the internet. The major drawback of this type of service is the issue of security. It must provide secure environment for important business data. In cloud computing, organizations can integrate SaaS applications with other software using application programming interface. For Example: A business can write its own software and can integrate this software with SaaS using provider’s API.
Presently Oracle, SAP and Microsoft are some of the leading SaaS providers.
B. Characteristics of Cloud Computing
1) As the cloud services can be accessed on rental basis, it largely help in reducing the cost of various operations in the organisation as no acquisition of hardwares or softwares is required and services are available on Pay As You Use basis.
2) Since all the services can be accessed through internet therefore it is not required to access the services from any particular location.
3) It increases productivity as simultaneous use of same data can be done.
4) Cloud services are considered fairly reliable.
5) Scaling-Up and Down of services is easily done according to the demands and current traffic conditions.
C. Problems Arising Due to Cloud Computing
As Cloud Computing is gaining popularity the demand of cloud services is rapidly increasing in the market. To handle these demands the cloud services providers install large scale data-centers that are made up of thousands of servers. These data-centers also include other infrastructures also such as cooling systems, storage systems and network systems etc. IT Giants such as Google, Microsoft, Amazon, ebay etc have large data-centers around the globe. Such increased usage of these services and operations of their infrastructures demand high amount of electricity that not only increases the operational cost of these services but also leads to enormous emission of Carbon into the environment that is very much harmful for us.
increase as never seen before. Thus, steps must be taken in time to tackle the problem of increased carbon emission without degrading or reducing the quality of service that are provided.
Following green solutions can largely help in resolving the matter.
1) Allowing better allocation of resources such as storage, servers, hardwares etc. as in the begin during the introduction of cloud computing, surplus amount of resources were installed by the companies in their data-centers so as to handle huge amount of requests by huge amount of users. But at some places the resources are surplus and same quality of services can be provided after reducing the resources also. Thus, by reducing these unused resources will result in reduced amount of electricity consumption.
2) Opting environment friendly methods of electricity generation such as through dams, wind mills and nuclear energy, solar energy etc. which also will result in reduction of carbon gases into the atmosphere.
Companies like Microsoft and Google have adopted an innovative method of keeping the servers cool by establishing under water data centers in the Atlantic Ocean.
These data-centers are sealed in huge containers and then submerged into the water thus providing a naturally cool environment for the servers. Through this method the power required for cooling of the data-centers reduced up to a large extent.
According to the Greenpeace report(2010) the carbon emission of selected data-centers and the percentage of electricity generated by power plants that use fuels for electricity generation emits a large amount of carbon. Also, it is very important to evaluate the amount of energy required for data transmission from one place to another.
D. Green Cloud Computing
Green Cloud Computing is a Computing Technology that has minimal adverse effects on our environment. From a layman’s view, minimizing the load on the data-center is equivalent to finding a greener solution for cloud computing. It is profound that many cloud service providers advertise their greenness by showing their low usage of power. But it is not the only factor for consideration. The source of the power used or the type of network used for data transmission also determines the amount of carbon emission. Green Cloud Computing is a way to minimize the carbon footprint of the Data-Centers, type and amount of power used by them and also to improve the type of networks used for different data transmission processes. Cloud computing is the way to save money and energy for the business.
The primary method is to consolidate the Dynamic Voltage Frequency Scaling technique in an efficient way to maximize the resource utilization and to minimize energy consumption of the data-centers which will result in the reduced carbon footprints and thus will help more in achieving the Green Computing. Through the Green Cloud Architecture, energy up to 27% can be saved.
1) Green Cloud Architecture: As a Cloud request is made by the user the same is then transmitted to the green broker where various type of calculations are done related to the type of request, the cost estimated for its completion, to estimate the amount of carbon emission from different data-centers etc. after which a record of every data is stored in its concerned directory and then the request is forwarded to the optimum service provider so that minimal damage is caused to the environment as well as the cost is also low. In such a way a request is processed in the Green Cloud Service thus leaving minimum carbon footprint and creating more profit for the organizations.
E. Techniques for Green Cloud Computing 1) Software Approach
There are two software approaches for reducing energy consumption:
a) By reducing the number of active servers.
b) By reducing the number of running memory nodes.
i) Reducing Energy Consumed by Servers:: It can be implemented by scheduling optimization which is more efficient than hardware optimization in terms of consumed resources, cost and scalability. An important issue for energy efficient virtualized cloud environment is placement of new virtual machine request in the physical server. Higher the correlation coefficient of CPU utilization between selected VMs running on a server, higher the risk of Service Level Agreement violation in the data-center. There is also a server consolidation algorithm that aims to reduce the energy consumption by minimizing the number of active servers. It first sorts the servers in decreasing order based on their load. Then the virtual machines in the least loaded server are chosen for migration. Thereafter these VMs are sorted in decreasing order based on their weights after which they are allocated one-by-one to the most loaded servers. In such a way the least loaded server becomes idle and later the idle servers are switched off thus reducing the number of active server and resultantly reducing the energy consumption.
ii) Reducing Energy Consumed By Memory
Two types of policies can be adopted to reduce the consumption of energy by memory:
1. Biggest Cover Set First: To reduce the currently running memory nodes, it tries to find the biggest access set that is completely covered by memory nodes that are currently in use and schedules the VM correspondingly.
2. Biggest Memory Node First: It schedules the VMs based on the popularity of individual memory nodes i.e. the number of VMs that use particular memory node in the entire system.
2) Hardware Approach
a) Dynamic Voltage Frequency Scaling: A number of processors that can operate at different voltage and frequency are used. The appropriate supply voltage and frequency of processing elements is selected to minimize to energy consumption based on the VMs workload. Each VM is allocated to the first fit server and the servers apply the DVFS technique to save energy and comply with the service level agreement.
b) Energy Aware Resource Efficient Workflow Scheduling Under Deadline Constraint (EARES-D): It is carried out in multiple phases. In the first phase it calculates the earliest estimated completion time of a task in all the data-centers. Then, optimal frequency of executing is determined by scaling down the processor frequency under the deadline constraint. Then based on the first and second phase, the data-center is selected. The task is then forwarded to the selected data-center. The resource utilization rate is then improved by reusing VM and shrinking the idle time between the tasks.
F. Motivation and Problem Statement
The users of cloud services are increasing day by day at a very rapid speed. It means that if necessary steps are not taken at the earliest possible then there will be more and more carbon footprint that will eventually lead to degradation of the living quality of people. To reduce carbon footprints it is very important at first to track and study the current scenario and then develop some algorithm to estimate the carbon emission of a particular data-center.
According to Makkes(2013), authors have used a model to estimate carbon footprint to decide where a particular task should be processed. But this model does not calculate the carbon cost from the source of the request to the data-center. Also it lacks in routing the requests to optimally green data-center.
If a task consists of Nin Gigabytes of input data, it will always be transferred through the network. Thus, the estimated transportation cost in KWH would be:
- _ = + + + + ∗ ∗
(2.1)
Transport cost of a task in LAN will be:
( )= ∗ + + + (2.2)
= ∗ . (2.3) Where PUEN = Power Usage Effectiveness of Network PUEd = Power Usage Effectiveness at Data-Center Tprocessing = Processing time in CPU
Pcomputer host = Power consumption of computation host U = Factor for the utilization of the network equipment C = Capacity of equipment
n = Number of hops
Makkes, Taal, Osseyran and Grosso(2013) discuss the following:
Carbon cost local processing> Carbon cost network + Carbon cost remote processing
Thus, if the carbon cost at local DC will be lower than the remote DC the request will not be forwarded to the remote DC else it will be. Carbon cost from the request source to the local DC is not included here.
Here only single path is assumed from the source of the request to DC:
G. Objectives
The main objectives of this report
1) To study the existing method of placement of applications and request responding in cloud computation.
2) To propose a method that calculates the overall carbon cost of different data centers and allocates the request to the most feasible data center.
3) To evaluate and compare the proposed methodwith the existing method.
II. REVIEW OF LITERATURE
1) Baliga, Ayre, Hinton and Tucker(2011):The authors presented an analysis on consumption of energy in cloud computing. The analysis looked over both public as well as private cloud networks. It also included consumption of energy in data transmission, processing and storage. According to them cloud computing can be a more energy efficient form of computing especially for low intensity and infrequent tasks. However, at some instances it can consume more energy than the conventional computing.
2) Baikie(2011):This paper focuses on the developing regions of the world to connected those left out people along with the rest of the world. The authors suggest an approach through low energy consuming systems that use clean and renewable energy. The basic requirements of any developing region (beyond food, shelter and clothing) are education, jobs and banking system. All these are possible by using computing and to optimize that computing cloud access is very much necessary. The cloud infrastructure can provide optimum result towards speedy development of such regions only if there is a dependable network and electrical infrastructure. These regions are already connected to the internetwork. The question is how to best interconnect inside these regions. This paper presents an approach for low energy consuming data centers using cloud computing for the development of these regions that are powered using renewable energy.
Local DC
Remote DC
3) Xiong(2012):This is a survey on Green Cloud Computing based on networks. It is necessary to make cloud computing green which can be achieved by providing the cloud services while keeping a track on the energy consumption and controlling the power supply under a preset energy criteria. The understanding of the difference between being a “user of” and a “provider of” cloud services is very important in creating a Green Cloud Computing environment in the world. Furthermore, recent works done on Green Cloud Computing based on networks including microprocessors, scheduling algorithms, cooling systems, virtualization technology and disk storage etc. were introduced.
4) Rasoul Beik(2012):It has been reported that with the increase in the use of cloud services the energy requirement at the data-centers has increased thus increasing carbon emission in the atmosphere. Various hardware and software solutions have also been introduced such as using low energy consuming hardwares, virtualizations and optimizing consumption of energy by implementation of efficient software algorithms. One of the most important ways for achieving Green Cloud Computing is looking over new architectural approaches for the softwares that are run on cloud. The paper proposes an energy aware layer in software architecture which evaluates amount of energy consumption at data-centers and then makes services migrate to hosts that use energy more efficiently.
5) Rawai(2012):This paper presents an in depth review of cloud computing in construction management. It shows that by using cloud computing technologies for construction collaboration will help in minimizing the usage of power and the emission of CO2 into the atmosphere. The development of cloud technology gives construction organizations potential to developan integrated and collaborative environment for construction management. Thus the main objective on which the authors focus on is to find valuable construction collaboration tools as the cloud computing along with main concepts of sustainable project development. The results of the paper show that by using cloud computing in construction industry the communications, relations and networks will be highly facilitated. Collaboration in an efficient way will maximize the productivity and improve the effectiveness of a green construction industry.
6) Marguerite Reardon(2012): Authors discuss that there is a huge amount of energy consumption in the data centers that cost operators like Google and Amazon millions of dollars to run each year. And now, as more and more information is getting virtualized and accessed in the cloud, these data centers are getting bigger and are consuming more energy. There is pressure on big internet companies for reducing their energy cost. These companies face pressure from governments and others concerned with the environment to reduce their carbon footprints.
7) Tom Worthington(2012): The energy efficiency of operating equipment is a major concern of Green Technology Strategies. Green Technology Strategies seeks to inform accepted management practices to achieve efficient and effective business interaction. The embodied energy and lifecycle of the materials used in the design, manufacture and reuse and recycling of equipment and components are also concerns.
8) Jain(2013): In this paper the authors proposed different ideas for Green Cloud Computing. It has been shown that as Cloud Computing is gaining popularity the number of cloud service providers has increased and they are establishing high performance computing huge data-centers and energy consumption of these data-centers is also increasing day by day. The large amount of CO2 getting emitted due to these data-centers has generated the necessity of Green Cloud Computing. More servers generate more heat thus require more cooling and more cooling then generates heat. Thus different approaches for Green Cloud Computing have been discussed in the paper.
9) Makkes, Taal, Osseyran and Grosso(2013): The authors have used a model for estimating the carbon footprint to determine the location of computing a task so as to minimize the carbon emission in performing a task. But this system lacks to route requests to greener data center optimally. Also it does not estimate the carbon cost from the source of the request to the local data-center. Also if the same source of request resends a computation request the same procedure of selecting greener data center is repeated hence it takes more time to complete a request. Only single path from source to the data-center is assumed here.
10) Krishnan, Dwivedi and Bhagwat(2014):This paper outlines the role of Graphical processing Units in reducing power consumption in a data center. GPU computing is the use of a GPU (graphics processing unit) as a co-processor to accelerate CPUs for general-purpose scientific and engineering computing. This paper rightly emphasizes on the utility of GPU’s in reducing power consumption at a data center.
reduces operational cost and delivers quality service according to the standards. The authors propose a dynamic migration algorithm to minimize the consumption of energy. The proposed approach utilizes Software Defined Networking using Open Flow technology. The results are promising and improve energy efficiency of the data-centers.
12) Reddy(2014): Cloud Computing Technology has solved the problem of device dependency. Its flexibility and zero maintenance has attracted many individuals as well as organizations towards this technology and the number are increasing day by day. Therefore it has become very necessary to have an energy efficient cloud computing system. This paper presents a system in which real as well as non-real time tasks are handled in an efficient manner without compromising much on the reliability or performance of the services. Different algorithms such as Earliest Deadline First, Earliest Deadline Late and First Come First Serve scheduling algorithms have been used to take on the requests of the users. The simulation results show significant savings in the operational cost and power consumption as compared to the existing methods of processing.
13) Stoney Brooks, Wang, Sarker (2014):The decision surrounding whether or not to implement Green IT strategies, policies, and tools provides compelling challenges for organizations. In this paper, author conduct a comprehensive review of both the practitioner and academic literature surrounding Green IT. While practitioners have been highly interested in this topic for a while there is also a growing interest on this topic among academicians. By presenting the overlaps and differences between both perspectives, they aim to identify noticeable gaps in the current literature.
14) Fatima Zahra(2015): This paper highlights the importance of the role played by the developing countries of the world in reducing the carbon emission. The developing countries include more than half of the world’s population. If they succeed in continuing their pattern of growth, then by mid-century or shortly after that, they will be approaching developed country levels of income with associated patterns of consumptions, energy use and carbon emission. If patterns are like the present ones, the climate change battle will have been lost.
15) Meikel Poess, Nambair, Vaid, Stephens, Huppler, Haines(2015): With an increase in energy cost and energy consciousness, industry standards organizations such as Standard Performance Evaluation Corporation(SPEC) etc. have developed tests to measure energy consumption of computer systems. Although they aim at standardization of power consumption measurement using benchmarks, ultimately aiming to reduce overall power consumption, their methodologies differ a little. In this paper, the authors present a comprehensive overview of the current benchmarks followed by an in depth analysis of the commonalities and differences.
16) Akin(2015):This report states as the Cloud Computing is rapidly spreading into the market, an enormous amount of energy is being consumed in running it. Therefore, it is need of the hour to find measures that can help in reducing the power consumption. Also, it suggests the use of renewable energy in the field of cloud computing. Further, there have been discussions about some geographical locations where their potential for generating solar and wind energy can be utilized up to a great extent that can resultantly help in decreasing the amount of emission of CO2 into the atmosphere.
17) Govindasamy and Joseph(2015):The paper points out the green aspects of computing at its heart, the operating system i.e. how can the capabilities be nurtured, how it can be extended to fit our green cloud model. As per the report, Linux is highlighted as an an environmentally friendly operating system that has been in line of operating under the green approach. Authorhas also pointed out some reasons like reduced e-waste, reduced toxins, efficient power consumption and reduced carbon emissions.
18) Biran(2016):This report provides measures to reduce the carbon emission rate on the carbon emission trajectory of the data-centers. Report states solution of cross-data-center deployment that use both green as well as brown energy to run themselves according to the need. In doing so the report states that the solution can reduce carbon emission growth of the data centers by minimum 20%.
19) Rubyga(2016): This paper provides an overview of the cloud computing environment, an insight to the necessity of having a Green Cloud Computing environment and the strategies and methods that are being used for reducing the operational and more importantly carbon cost of the data-centers. The authors explain that due to being solving large computation problem and other internet based services, cloud computing technology is a much sought after technology. In addition, the increase in the amount of data has resulted to installation of large data-centers around the globe. This is a major cause of increased operational cost as well as higher carbon footprint. These are certain factors that have aroused the need of Green Computing.
20) Chaurasiya and Thakur(2016):The report states that by the year 2020 carbon emission of IT industries will rise by 20%. The data-centers being established for the purpose of cloud computing are the major reasons for this increase. The energy consumed by these data centers is the basic cause of this increase in the carbon emission.
carbon cost of the data-centers. The authors explain that due to being solving large computation problem and other internet based services, cloud computing technology is a much sought after technology. In addition, the increase in the amount of data has resulted to installation of large data-centers around the globe. This is a major cause of increased operational cost as well as higher carbon footprint. Those are certain factors that have aroused the need of Green Computing.
22) Christian Reimsbach Kounatze(2016):The paper describes that the ways to improve the environmental performance, tackling global warming and enhancing resource management are high on the list of global challenges that must be addressed urgently. The ICT industry needs to further improve its environmental performance as it is responsible for about 2-3% of global carbon footprint. Governments and private organizations are initiating various programmes to address the environmental challenges effectively, Global Warming in particular. Businesses have mainly focused on reduction of energy consumption to demonstrate corporate social responsibility.
III. MATERIALS AND METHODS
A. Voronoi Partitions
Voronoi Partitions are the partitions of a graphical plane on the basis of distances between distinct points in a specific subset of the plane. These subsets are centered around points known as sites and are specified beforehand. For each site is a corresponding region that consists all points closer to that site than any other. A site is assigned to a region if the distance of the site is less than the distance to other sites. In this report concept of Voronoi Partition is used to make partition of cloud services at the initial level. In the later level the partition is done by calculating the complete Carbon Cost of processing a task.
The network for transmission of data for computing purpose plays an important role thus uses large amount of energy. It is assumed that all the data-centers have similar kind of infrastructure capabilities for completion of a task. But the type of energy used by their operational networks and data-centers may come from different sources. So in such case keeping an eye in the power consumption is very much important. With the help of this model it can be efficiently decided where to process a task.
B. Proposed Method: “CO2 Reduction Techniques for Cloud Computing”
In this proposed work, it is assumed that at first, each data-center has information regarding partition associated with it and also the base information for calculating carbon emission. Every data-center can communicate with every other data-center to check for the best route available between the source and the data-center.Suppose there are two data-centers ‘a’ and ‘b’ belonging to partition ‘Pa’ and ‘Pb’’ and a request ‘r’ for performing a task from source ‘S’ has been sent to data-center ‘a’, then, based on the following algorithm the request is routed to the optimal data-center,
S є Pa U Pb
If(Ca_input + Ca_output + Ca_lan_input + Ca_lan_output + Ca_process)> (Cb_input + Cb_output + Cb_lan_input + Cb_lan_output + Cb_process) Then S є Pb
Else S є Pa
List of abbreviations:
Ca_input Amount of CO2 emission in data transmission from source to ‘a’
Ca_output Amount of CO2 emission in data transmission from ‘a’ to source
Ca_lan_input Amount of CO2 emission by LAN of ‘a’ during input
Ca_lan_output Amount of CO2 emission by LAN of ‘a’ during output
Ca_process Amount of CO2 emission from ‘a’ during task performance
Cb_input Amount of CO2 emission in data transmission from source to ‘b’
Cb_output Amount of CO2 emission in data transmission from ‘b’ to source
Cb_lan_input Amount of CO2 emission by LAN of ‘b’ during input
Cb_lan_output Amount of CO2 emission by LAN of ‘b’ during output
Cb_process Amount of CO2 emission from ‘b’ during task performance
The prediction of energy consumption is based on the work of Baliga(2011). Now to find the carbon emission, following relation is considered
i.e. 1kWh = X gr. CO2 (3.1)
Table 1 : Values for factor X through different sources
Energy Source X value
Brown Coal 950
Anthracite 870
Crude oil 640
Gas works gas 400
Natural gas 380
Nuclear power 66
Geothermal power 40
Biomass 30
Solar power 22
Hydroelectricity 15
Wind power 10
Now energy cost in kWh can be converted into equivalent CO2 emission cost C in terms of grams of CO2. Equivalent CO2 cost forother equations will be as given below:
W = Ctransport_internet = Xtransport_internet . Etransport_internet(Nin/Nout) (3.2)
Clan(Nin) = Xdata_center . ELAN(Nin/out) (3.3)
Cprocessing = Xdata_center . Eprocessing (3.4)
C. Existing Work Analysis
[image:11.612.72.537.398.482.2]Before calculating the carbon emission, we need to calculate how much energy is required from various sources to transport the requests.
Table 2: Power per capacity of transport network components
Equipment Power [kW] Capacity[GB/s] [kW/GB/s]
Content Server Router
Ethernet Switch Firewall
DWDM terminal node
0.225 1.2 3.8 0.65 0.136
0.8 100 160 40 40
0.280 0.0120 0.0230 0.016 0.0034
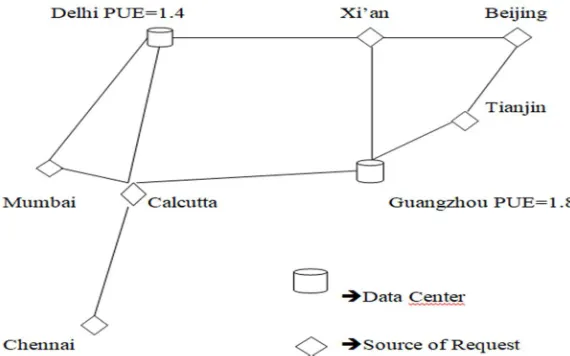
A comparative analysis between work discussed by Makkes(2013) and the work proposed here has been shown. Here one data center is situated in Mumbai, India and the other one is in Guangzhou, China.
[image:11.612.156.441.535.713.2]For comparative analysis let us suppose that a request is originating from Calcutta and goes to the local data center in Delhi since the initial partition has been done on the basis of distance.Number of hops between source to local data center in Delhi is 1, from Delhi to Guangzhou is 9, and from Calcutta to Guangzhou is 5. PUE of both the data centers is 1.4 and 1.8 as shown in the figure above. It is assumed that data center in Delhi is powered by electricity produced from Coal energy (870 gr. CO2/kWh) and Guangzhou data center is powered by electricity produced from Hydropower (15 gr. CO2/kWh).
Now in the case of Makkes(2013), when request goes to Delhi based data center, values for Etrans_net, ELAN(Nin), ELAN(Nout), Eprocessing are:
Etrans_net = 0.002417 kWh ELAN(Nin) = 0.002445 kWh ELAN(Nout) = 0.001222 kWh Eprocessing = 0.12425 kWh
Data centers know the nearest remote data center to check for its greenness. So it considers shortest route available from local data center to remote data center. Based on equations 2.1, 2.2 and 2.3,the scheduler present at Delhi based data center finds values Etrans_net_to_remote = 0.006218 kWh/GB, ELAN(Nin)_remote = 0.003144 kWh/GB and Eprocessing_remote = 0.15975 kWh. Now calculated carbon emission at local data center is compared with total carbon emission during relocation of computation at remote data center. Total carbon emission at local data center that is (Clocal_lAN(Nin) + Clocal_LAN(Nout) + Cprocessing) = 104.891 gr. CO2. Here carbon emission between source to local data center is not included as Makkes(2013) assume source to be directly connected with local data center. Further carbon emission during computation at remote data center is equal to (2 × Clocal_LAN(Nout) + Clocal_LAN(Nin) + Ctransport_internet(Nin) + Ctransport_internet(Nout) + Cremote_LAN(Nin) + Cremote_LAN(Nout) + Cprocessing) that yields 13.1876 gr.CO2.While calculating the values of Ctransport_internet(Nin) and Ctransport_internet(Nout)from Delhi to Guangzhou it is assumed that 20% of transport network is in India and rest in China. X factor for network is found by power mixes shown in following figures.
(a)
(b)
Sources of electrical energy in China based on China Government’s report
Thus, from the data above, mean value of factor X in India will be 550.09 gr. CO2/kWh and for China it will be 563.74 gr.CO2/kWh. Now if the request would go to Guangzhou the calculated Xtransport_internet = 0.20 x 550.09 + 0.80 x 563.74 = 561.01 gr. CO2/kWh. Here, (Clocal_LAN(Nin) + Clocal_LAN(Nout) + Cprocessing)> (2 x Clocal_LAN(Nout) + Clocal_LAN(Nin) + Ctransport_internet(Nin) + Ctransport_internet(Nout) + Cremote_LAN(Nin) + Cremote_LAN(Nout) + Cprocesing)
Now, from the analysis, it is clear that the request is computed at remote data center situated in Guangzhou, China as emitted carbon is 13.1876 gr. CO2. The following tables show the comparision:
Table3 : Cost at local data center (PUE = 1.4 Coal 820 gr.CO2/kWh) Gr. CO2(kWh)
Clocal_LAN(Nin) 2.0049
Clocal_LAN(Nout) 1.00204
Cprocessing 101.885
TOTAL 104.891
Table4 : Cost for relocating at remote data center (PUE = 1.8 Hydro 24 gr.CO2/kWh) Gr. CO2(kWh)
2* Clocal_LAN(Nout) 2.982
Clocal_LAN(Nin) 4.004
Cteansport_internet(Nin) 2.104
Ctransport_internet(Nout) 0.5875
Cremote_LAN(Nin) 1.293
Cremote_LAN(Nout) 1.093
Cprocessing 1.058
TOTAL 13.12
Initially the partitions are based on the basis of distance. When a request from the source is transmitted to a data-center suppose ‘a’ then according to the algorithm complete carbon cost is calculated at ‘a’. Here all data-centers share their partition information with every other data-center. So, the data-center ‘a’ compares its carbon cost with the carbon cost of data-center ‘b’. If the carbon cost of data-center ‘b’ is lower than the carbon cost of data-center ‘a’ then the source is designated to partition ‘b’ and the request is entertained at data-center ‘b’ otherwise source is designated to partition ‘a’ and the request is performed at data-center ‘a’. Once the optimum partition is designated to the source then all later requests are directly transmitted to the data-center in that partition thus it will minimize the throughput time also along with minimizing the carbon emission in performing a particular task.
This method of predicting the carbon emission by a data-center and the energy consumption is based on the work of Baliga(2011). The proposed method when compared with existing method proposed by Makkes(2013) makes it clear that processing the request through the method of the later will result in higher carbon cost whereas the former will cause significantly less carbon emission into the environment.
IV. RESULTS AND DISCUSSION
The method has reduced many deficiencies that are involved in the method psroposed by Makkes(2013). Carbon emission from the source to the data-center is not calculated in their method as the authors have assumed that data-center is very near to the source of the request. But it is not always necessary. So in the method proposed here, amount of carbon emitted while transmission of the data from the source to the data-center is also took in consideration.
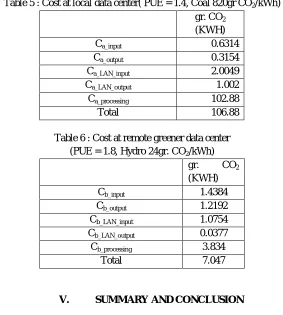
Table 5 : Cost at local data center( PUE = 1.4, Coal 820gr CO2/kWh) gr. CO2
(KWH)
Ca_input 0.6314
Ca_output 0.3154
Ca_LAN_input 2.0049
Ca_LAN_output 1.002
Ca_processing 102.88
Total 106.88
Table 6 : Cost at remote greener data center (PUE = 1.8, Hydro 24gr. CO2/kWh)
gr. CO2 (KWH)
Cb_input 1.4384
Cb_output 1.2192
Cb_LAN_input 1.0754
Cb_LAN_output 0.0377
Cb_processing 3.834
Total 7.047
V. SUMMARY AND CONCLUSION
A. Summary
Cloud Computing is an internet based service provided by various dedicated organisations to help businesses and people in computing job. The users not need to have all the accessories required to perform a task but just a device with internet access.Cloud Services can be classified majorly in three types of services that are:
1) Infrastructure as a Service (IaaS)
2) Platform as a Service (PaaS)
3) Software as a Service (SaaS)
IaaS provides the hardware services to the users such as storage, network, servers etc.
PaaS provides necessary tools such as development environment and database to the users so as to help them in developing applications.
SaaS provides softwares to the user without needing them to buy licences to use them. All these services are simultaneously shared among different users from different places.
Cloud infrastructure provides pay-as-you-use service so that to reduce the operation costs of the organisations that is spent on owning the tools and hardwares for performing jobs.
As traffic increases, power consumption increases and hence it leads to more carbon footprint. We need to exercise some methods to reduce power consumption in cloud environment to process tasks. In this report, a brief description of Makkes(2013) has been shown that explains how a request is moved to an energy optimized data center. But it lacks some points of consideration. An improved version of existing algorithm is given the considers all the point to calculate carbon footprint through the cloud and discussed when an where to move a request to minimize carbon emission.
B. Conclusion
From the analysis, it is clear that if the same source of the request is serviced by the method proposed by Makkes(2013), it costs more carbon(13.1876 gr. CO2/kWh) in comparison to the proposed model “Energy Reduction Techniques for Cloud Computing” which shows that carbon eission will be less(7.047 gr. CO2/kWh).
C. Future Scope
This paper represents a comprehensive energy consumption analysis of Cloud Computing. The analysis included energy
consumption in data transmission, processing and storage. All Cloud services i.e. Infrastructure as a Service, Platform as a Service and Software as a Service have been considered during the analysis.
Power consumption and carbon emission in data transmission alone is significantly high in cloud computing. With the increase in number of file downloads per hour, the energy consumption in data transmission gets high and thus “Storage as a Service” consumes more power than the local storage hard drives. Thus it increases the carbon emission in the atmosphere. Measures to reduce power consumption in cloud computing environment are the need of the hour.
A brief description of the existing method has been given in this report that explains how to move a request to the optimized data center. But it lacks some areas to consider such as the energy consumption during the transmission of the data from source to the data center and back to the source.
This report suggests an improved version of the existing method that looks on the left out points and calculates the amount of carbon emission into the environment then routes the requests to greener data-centers to minimize the energy consumption and carbon footprint.
Following areas can be considered for implementation of Green Cloud Computing in future:
1) Increasing wireless networking technologies and rising adoption of cloud platform across the globe are the key factors that will trigger the growth of the cloud computing in industrial IoT sector. Cloud computing in industrial IoT delivers the computing services such as storage, servers, networking, databases, software, analytics, and much more.
2) The cloud-based storage provides the remote database to save the data files rather than keeping files on a proprietary hard drive or local storage device.
3) Today the way in which IT sectors are adopting cloud computing can bring up a very bright career in this field. The main work of Big Data in companies is protection and analysis of data. Big Data and Data Analytic s will also have its use in future in Business Forecasting.
4) 85% Software developed since 2012 are cloud enabled and Future Data requirement increasing will enabling more services through Cloud.
5) Businesses can utilize the time productively as on-site data center management task, upgrade, patch up and other related works are eliminated.
6) Data backup and disaster recovery is easier and cheaper as compared to on-site management and is reliable too saving investment cost.
VI. ACKNOWLEDGEMENT
A. I express profound sense of gratitude to my advisor Er. Ajendra Isaacs, Assistant Professor, Department of Computer Science and Information Technology, Sam Higginbottom University of Agriculture, Technology and Sciences, Prayagraj whose guidance, motivation and invaluable support in providing the opportunity to conduct my thesis.He brought aspects to my attention that I had to improve and continue to work on.
B. I would also like to take opportunity to thank Dr. H. M. Singh, Assistant Professor, Department of Computer Science and Information Technology, Sam Higginbottom University of Agriculture, Technology and Sciences, for providing the knowledge that opened the new horizon by his special teaching style.
C. I would also like to thank Er. P. Stanley, Assistant Professor, Department of Computer Science and Information Technology, Sam Higginbottom University of Agriculture, Technology and Sciences for making the supportive work environment.
REFERENCES
[1] Marc X Makkes, Arie Taal, Anwar Osseyran, Paola Grosso “A decision framework for placement of applications in cloud that minimizes their carbon footprints”.
[2] Jayant Baliga, Robert W. A. Ayre, Kerry Hinton, Rodney S. Tucker “Green Cloud Computing: Balancing energy in processing, storage and transport”. [3] Bruce Baikie(2011) “Green Cloud Computing in developing regions, moving data and processing closer to the end users”.
[4] Rasoul Beik(2012) “Green Cloud Computing: An energy aware layer in software”. [5] N. M. Rawai(2012) “Context aware cloud computing for construction collaboration”.
[6] Muhammad Anan(2014) “SLA based optimization of energy efficiency for green cloud computing”. [7] Sonika P. Reddy(2014) “Energy aware scheduling of real time and non-real time tasks on cloud processors”. [8] N. Tugbagul Altan Akin(2015)“Survey on green cloud computing and using a renewable source in turkey”. [9] Yahav Biran(2016)“Coordinating green clouds as data intensive computing”.
[10] Rubyga and Sathiyabhama(2016)“A survey of computing strategies for green cloud”.
[11] Sanjee Thakur and Ankur Chaurasiya(2016)“Towards Green Cloud Computing: Impact of carbon footprint on environment”. [12] Shaden M. AlIsmail and Heba A. Kurdi(2016) “Review of energy reduction techniques for green cloud computing”. [13] Rohini Sharma(2015) “Approaches for green computing”.
[14] Ahad Abdullah(2014)“Green Cloud Computing: The need of the hour”.
[15] Priyanka Pattenshetti and Sharmila S. Patil(2014)“Overview of green Cloud Architecture”.
[16] Anne M. Holler “The Green Cloud: How cloud computing can reduce data center power consumption”. [17] Sovacool BK “Valuing the greenhouse gas emission from nuclear power: a critical survey”.
[18] Taal A, Grosso P and Bomhof F “Transporting bits or transporting energy: does it matter?”
[19] Yashwant Singh Patel “Green Cloud Computing: A review on green IT areas for cloud computing environment” [20] Yahav Biran “Coordinating green clouds as data intensive computing”