Utah State University Utah State University
DigitalCommons@USU
DigitalCommons@USU
Undergraduate Honors Capstone Projects Honors Program
5-2018
Algorithmic Trading for Cryptocurrencies
Algorithmic Trading for Cryptocurrencies
Michael WardUtah State University
Follow this and additional works at: https://digitalcommons.usu.edu/honors Part of the Computer Sciences Commons
Recommended Citation Recommended Citation
Ward, Michael, "Algorithmic Trading for Cryptocurrencies" (2018). Undergraduate Honors Capstone Projects. 453.
https://digitalcommons.usu.edu/honors/453
This Thesis is brought to you for free and open access by the Honors Program at DigitalCommons@USU. It has been accepted for inclusion in Undergraduate Honors Capstone Projects by an authorized administrator of DigitalCommons@USU. For more information, please contact [email protected].
ALGORITHMIC TRADING FOR
CRYPTOCURRENCIES
by
Michael Ward
Capstone submitted in partial fulfillment of the requirements for graduation with
Departmental Honors and University Studies
Approved:
Capstone Mentor Professor Andrew Brirr:
Committee Member Dr. Tyler Brough
in the degree of
Bachelor of Science
in the Department of Computer Science
UTAH STATE UNIVERSITY Logan,UT
Spring 2018
Departmental Honors Advisor Dr. Dean Adams
University Honors Program Director Dr. Kristine Miller
Abstract
This project takes several common strategies for algorithmic stock trading and tests them on the cryptocurrency market. The three strategies used are moving average crossover, mean reversion, and pairs trading. Data was collected every five minutes for the top one hundred cryptocurrencies between October 5, 2017, and January 24, 2018.
Due to the high volatility of the market, the data includes various market situations. Three noted situations are a rising market, falling market, and relatively stable market. The three strategies were modified to optimally follow each market situation.
Modifications include adjusting parameters used in each strategy as well as mixing several strategies or dynamically changing between strategies. In each strategy and with each cryptocurrency, the benchmark against which the algorithm is tested is the market's performance, or what an investor would have after buying and holding. Returns are compared with the buying and holding strategy, and different scenarios are
analyzed to determine the risk associated with buying and holding compared with an algorithmic strategy. Results will be taken with the market's actual trends and also with some alternate possible trends to test all market scenarios. A web interface will
accompany the presentation, allowing users to test the strategies by entering their own parameters and instantly see the results.
Acknowledgements
A special thanks to all of the following people, without whom this research would never
have been possible.
Adjunct Professor Andrew Brim for providing me with an introduction to algorithmic trading strategies and meeting with me every week to review my research.
Dr. Tyler Brough for teaching me many financial concepts essential to this research. Dr. Dean Adams for reading the proposal and final product and giving me suggestions along the way to improve the research.
Dr. Kristine Miller for all her work leading the honors program.
USU Honors Program for providing me with an opportunity to apply academic knowledge in a practical setting.
USU Department of Computer Science and College of Engineering for providing me
with the courses and education required to complete this degree.
Stanford Cline for helping me to collect the data used for this project.
Eric Bell for his assistance with testing and improving the trading algorithms used within this project.
Vocabulary
Word count for entire report (excluding reflection): 5445
The following list gives important words, in alphabetical order, that will be used
throughout this paper. Any words used within this paper that are not commonly
known are included in this list. Definitions in this list may consist of other words that are defined elsewhere in the list.
Algorithm: a procedure that a computer follows to solve a problem, calculation, or mathematical equation.
Bitcoin: the first cryptocurrency and the only one currently available for options and futures contracts. Also the most commonly traded cryptocurrency, and the cryptocurrency with the biggest market cap.
Bitcoin Cash: a cryptocurrency. While Bitcoin Cash shares most of its technology
with Bitcoin, the two are completely separate cryptocurrencies . The two share the
same ledger prior to August 1 , 2017, but all transactions after that date are completely separate for the two currencies.
Broker: an agent who buys or sells goods or assets for others.
Cryptocurrency: a digital currency operating independently of a central bank. Encryption technologies are used in place of a central bank to generate currency units and verify transfer of funds. A publicly viewable ledger is used to record transactions. While cryptocurrencies are designed to be a replacement for fiat currencies and used as a medium of exchange, their volatile nature makes them usable as a financial security. Cryptocurrencies are often referred to by their abbreviation, "crypto."
Crypto-to-Crypto Exchange: a cryptocurrency exchange that does not use any fiat currencies. Transactions can take place only between different
cryptocurrencies. Because no fiat currencies are involved, crypto-to-crypto
exchanges are often very loosely regulated by governments. This allows these
exchanges to support more different cryptocurrencies and reduce trading fees. Because of the lower fees and greater support, almost all transactions that involve trading a cryptocurrency for another cryptocurrency are done using
crypto-to-crypto exchanges. Fiat exchanges are generally used only when a fiat
currency must be involved in the trade.
Ethereum: a cryptocurrency. Ethereum has the second largest market cap after Bitcoin.
Exchange: a marketplace where securities are traded. The two largest exchanges for the stock market are the New York Stock Exchange and NASDAQ. There are two major types of cryptocurrency exchanges: fiat exchanges and crypto-to-crypto exchanges. Both are explained in this vocabulary section.
Fiat Currency: legal tender whose value is backed by the issuing government.
Fiat Exchange:
a
cryptocurrency exchange where fiat currencies can beexchanged for cryptocurrencies. In the United States, the most common exchange is USO for Bitcoin or Ethereum. Fiat exchanges are sometimes called "fiat
gateways," because they are the gateway to investing in cryptocurrency. Since fiat exchanges use fiat currencies, the exchanges are often heavily regulated by the fiat currency's iss•uing government. In the United States, this can include the federal government and/or state governments. Because of the regulation, fiat exchanges usually do not support many cryptocurrencies. They also often have higher trading fees than crypto-to-crypto exchanges. Therefore, it is common for cryptocurrency investors to use fiat exchanges as a gateway to transfer fiat
currency into one cryptocurrency, and then use a crypto-to-crypto exchange to buy different cryptocurrencies .
Future: a financial contract obligating the buyer to purchase an asset or the seller to sell an asset at a predetermined future date and price. A medium of exchange for futures is known as a futures exchange. Numerous futures exchanges exist for many securities, including stocks, commodities, and even the weather. The first cryptocurrency futures were launched for Bitcoin in December 2017. Currently, the only cryptocurrency futures available are for Bitcoin, but announcements for
upcoming Ethereum and Ripple futures contracts have been made.
Litecoin: a cryptocurrency.
Option: a financial contract giving the buyer the right, but not the obligation, to buy or sell an asset at a specified price on a specified date. The buyer of the option can also be known as the option holder, and is the one who is given the option to buy or sell the asset in the future. Unlike futures, which are free, options require a fee upfront and are bought from the seller.
Security: a tradable financial asset. The legal definition varies between
jurisdictions, but will be clearly defined for use within this paper. For use within this paper, a security will refer to any tradable financial asset, including but not limited to stocks, commodities, cryptocurrencies, options, and futures.
Stock: a type of security that indicates a portion of ownership in a publicly held corporation.
Ripple: a cryptocurrency.
Introduction to Algorithmic Trading
Every decision made in trading has two major components: what to buy or sell, and when to buy or sell it. Every trading strategy consists of determining how to figure out what to buy and when to buy or sell it. There are two major ways to evaluate these questions: fundamental analysis and technical analysis.
Fundamental analysis makes an evaluation about the value of a security by examining many aspects of the financial condition of a company. This is meant to determine if the current price of the security is undervalued or overvalued in an attempt to predict whether the price will increase or decrease in value. These decisions are often based on several metrics. Some of these metrics include the P/E ratio, which is the ratio of the price of the stock to the company's earnings. If the P/E ratio is too high, this is often a predictor that the price of the security will decrease soon to correct the overly high PIE ratio. The converse is also true: if the P/E ratio is too low, this is commonly an indication that the price of the security will increase in the near future to correct the overly low PIE ratio.
This method can be very useful in determining the underlying value of securities and is commonly used by professional investors and financial analysts.
However, this form of analysis requires a lot of knowledge about finance. It can also be very time-consuming and requires the analyst to regularly check on all the statistics about th.e security to re-evaluate the security's financial status.
The other form of analysis is technical analysis. This method uses only the current price of the security and the trend of past price values. Technical analysis uses mathematical formulas to make a forecast about the direction of future
changes in the pr:ce. Unlike fundamental analysis, technical analysis only requires knowledge of the mathematical formulas and does not require any in-depth
knowledge of the financial condition of the company.
Technical analysis also has a much lower time commitment when
compared to fundamental analysis, since complex re-evaluations are not required as often. The only time commitment required with technical analysis is initially setting up the eq•Jation and updating data as the prices change. Technical
analysis is also much more quantifiable than fundamental analysis, making it much easier to track the efficiency of a strategy.
Algorithm\G trading is an improvement on technical analysis. Computers
are used to automatically run a technical analysis at set increments of time to
determine the optimal points in time to buy and sell a security. In algorithmic
trading, buy and sell signals are automatically generated by the mathematical
models commonly used in technical analysis.
Algorithmic Trading Strategies
Moving Average
The moving average is the building block of all the strategies discussed in
this paper. While a moving average does not entail a trading strategy on its own, it
forms an integral part of all the other trading strategies. A moving average has a
numeric value associated with it. If the numeric value is represented as x, the
moving average '-:vould be called the x-day moving average. Some common
examples are a 5rday moving average, 10-day moving average, or 20-day moving
average.
An x-day moving average is calculated by adding together the prices of the
security for the last x days and dividing that total value by x
. This finds the average
price over the last x days. For example, a 5-day moving average would be
calculated by adding the price of the security over the last five days and dividing
the sum total by ~- The formula for calculating a moving average is as follows:
Mx
.
=
l
(P
l.
+ P.
z- 1+P
z.
-2+
.
.. +P
z.
-x)
X
In the equation, i represents the current day, i-1 represents the day before
the current day, cJind i-x represents x days before the current day. Mx; represents
the x-day moving average at i
, the current point in time
. P; represents the price onthe current day, .·:-:1 H represents the price on the day before the current day, P ;-2
represents the pr\ce two days before the current day, and P ;-x represents the price
X days before the current day.
Taking Moving Average to Minutes
The standard moving averages used for the stock market are the 5O-day,
100-day, and 2O0-day moving averages. However, when this was tried with
cryptocurrency, the results were poor. Because of cryptocurrency 's volatile nature,
the moving average was far too large and did not trigger any buy or sell signals for
the algorithm. Therefore , the moving average periods have to be much shorter.
All of the algorithms detailed in this paper use a moving average increment
of less than ten days. Normally, an x-day moving average would only take in x
data points to cal-:ulate each moving average, as seen in the formula above. However, using merely ten data points is not likely to produce a very accurate result. This is because the fewer the data points in the moving average, the more sharply the average will change. This will result in the algorithm being less
accurate, leading to poor trading results.
To keep the moving average accurate and responsive to price changes without using a lcnger time increment, moving average values were taken in
increments of miPutes, rather than days. Several values were tried for moving
average increments in minutes, but the one used for a majority of the research
was 5-minute increments.
Using 5-m:nute increments means that a 1-day moving average will actually
be a 288-increment moving average, where each increment is five minutes.
Therefore, to calculate a 1-day moving average, the last 288 price points will be
taken over increments of five minutes, and those will all be added and divided by 288. This paper ~till refers to the strategies in terms of day increments, such as a
1-day moving average, instead of a 288 times 5-minute moving average. However,
when reading thi~:: paper, it is important to remember that every moving average is
actually done in increments of five minutes.
Simple Mo
v
ing Average Crossover
The first s~:·ategy used in this research is the Simple Moving Average
Crossover. This drategy is also the simplest strategy used in this paper, as it only
uses the moving S1verage and the current price.
The Simple Moving Average Crossover Strategy calculates the x-day
moving average Dnd compares it to the current price. Whenever the current price
crosses the the x~--day moving average, the algorithm will trigger a buy or sell
moving average to above the moving average, or vice versa. Since the moving average changes very slowly when compared to the current price, it is always said that the price crosses the moving average, instead of the moving average crossing the price.
The price crossing above the moving average is defined as an instance in time where the price is greater than the moving average and the price was less than the moving average in the last instance of time. Since the increments of time used in this research are five minutes, the price crossing above the moving
average refers to when the price is greater than the moving average but was less than the moving average five minutes before.
Conversely, the price crossing below the moving average is defined as an instance in time when the price is less than the moving average and the price was greater than the moving average five minutes before.
When the price crosses above the moving average, the Simple Moving Average Crossover algorithm will trigger a buy signal and the security will be bought. When the price crosses above the moving average, this predicts that the price of the security will continue to increase. This is because the moving average reacts slowly to the price's change, so any immediate change in price has the potential to bring the price above or below the moving average's value. Ideally, the moving average would be positioned properly so that most small changes in value do not cross the moving average's value and are filtered out by the algorithm. In this case, only big enough changes in the price's value will cross the moving average's line, triggering a buy or sell signal.
- price 350 moving average 300 250 200 150 100 50 25k 26k 27k 28k 29k 30k
Figure 1, shown on the previous page, plots the price against the moving average. The blue line represents the current price at each point in time, and the orange line represents the moving average value at each point in time. The y-axis represents the current price in United States Dollars, and the x-axis represents time. Each unit of time is a 5-minute interval, starting at 6:40pm on October 5,
2017. On the graph above, the x-axis values range from 25k to 30k. The value of 25k on the graph represents 25,000 5-minute intervals after 6:40pm on October 5,
2017, or 125,000 minutes after 6:40pm on October 5. Since there are 1,440 minutes each day, 125,000 minutes is approximately 89 days. Eighty-nine days after October 5, 2017, is January 2, 2018. The value of 30,000 on the right side of the graph represents 5,000 5-minute intervals, or 25,000 minutes after January 2,
2018. This is approximately 17 days, putting the 30k label on the x-axis around January 19, 2018.
The analogy of the price "crossing over" or "crossing under" the moving average can be seen here at any point where the two lines cross. It can be seen in the graph that the blue line changes much more than the orange line. That is because the actual price fluctuates greatly, while the moving average reacts much more slowly.
In Figure 1, the price crosses the moving average around an x-value of 27k. Since the price was greater than the moving average and then crossed below the moving average, this is a prediction that the price is heading down. The Simple Moving Average Crossover Strategy would sell Litecoin at that point in time in this scenario. When the two lines cross again, around the 28k mark on the x-axis, the price was above the moving average line and is crossing below the moving average line.
Since the algorithm would have sold around the 27k time and bought again around the 28k time, the user of the algorithm would not have had any holdings in Litecoin during that time and would have held only USO. This would have avoided much of Litecoin's drop in price during that time, since the algorithm would not own any Litecoin at the time of the drop in price.
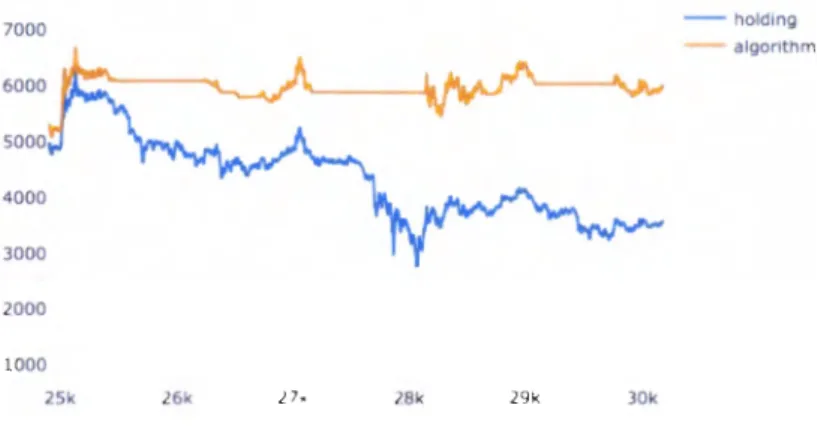
7000 6000 5000 4000 3000 2000 1000 25k 26k 27k 28k 29k 30k - holding algonthm
Figure 2. Algorithm (1.7-day mva) vs. holding Litecoin.
Figure 2, shown above, displays graph of the amount of money that a
person would have in two scenarios: the orange line represents the amount of money one would have when using the algorithm and the blue line represents the amount of money one would have merely holding Litecoin. Both scenarios assume
that the person had invested $1000 on October 5, 2017. The x-axis has the same
values as from Figure 1, from January 2 to January 19, 2018. Since the graph starts at 125,000 minutes after the initial $1000 was invested, both lines start on this graph much above that starting amount.
As can be seen in Figure 2, the line representing the algorithm's value is completely horizontal between the 27k mark and the 28k mark. This is because
the algorithm has all of its value in USO at that moment and nothing in Litecoin.
Therefore, any changes in Litecoin's price do not affect the algorithm and the
value held by the algorithm remains constant. This is the goal of the Simple Moving Average Crossover Strategy: to hold only cryptocurrency and no USO when the price of the cryptocurrency is going up, and to hold only USO and no cryptocurrency when the price of the cryptocurrency is going down.
Figures 1 and 2 show that this trading strategy can work well enough to enable the algorithm to outperform merely buying and holding a cryptocurrency. However, the algorithm is not perfect because it sells Litecoin after the price starts to decline and buys Litecoin again after the price has started to increase. Ideally, the algorithm would sell right as the price starts to decline and buy right as the price starts to increase. While no algorithm is perfect, the goal of this research has been to find an algorithm that will come as close as possible to selling right before a dip in price and buying right before a rise in price. The following strategies all are improvements on the Simple Moving Average Crossover that attempt to come closer to the ideal algorithm of perfect buying and selling.
Exponential Moving Average Crossover
As the name implies, the Exponential Moving Average Crossover Strategy is similar to the Simple Moving Average Crossover Strategy. The Exponential Moving Average Crossover Strategy is an improvement on the Simple Moving Average Crossover Strategy; it takes the same concept with respect to buying and selling when the price and moving average cross, but has a different formula to calculate the moving average at each increment of time.
A simple moving average is the moving average discussed in the "Moving Average" section above. The name is fitting, because it simply adds up the prices for a set number of days and then divides by the number of days. An exponential moving average improves on this strategy by putting more emphasis on
more-recent days. The simple strategy does not take into consideration how long it has been since the price was current, as long as the price is not beyond the
window of what it adds. The exponential strategy, however, puts more weight on more-recent prices and less weight on older prices.
In the equation, i represents the current point in time. i- 1 represents one time period (in this case, five minutes) before the current point in time. eMxi
represents the x-period exponential moving average at the current point in time.
eMxi-1 represents the exponential moving average five minutes before the current point in time. Pi represents the price at the current point in time. Finally, x
represents the number of time periods taken into consideration for the moving average. Since there are 1,440 time periods each day, a 1-day moving average would have result in an x-value of 1,440 for this equation.
This is a recursive equation, meaning that each iteration of the equation builds on the previous iteration. Purely using this equation doesn't allow for the very first value to be calculated. The very first value is eMxx, since there have not been enough data points on every time instance before time instance x to
determine a moving average. For the very first value, eMxx , a simple moving average will be used. For every instance of time after the first value, the exponential moving average formula will be used to calculate it.
To show how an exponential moving average weights the values toward more recent instances in time, a 5-interval moving average will be used. In a simple moving average, the prices of the last five time intervals are added up and the sum is divided by 5. Therefore, each price has a 20% influence on the moving average. With an exponential moving average the multiplier on the most recent price is
xi
1 , where x is the number of intervals used in this exponential movingaverage. In this example, the number of intervals is 5, so the multiplier is 5
i
1 =½
,
thus the latest price has a 33% multiplier. Because of how the recursive formula is set up, the weighting on each value slowly diminishes as the values become less recent.Mean Reversion
The Mean Reversion Strategy is another improvement on the Simple Moving Average Crossover Strategy, but with a very different approach from the Exponential Moving Average Crossover Strategy. The exponential moving average attempted to improve the simple moving average by making a better moving average that would follow the changes in price more closely. The Mean Reversion Strategy still uses the simple moving average, but it attempts to predict the price's decline before the price's value crosses below the moving average's value. It also attempts to predict the price's rise before the price's value crosses above the moving average's value.
The Mean Reversion Strategy accomplishes this testing the price against two other values, instead of testing against the moving average. These two values are known as the upper bound and lower bound. The upper bound is placed a certain amount above the moving average line and the lower bound is placed a certain amount below the moving average line.
In addition to the moving average value, the Mean Reversion Strategy has another value called the offset. The offset is the amount that the bounds are offset from the moving average. For example, if the offset is x, then the upper bound will be at (100 + x)% of the moving average, and the lower bound will be at
- price
350 moving average
- upper bound
- lower bound
100
50
25k 26k 27k 28k 29k 30k
Figure 3. Mean Reversion on Litecoin's price with a 1.7-day mva. In Figure 3, shown above, the blue line represents Litecoin's price. The orange line represents the 1. 7-day moving average using 5-minute time intervals. The green line represents the upper bound with a 3% offset (103% of the moving average). The red line represents the lower bound at 97% of the moving average.
As can be seen on the graph, the price will cross the upper bound sooner after the price starts to decline than the moving average crossed. The same is also true with the lower bound: using the lower bound will detect a rise in price sooner than only using the moving average.
Mean Reversion is commonly used when a security's price has fluctuations but returns to a similar price between fluctuations. This is where the name is from: the fact that the price of the security reverts to the mean. While cryptocurrency prices are extremely volatile and not the stable price that mean reversion would expect, this research attempted to determine if doing mean reversion on a small enough scale could be profitable. The reasoning behind this idea is that, even though the price is volatile, it is relatively stable in small enough time periods.
Pairs Trading
All of the strategies discussed so far trade only one cryptocurrency back and forth with USO. At any point in time, the algorithm either has all of its value held in the cryptocurrency, or all of its value held in USO. These strategies attempt to gain value by holding the cryptocurrency when its price is increasing and they attempt to avoid losses by holding USO when the cryptocurrency's price is decreasing. However, they make no attempt to gain value when the
This is where the Pairs Trading Strategy attempts to be different: it tries to find two cryptocurrencies that follow opposite trends. This way, if one
cryptocurrency is rising while the other is falling and vice versa, the strategy can be gaining value almost all the time. The idea of the strategy is to perform a Mean Reversion Strategy, but instead of doing a mean reversion on the price, a mean reversion on the difference in prices is performed. At the beginning of the
algorithm, the cryptocurrencies with the higher and lower prices are determined. Then, every time the mean reversion is calculated, the price is substituted with the difference between the higher and lower prices.
Mean reversion is used because the idea is that the difference in price will fluctuate but eventually return to the mean. The term cointegration refers to a situation when one of the securities' prices has an effect on the other. This means that a rise in one price will cause a fall in the other price, or vice versa. If the two securities' prices are truly cointegrated, this pairs trading strategy will work well.
Several tests can be used to determine how cointegrated two prices are. Three of the tests for cointegration include the Dickey-Fuller Test, the Augmented
Dickey-Fuller Test, and the Johansen Cointegration Test. These are very important when finding usable pairs in the stock market, since the number of possible pairs is so large. It would require too much time to run the actual algorithm with every possible pair, so a test is needed to find good pairs.
However, when using only the top five cryptocurrencies , there are only
C~
=
10 possible pairs. Therefore, there was no need to test each pair forcointegration when the actual algorithm could be tested on each pair easily. Each pair was tested and the effectiveness of the algorithm on each pair was used to determine the cointegration of the pair.
Data Collection
Data was collected between October 5, 2017 and January 24, 2018. Every five minutes, the following values were recorded: the rank of the cryptocurrency compared to the other cryptocurrencies (measured by total market cap), the price of the cryptocurrency in USO, the price of the cryptocurrency in Bitcoin, the
24-hour trading volume of the cryptocurrency, the cryptocurrency's market cap, the available supply, the total supply, the cryptocurrency's percent change in the last hour, the last 24 hours, and the last seven days. Only the cryptocurrency's USO price was used in this research, but all the others values were recorded for potential use in future research.
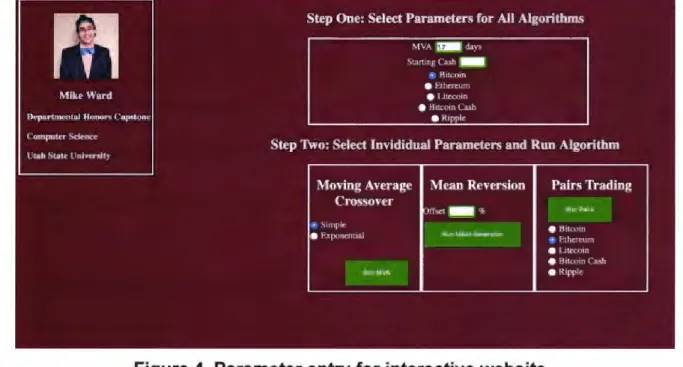
Interactive Website
To publicly display the results of the algorithms, an interactive website is
available at http://capstone.mikethebro.com. The website is divided into three
sections. The first section has parameters required for all of the algorithms:
moving average increment (entered in multiples of days, with precision to one
decimal place}, the starting cash amount, and the desired cryptocurrency. The
second section has three individual sections, one for each algorithm. In order to
select an algorithm, all the sections must be filled out in the box for the selected
algorithm. Once all the user selects all the appropriate parameters and pushes the
"Run [name of algorithm" button, the results will be displayed below.
Mike Ward Departmental Honors ('np.liitone ('.omputt>r Science
lltah Stute t:niver--.ity
M\A !DIii days
Startmg(ash -• H1li:om • Ethercum e1 .1te,1,;om e H1tcom( a\h e Ripple
Step Two: Select lnvididual Parameters and Run Algorithm
Moving Average Mean Reversion Pairs Trading Crossover :iJff,;et- ~ "'-'" P,1111 S1mplr e Hilcrnn e ExpoOt'nllal Aul'I-..HnU...•l'flMM Ethrn:um e l.ita:om • Hill'.Oln Ca.-.h lllat~V.\ e Ripple
Figure 4. Parameter entry for interactive website.
Once the user selects and runs the algorithm, two graphs will appear below.
The first graph will show the price compared to the moving average, with slight
differences depending on the algorithm selected. If a mean reversion is selected,
the graphs will also show the upper and lower bounds to the moving average. If
pairs trading is selected, no graph will display in this section.
The second graph shows the difference in value between trading with the
algorithm compared to buying and holding the cryptocurrency. For pairs trading,
first cryptocurrency, when only trading the second cryptocurrency, and when using the algorithm.
In both graphs, the y-axis represents value in USO. The x-axis represents
time in both graphs, with each unit being equal to five minutes. The point for O on
the x-axis is October 5, 2017 and the rightmost point (around 30k) is January 24, 2018.
, Stq, Thru: View ResnllS
Price and Moving Avenge
,,
,
.
.
Algorltbm vs. Holdln2
Results
All of the results are viewable at http://capstone.mikethebro .com. Since there are so many possible combinations of algorithms to run, it is not practical to list them all in this document. To view the results, follow the instructions in the "Interactive Website" section above. The performance of the algorithm will be viewable in the second graph.
When viewing the results online, keep in mind that trading fees are not included in the returns. Trading fees vary greatly by the broker and exchange used, so it was not practical to include them in the calculations. With smaller MVA values, trades will occur more often and more trading fees will be needed. For example, trading Bitcoin with a 0.1-day moving average has returns about three times the returns when trading Bitcoin with a 9.0-day moving average. However,
trading with a 0.1-day moving average will also trade much more often than a 9.0-day moving average, resulting in higher trading fees.
Conclusion & Future Research
Many of the algorithms described proved to be very profitable. However, it is important to keep in mind that cryptocurrency is extremely volatile and has seen a massive increase in price over the last year. Since cryptocurrency has gained so much value recently, all results displayed on the interactive website are measured in how profitable the algorithm was compared to buying and holding the
cryptocurrency. Overall, all of the algorithms tested in this research
can
be extremely profitable. All of the algorithms described in this paper will greatly outperform buying and holding, but only if the proper parameters are used. All of the algorithms will underperform buying and holding if poor parameters are selected.All of the algorithms can be improved upon to become even more successful. Future research will focus on finding new algorithms, improving on existing algorithms, and changing the items traded. One key improvement on the current research will be to change the algorithms to trades futures and options in addition to purely trading securities.
Reflection
Word count: 1154
The following few pages describe a reflection of my experience within
honors. Unlike the rest of the document, this part will be written in first person, as it
is a personal account of my struggles and accomplishments during my five years within the Utah State University Honors Program, as well as the lesson that I
learned during that time.
The beginning: applying to Honors
My original reason for applying to the honors program was to give me a competitive edge against other candidates when applying to graduate school or to employment. I believed that having an honors distinction on my transcript would
give me a better chance at reaching those goals. What I did not think about,
however, was how the actual knowledge learned within my time with the honors program would impact my career and how that knowledge and experience would
benefit my career.
Now that I am so close to completing my degree and have already been
hired for a job, I look back on this and realize that the actual distinction on my
transcript is far less important than the experience gained within the program.
When at all of my job interviews, the interviewers rarely ever mentioned the fact
that my resume mentioned the honors program; they, however, asked many
Capstone: choosing the topic
The most difficult part to me of the Capstone project was what might seem to most people to be the easiest step of the process: choosing the topic. There were no topics that appeared obvious to me, and I spent many weeks pondering over different topics. I talked with the other students in my HONR 3900 class and this was discouraging since they all had topics picked out. I eventually decided to pick a topic that was doable but didn't interest me much.
However, less than a week before the proposal was due, a random event happened that helped me to find a topic that I was passionate about. I met one of the Computer Science teachers, Professor Andy Brim. This happened outside of any classes or academic events; I met him while lost in Old Main.
I began talking with him and, as he told me about his research topics, I became very interested. He told me about how he writes algorithms to trade stocks automatically and determine the optimal buying and selling times. I always had an interest in the stock market and this fascinated me. I quickly changed my capstone proposal and submitted right before the deadline. More importantly, this taught me a very important lesson: that the best opportunities most often come through networking, and very often come completely randomly.
Capstone: beginning work and changing ideas
The next lesson that I learned is the importance of flexibility. My project originally started doing research in the exact same field as my professor:
algorithms to trade in the stock market. However, as I learned about Bitcoin and other cryptocurrencies, this topic fascinated me and I decided to completely switch my research topics. At first I was hesitant about this change, since I had several months of research already completed, but the topic was too interesting to me. I abandoned my results and took the topics I learned from the stock market to cryptocurrency trading. I soon realized that the setback I had from changing topics was completely worth it. Stock market trading is a very common research topic and has been published by many authors. Cryptocurrency trading, however, is a very new field and has not been explored much. By being flexible and open to changing my topic, I found ideas that I would never have thought about before.
Capstone: reflecting
Now that the capstone research is complete and the final product is almost submitted, I can reflect back on the entire process and realize how different this is from what I originally anticipated. My initial capstone project idea was to talk with project managers in the computer software industry and take their ideas to a project that I would manage. My capstone project ended up as research into the effectiveness of taking algorithmic trading principles from the stock market into the realm of cryptocurrency. I would never have imagined that my research could have
taken me to areas I had no experience in. When I was originally selecting topic
ideas, I had no experience with algorithmic trading and had never even heard the
word cryptocurrency! This taught me the importance of being flexible to new ideas
and reacting quickly when I saw a good opportunity.
Reflecting on the Honors Program experience
The USU Honors Program website states that its goal is to bring academic knowledge to a practical setting, and it did just that. All academic projects that I
completed up until this point have been in classes, and therefore a maximum of
one semester in length. When including the time choosing a topic, planning,
completing research, and writing the final report, the capstone took about two
years to complete. This is roughly six times longer than a standard class but is so
much more similar to a real-world scenario. In industry, or in graduate school,
projects almost always last longer than four months. However, an undergraduate
who merely takes classes will never experience projects of this length.
The Honors Program also helped me to become more familiar with
approaching and interacting with professors. I have developed strong relationships
with many professors as a result of completing four honors contracts and the capstone project. These relationships with professors have helped me to see
research and academia in a very different way. The word "research" used to scare
me because I thought it was a very long, complicated, and intense process. After
complicated, and at some point discouraging, it is possible and is well worth the effort. This leads into the final lesson that I learned in the honors program: almost anything is possible if you put your mind to it. There are some tasks that can be very challenging, such as completing an undergraduate capstone project, but any task can be accomplished by breaking it into small enough parts and mastering each of those individual parts. By viewing a major project as a sum of all the small parts within it, the entire project becomes much more manageable.
My final advice for new students entering the honors program is to start early on everything but to be flexible to change. If I had started talking to professors about my research as a freshman, I would have had so much more time to discover research topics. One more word of advice is that almost all
professors want to meet and work with students. All that is required is to approach the profesor; they will almost always love to talk with you!
Biography of the Author
Michael Ward is a senior graduating from Utah State University. He is graduating with a degree in Computer Science, minors in Mathematics and Business, and departmental honors. While an undergraduate student, he worked as a software developer at the Space Dynamics Laboratory for two and a half years. He also worked part time writing software for a local startup called
Brenkman and Company. These two jobs, combined with research experience in the honors program, have provided him with a very well-rounded education and have prepared him for the many challenges ahead in industry. He has accepted a job as software developer at Lucid in South Jordan and will be working with Scala and Typescript as he helps to incorporate Microsoft Visio support into Lucidchart.