Abstract: In “Flash Boys: A Wall Street Revolt”, Lewis wrote "The market is rigged" by HFT traders who front run orders placed by investors. Indeed, if makers cannot win by getting a good price, they will win by speed. In this paper, we focus on the foreign exchange market. Although they are OTC markets where each brokers managed their inventory separately and as such each quoting a slightly different bid-ask spread, an emerging trend is that more brokers are providing ECN accounts for retail investors. Users of ECN accounts receive their pricing from a pool of large liquidity providers and hence there are smaller price discrepancies. That said, we are not just trading with other retail traders but also dealers from banks who provide these liquidity. They make a market with an advantage of being fast and access to the market depth of their clients. Building a trading bot will increase the speed and accuracy of our trade execution and hence, enhance our chance of survival in the competitive world of trading.
Keywords: Trading Systems
1. Motivation
The foreign exchange market is the most liquid and lucrative market, where trillions of currencies worth are traded daily. Yet because of its high liquidity, traders are susceptible to perils of overtrading which decreases their profit factor. A recent research study undertaken by Ph.D. researcher John Forman, reveals that 99.6% of retail Forex traders are unable to achieve more than 4 back-to-back profitable quarters. Sound strategy or not, losses are apparently inevitable. Yet we cannot deny that there are still 0.4% of successful discretionary traders.
Looking at Expert Advisors Market at MQL5 (https://www.mql5.com/en/market), we see that based on “historical” back testing, there are some systems which can more than breakeven. It could be curve fitting to historical data and so may not hold its good performance into the future. Nevertheless, it is an interesting topic to explore on how trading systems are developed. To simplify and narrow the scope on this limited paper, we will focus on a simple trading system on USD/JPY, neglecting other major and cross pairs and their relationships with one another.
2. Background of USD/JPY
Firstly, we need to recognise that USD/JPY is a safe haven currency as JPY has a near zero interest rate and hence is a good currency for financing. Due to low yield of JPY, if there is major unrest in other parts of the world (e.g. such as the outbreak of Ebola), investors will shift their funds from riskier, higher yielding currencies such as AUD or NZD into JPY. This will often cause large fluctuation in the value of USD/JPY. US Dollar is sensitive to major economic events such as Non-Farm Payroll, Federal Open Market Committee meetings and unemployment claims. These indicators vary over time, depending on what is the goal of the central banker. Thus, it is safer to stop the systems before such important events.
Algorithmic Trading: A Quantitative Approach to
Developing an Automated Trading System
Luqman-nul Hakim B M Lukman, Justin Yeo Shui Ming NUS Investment Society Research (Quantitative Finance)
Secondly, it is the second most widely traded pair and accounts for 18.3% of transactions, hence its spread is consistently low and good for automated trading on tick. However, the start of the first hour after a weekend has inconsistent and unusually high spread at times.
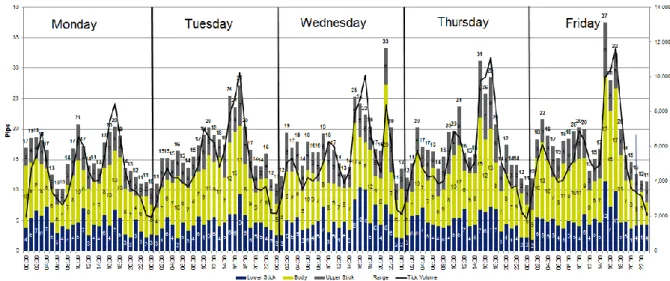
Thirdly, we need to recognise the realistic expectation of movement in USDJPY and we did it by looking at historical data of the last 6 months from August 2014 to February 2015.From figure 1, we observed that there is hourly seasonal pattern in both liquidity (tick volume) and price movement (lower stick, body, upper stick), regardless of direction. There is clearly a surge in liquidlity when 2100 GMT+8 arrives, sometimes an hour before. Liquidlity and price movement are larger coming end of the week, especially Thursday and Friday. Generally, the higher liquidity and capital flows into the pair generate larger price movements. These could be good filters and targets for our trading systems.
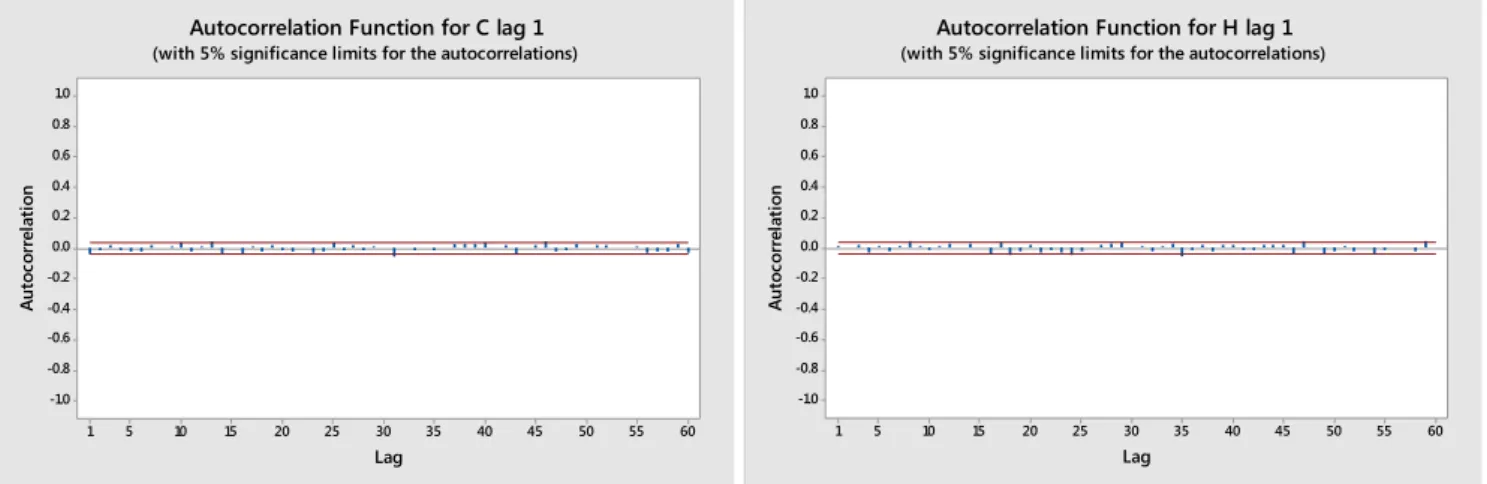
Figure 1: USD/JPY Weekly View. Time is GMT+2 compared to Singapore’s GMT+8. Hence we add 0600 hours to the ones we observed Fourth, we want to explore if there is any autocorrelation between the time series data. From Figure 2, lag in 10, 12, 14, 25 and 30 days failed the t-test and exceeded the 95% confidence interval, implying that there is possibly some relationship between daily close price at such intervals. From Figure 3, hourly intervals of 4, 8, 16, 18 and 24 failed the t-test and exceeded the
60 55 50 45 40 35 30 25 20 15 10 5 1 1.0 0.8 0.6 0.4 0.2 0.0 -0.2 -0.4 -0.6 -0.8 -1.0 Lag A ut oc or re la ti on
Autocorrelation Function for H lag 1 (with 5% significance limits for the autocorrelations)
60 55 50 45 40 35 30 25 20 15 10 5 1 1.0 0.8 0.6 0.4 0.2 0.0 -0.2 -0.4 -0.6 -0.8 -1.0 Lag A ut oc or re la ti on
Autocorrelation Function for C lag 1 (with 5% significance limits for the autocorrelations)
confidence interval implying that there is possibly some relationship between hourly closing price at such intervals. These could be good estimates for our trading systems parameters.
3. Types of Trading Systems
To create a good trading system, one needs a good understanding of the trading instrument and it is beyond the scope of this limited paper. In general, products are developed for certain group of investors for specific needs. That means the instrument exhibits unique characteristics. Some of these may then be exploited in a trading system. A trading system could be simple or complicated, but a basic one comprises a few functions: entry and exit signals (including target profit and stop loss), filters on entry; position sizing on entry and exit, and risk management. The objective is to utilize a trading strategy that has an edge over other participants of the market and that suits the trader’s needs. Depending on one’s risk profile, it is recommended to take a 2% risk on each trade. Professionals have proven that good entries ensure that you have a good safety margin and hence experience a lower drawdown. However, a volatile market can change a winning position to a losing one in seconds and thus, a stop loss is imperative. Managing the trade is actually more important than the entry itself. Target profits are important because the difference between closing a position on hitting target profit and hitting a stop loss is very big. Filters are subjective depending on the instrument you are trading but are also the factor that adds the most value to the trading system. In this example, we will use a simple breakout strategy for USDJPY.
Simple Breakout (24) system Timeframe: 1 Hour Currency Pair: USD/JPY
Breakout HH-LL Look back Period: 24 Stop Loss: 20 pips
Target Profit: 100
Volume: 10,000 (0.1 Standard Lot) Starting Capital: USD 10,000 Spread: 0.5 pips (consistent average)
Back testing period: 1-April-2011 to 31-Jan-2015
70.00 80.00 90.00 100.00 110.00 120.00 2011 .04. … 2011 .05. … 2011 .06. … 2011 .07. … 2011 .09. … 2011 .10. … 2011 .11. … 2012 .01. … 2012 .02. … 2012 .03. … 2012 .04. … 2012 .06. … 2012 .07. … 2012 .08. … 2012 .10. … 2012 .11. … 2012 .12. … 2013 .01. … 2013 .03. … 2013 .04. … 2013 .05. … 2013 .07. … 2013 .08. … 2013 .09. … 2013 .10. … 2013 .12. … 2014 .01. … 20 14 .02 .… 2014 .04. … 2014 .05. … 2014 .06. … 2014 .08. … 2014 .09. … 2014 .10. … 20 14 .11 .… Cl o se
USD/JPY Price Chart April 2014 - Jan 2015
Equity Curve:
Trading Statistics for USD/JPY
Summary All Trades
Net Profit $ 849.13
Profit Factor 1.18
Max Balance Drawdown 5.61%
Total Trades 458
Winning (%) 41%
Max Consecutive Winning Trades 6 Max Consecutive Losing Trades 8 Largest Winning Trade $ 86.10 Largest Losing Trade $ -75.17
Average Trade 1.85
Sharpe Ratio 0.06
In summary, this strategy produces good results when the market is trending as seen from the price chart. However, the system failed to make progress when the market ranges: the maximum number of consecutive losing trades was 8. Overall, profit factor is 1.18 and max equity drawdown was 6.77%. Sharpe Ratio or reward-to-variability is 0.06 which means a risk-adjusted return of 6%. Interested
readers can think of further ways to further improve this strategy, e.g. by varying the look back period or by incorporating further filters to reduce the number of trades when market is ranging.
![Dibenzo[b,e]thiepin 11(6H) one](data:image/gif;base64,R0lGODlhAQABAIAAAP///wAAACH5BAEAAAAALAAAAAABAAEAAAICRAEAOw==)