The use of 1050nm OCT to identify
changes in optic nerve head
pathophysiology in glaucoma
A thesis submitted to Cardiff University for the degree of
Doctor of Philosophy
Bethany Esther Frost
School of Optometry and Vision Sciences,
Cardiff University
ii
Declaration
DECLARATION
This work has not been submitted in substance for any other degree or award at this or any other university or place of learning, nor is being submitted concurrently in candidature for any degree or other award.
Signed ………. Date 10/05/16
STATEMENT 1
This thesis is being submitted in partial fulfilment of the requirements for the degree of PhD
Signed ………. Date 10/05/16
STATEMENT 2
This thesis is the result of my own independent work/investigation, except where otherwise stated. Other sources are acknowledged by explicit references. The views expressed are my own.
Signed ………. Date 10/05/16
STATEMENT 3
I hereby give consent for my thesis, if accepted, to be available for photocopying and for inter-library loan, and for the title and summary to be made available to outside organisations.
Signed ………. Date 10/05/16
STATEMENT 4: Previously approved bar on access
I hereby give consent for my thesis, if accepted, to be available for photocopying and for inter-library loans after expiry of a bar on access previously approved by the Academic Standards & Quality Committee.
iii
Acknowledgements
Firstly I would like to thank my supervisors, Dr Julie Albon and Prof Rachel North, for their constant help, support and guidance throughout this PhD.
Thank you to the College of Optometrists, for their financial support, without them this work would not have been possible. Additional thanks are given for the travel bursary that allowed me to present some of this work at ARVO.
Thank you to Dr Katie Mortlock, for her support and friendship throughout my time in Cardiff, and for help with this project.
Thank you to all the friends and office mates I’ve had during my PhD, particularly everyone in Room 2.11. It would have been a lot harder without you. Thank you to Sue, Judith and Leanne, for always being there when things weren’t going quite right and for being calm with helpful advice.
iv
Abstract
Glaucoma is a progressive optic neuropathy that causes irreversible vision loss and is the second leading cause of blindness worldwide. Glaucoma is characterised by loss of retinal ganglion cells (RGC) and the proposed site of primary damage is the lamina cribrosa (LC), where RGC axonal transport is disrupted causing subsequent RGC damage and eventual cell death. Current detection for primary open angle glaucoma (POAG) is based upon clinical measures such as intraocular pressure (IOP), visual field loss and changes to the optic nerve head (ONH). However, for there to be an indication that there is a problem using these measures, often RGC damage has already occurred. Therefore it is crucial to determine ocular parameters that alter in the earliest stage of disease, prior to vision loss occurring.
In this thesis optical coherence tomography (OCT) was used to assess the optic nerve heads and maculae of control eyes and eyes with preperimetric, early and advanced glaucoma in order to characterise changes that could potentially be used as biomarkers for the earliest stages of the disease. A custom built 1050 nm research OCT was used to acquire datasets from the macula and optic nerve heads of eyes glaucomatous and control eyes in vivo. Analysis of the inner retinal layers at the macula was performed to indirectly assess RGC integrity. At the ONH the prelamina and LC volume and regional depth and thicknesses were investigated. Additionally, nerve fibre layer and Bruch’s membrane parameters were assessed. Finally, LC beam coherence and orientation were probed in order to determine whether regional or glaucomatous changes ould be detected at the LC connective tissue microstructure.
Prelamina depth and thickness was shown to be an indicator of early and preperimetric glaucoma (p<0.01), although the volume of the prelamina did not change with increasing stage of glaucoma (p>0.01). Border nerve fibre layer revealed significant thinning in early glaucoma compared to control, and the superior peripapillary nerve fibre layer was thinner in preperimetric glaucoma than control. The ratio of inner plexiform layer (IPL) : ganglion cell layer (GCL) showed significant differences between control eyes and preperimetric glaucoma, and as such has potential to be a useful biomarker for indicating the earliest stages of disease. Both the GCL and IPL were thinner in early glaucoma than control (p<0.01), a hypothesis that cell body shrinkage and death occurs in preperimetric glaucoma and dendritic loss occurs in early glaucoma, when vision loss is first apparent, is suggested. Additionally, LC beams showed greater coherence in the superior and inferior poles than the temporal region, indicating that the shows regional variation but that further research is required to characterise changes.
In conclusion, 1050 nm OCT was used to probe microstructural parameters of the optic nerve head in vivo to characterise changes that could be used as a potential biomarker for early glaucoma. ONH and retinal parameters have been identified that, with further research, may be used to differentiate between control eyes and those with preperimetric and early glaucoma. These have the potential to help identify those ONHs at risk of glaucoma damage.
v
Table of contents
Declaration ……….. ii Acknowledgements ………..……… iii Abstract ……….. ix Table of contents ………..………. ivList of figures ………..………. xvi
List of tables ………..……….xxiv
1 Introduction ... 2
1.1The structure of the optic nerve head ... 2
1.1.1Prelamina ... 3
1.1.2Lamina cribrosa ... 4
1.1.3Postlaminar Optic Nerve ... 6
1.2The structure of the retina ... 7
1.3The aging optic nerve head ... 8
1.3.1Aging of the optic nerve ... 8
1.4Glaucoma ... 9
1.4.1The role of intraocular pressure in glaucoma ... 11
1.4.2Visual field loss in glaucoma ... 11
1.4.3Optic nerve head changes in glaucoma ... 12
1.4.3.1Changes to the Lamina Cribrosa in Glaucoma ... 13
1.4.4Damage to the retina in glaucoma ... 14
1.4.5Theories of glaucoma ... 15
1.4.6Mechanical theory of glaucomatous damage ... 16
vi
1.4.8Glaucoma detection in vivo ... 19
1.5Optical Coherence Tomography ... 20
1.5.1Theory of optical coherence tomography ... 20
1.5.2Types of OCT Device ... 21
1.5.2.1Time Domain OCT... 22
1.5.2.2Spectral Domain OCT ... 22
1.5.3The wavelength of the OCT source and its effect on ocular imaging ... 23
1.5.4Recent development to improve OCT imaging ... 24
1.6The use of OCT to assess and monitor the eye during glaucoma ... 26
1.6.1OCT to image the ONH ... 26
1.6.2The use of OCT to measure macula parameters in glaucoma ... 27
1.7Hypothesis and aims of this study ... 28
2 Methods ... 31
2.1Ethics ... 31
2.2Participant recruitment ... 31
2.3Data acquisition ... 32
2.3.1Clinical assessments ... 32
2.3.2Optical Coherence Tomography ... 33
2.4Data processing ... 34
2.4.1Flow chart of stages of data and image processing ... 34
2.4.2Spectral OCT data processing ... 35
2.4.3Image processing ... 36
2.4.4Image scaling and pixel calibration………... 39
2.4.4.1Transverse pixel calibration ... 39
2.4.4.2Transverse scaling according to axial length ... 41
vii
2.4.5Scaling according to calculated pixel values ... 42
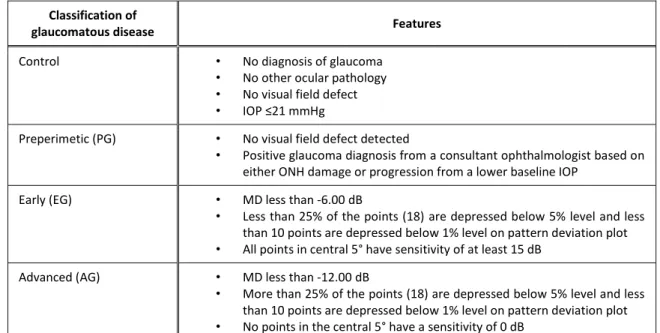
2.4.6Criteria for classification of optic nerve heads and maculae into stages of glaucoma .. 42
2.4.7Orientation of the OCT datasets ... 43
2.5Analysis of the inner retinal layers in glaucomatous and healthy eyes ... 44
2.5.1Manual image segmentation ... 44
2.5.2Classification of eyes according to stage of glaucoma ... 45
2.5.3Colour-coded thickness maps ... 45
2.5.4Regional analysis of retinal layer thickness and volume... 46
2.5.5Repeatability of retinal segmentation technique ... 47
2.6Analysis of the optic nerve head in aging and glaucoma in 2D OCT images ... 49
2.6.1Repeatability of 2D optic nerve head measurement technique ... 54
2.73D volumetric measurements of the optic nerve head in glaucomatous and healthy subject 55 2.8Microstructural analysis of the lamina cribrosa in healthy and glaucoma eyes ... 61
2.9Statistical analysis ... 63
2.9.1Model structure ... 64
2.9.2Model optimisation ... 65
2.9.3Model assumptions ... 66
2.9.4Model interpretation ... 66
3 Analysis of the inner retinal layers in glaucomatous and healthy eyes ... 69
3.1Introduction ... 69
3.2Aim of study ... 70
3.3Experimental Design ... 70
3.3.1Participants ... 70
3.3.2Clinical assessments ... 71
3.3.3OCT data and image processing ... 71
viii
3.3.5Generation of colour-coded thickness maps of inner retinal layers ... 72
3.3.6Regional analysis of retinal layer thickness and volume... 73
3.3.7Statistical analysis ... 73
3.4Results ... 74
3.4.1Colour coded thickness maps of the inner retinal layers for control and glaucoma ... 74
3.4.2Quantitative thickness and volume measurements of inner retinal layers ... 76
3.4.3Comparative analysis of macula thickness and volume of regions at equal eccentricity from the fovea in each disease stage categories ... 76
3.4.4Ganglion cell complex thickness and volume in control and different staged glaucoma macula ... 79
3.4.4.1Comparative analysis of regional ganglion cell complex thickness ... 79
3.4.4.2Inter-stage differences in ganglion cell complex volume ... 81
3.4.5Inter stage differences in macula nerve fibre layer thickness and volume ... 81
3.4.5.1Comparative analysis of regional macula nerve fibre layer thickness... 81
3.4.5.2Inter-stage differences in macula nerve fibre layer volume... 83
3.4.6Inter stage differences in ganglion cell layer thickness and volume ... 86
3.4.6.1Comparative analysis of regional ganglion cell layer thickness ... 86
3.4.7Inner plexiform layer thickness and volume in different glaucoma disease stages ... 89
3.4.7.1Comparative analysis of regional inner plexiform layer thickness ... 89
3.4.7.2Inter-stage differences in inner plexiform layer volume ... 91
3.4.8Differences in the ratio of inner plexiform layer to macula nerve fibre layer in control and increased stages of glaucoma ... 91
3.4.9Differences in the ratio of inner plexiform layer to ganglion cell layer in control and increased glaucoma stages ... 94
3.4.10Summary of results….………. 96
3.5Discussion ... 96
3.5.1Limitations of study ... 103
ix 4 Analysis of age related changes in in vivo human optic nerve head microstructure . 106
4.
1
Introduction ... 1064.1.1Aims of the study... 107
4.2Experimental design ... 108
4.2.1Participants ... 108
4.2.2Clinical assessments ... 108
4.2.3Optical coherence tomography ... 108
4.2.42D Image analysis of optic nerve head microstructure ... 109
4.2.5Statistical analysis ... 109
4.3Results ... 110
4.3.1The effect of age and other ocular parameters on Bruch’s membrane opening diameter…………. ... 110
4.3.1.1Quantification of Bruch’s membrane opening diameter ...111
4.3.1.2Multivariate analysis of Bruch’s membrane opening diameter ...112
4.3.1.3The effect of age on Bruch’s membrane opening diameter ...113
4.3.1.4Other factors that contribute to explain membrane opening diameter ...113
4.3.2The effect of age and other ocular parameters on the peripapillary and border nerve fibre layer thickness ... 115
4.3.2.1Quantification of nerve fibre layer parameters ...115
4.3.2.2Univariate analysis of nerve fibre layer parameters ...116
4.3.2.3Multivariate analysis of nerve fibre layer parameters ...116
4.3.2.4The effect of age on nerve fibre layer parameters ...116
4.3.2.5The effect of other ocular parameters on the nerve fibre layer ...120
4.3.3The effect of age and other ocular parameters on the prelamina... 121
4.3.3.1Quantification of prelamina parameters ...122
4.3.3.2Univariate analysis of prelamina measurements ...123
x
4.3.3.4The effect of age on prelamina parameters ...125
4.3.3.5The effect of other ocular parameters on the prelamina ...128
4.3.4The effect of age and other ocular parameters on the lamina cribrosa ... 129
4.3.4.1Quantification of lamina cribrosa parameters ...130
4.3.4.2Univariate analysis of lamina cribrosa parameters ...131
4.3.4.3Multivariate analysis of lamina cribrosa parameters ...133
4.3.4.4The effect of age on lamina cribrosa parameters ...137
4.3.4.5The effect of other ocular parameters on the lamina cribrosa ...138
4.3.5Summary of results ... 139
4.4Discussion ... 140
4.4.1The effect of age on Bruch’s membrane opening diameter ... 142
4.4.2The effect of age on the nerve fibre layer thickness ... 143
4.4.3The effect of age and ocular parameters on the prelamina ... 144
4.4.4The effect of age on the lamina cribrosa ... 147
4.4.5Axial length ... 150
4.4.6Limitations of the study ... 150
4.4.7Conclusion ... 151
5 2D optic nerve head parameters as a function of glaucoma ... 153
5.1Introduction ... 153
5.1.1Aims of chapter ... 154
5.2Experimental design ... 154
5.2.1Subjects ... 154
5.2.2Clinical assessments ... 155
5.2.32D Image analysis of optic nerve head microstructure ... 155
5.2.4Statistical analysis ... 156
xi
5.3.1BMO diameter as a of glaucoma disease stage... 157
5.3.1.1Changes in Bruch’s membrane opening diameter as a function of visual field progression……… ...158
5.3.1.2Quantitative analysis of Bruch’s membrane opening diameter for different glaucoma disease stage...159
5.3.1.3Multivariate analysis of Bruch’s membrane opening diameter for different glaucoma disease stage...159
5.3.1.4The effect of glaucoma on Bruch’s membrane opening diameter ...162
5.3.2Changes in peripapillary and border nerve fibre layer thickness as a function of glaucoma... 162
5.3.2.1Changes in nerve fibre layer thickness as a function of visual field loss...163
5.3.2.2Quantitative analysis of nerve fibre layer parameters for stages of glaucoma ...163
5.3.2.3Multivariate analysis of nerve fibre layer parameters in glaucomatous eyes ...164
5.3.2.4The effect of stage of glaucoma on peripapillary and border nerve fibre layer thickness..166
5.3.3The effect of glaucoma and other ocular parameters on the prelamina ... 172
5.3.3.1Changes in prelamina parameters as a function of visual field progression ...172
5.3.3.2Quantitative analysis of prelamina parameters as a function of glaucoma stage ...173
5.3.3.3Multivariate analysis of prelamina parameters in glaucomatous eyes ...173
5.3.3.4The effect of stage of glaucoma on prelamina depth ...178
5.3.4The effect of glaucoma and other ocular parameters on the lamina cribrosa ... 182
5.3.4.1Changes in lamina cribrosa parameters as a function of visual field progression ...183
5.3.4.2Quantitative analysis of lamina cribrosa for stages of glaucomatous progression ...185
5.3.4.3Multivariate analysis of lamina cribrosa parameters in glaucomatous eyes ...186
5.3.4.4The effect of stage of glaucoma on the lamina cribrosa ...191
5.3.4.5The effect of stage of glaucoma on lamina cribrosa thickness ...193
5.3.5Summary of results ... 196
5.4Discussion ... 198
5.4.1The effect of glaucoma and other ocular parameters on Bruch’s membrane opening diameter ... 198
xii
5.4.2The effect of glaucoma and other ocular parameters on the peripapillary and border
nerve fibre layer ... 199
5.4.3The effect of glaucoma and other ocular parameters on the prelamina ... 203
5.4.4The effect of glaucoma and other ocular parameters on the lamina cribrosa ... 207
5.4.5Limitations of study ... 213
5.4.6Conclusion ... 215
6 3D volumetric measurements of the optic nerve head in glaucomatous and healthy subjects ... 217 6.1Introduction ... 217 6.1.1Aims of study ... 218 6.2Experimental design ... 218 6.2.1Participants ... 218 6.2.2Clinical assessments ... 219
6.2.3Optical coherence tomography ... 219
6.2.43D image analysis of optic nerve head structure... 219
6.2.5Statistical analysis ... 221
6.3Results ... 221
6.3.1Changes in Bruch’s membrane opening area as a function of glaucoma disease stage……….. ... 221
6.3.2Changes in the volume of the optic cup as a function of glaucoma disease stage ... 222
6.3.3Changes in the volume of the prelamina below Bruch’s membrane as a function of glaucoma disease stage ... 223
6.3.4Changes in the volume of the lamina cribrosa as a function of glaucoma disease stage……. ... 224
6.3.5Summary of key findings ... 225
xiii
6.4.1Limitations of study ... 226
6.4.2Conclusion ... 227
7 Microstructural analysis of the lamina cribrosa in healthy and glaucomatous eyes 229 7.1Introduction ... 229
7.1.1Aims of study ... 230
7.2Experimental design ... 230
7.2.1Participant demographics ... 230
7.2.2Clinical assessments ... 231
7.2.3Optical coherence tomography datasets and image processing ... 231
7.2.4Statistical analysis ... 233
7.3Results ... 234
7.3.1Visualisation of lamina cribrosa (LC) beam orientation and coherence in control and glaucoma... 234
7.3.2Regional differences within the lamina cribrosa beam orientation in control and glaucoma... 237
7.3.3Regional differences within the lamina cribrosa beam coherence ... 237
7.3.4Differences within lamina cribrosa beam orientation at increasing depth ... 239
7.3.5Differences in lamina cribrosa beam coherence with increasing depth in the optic nerve head in control and glaucoma ... 240
7.3.6Differences in lamina cribrosa beam orientation at different stages of glaucoma ... 242
7.3.7Differences in lamina cribrosa beam coherence between control and each stage of glaucoma... 243
7.3.8Summary of significant results ... 243
7.4Discussion ... 244
xiv
8 Discussion ... 250
8.1Conclusion ... 261
8.2Future work ... 262
9 Bibliography ... 265
Appendix 1: Examples of participant consent form and information ... 287
Example consent form for participants in the study ... 287
Example participant information sheet ... 288
Appendix II: Regional thickness and volume of the inner retinal layers ... 293
Regional volume of inner retinal layers for control and each stage of glaucoma ... 293
Regional thickness of inner retinal layers for control and each stage of glaucoma ... 294
Regional inner plexiform layer : macula nerve fibre layer and inner plexiform layer : ganglion cell layer ratios ... 295
Appendix III: Regional differences in the inner retinal layers in glaucoma ... 296
Differences in thickness of the ganglion cell complex between control and glaucoma ... 296
Differences in volume of the ganglion cell complex between control and glaucoma ... 297
Differences in thickness of the macula nerve fibre layer between control and glaucoma ... 298
Differences in thickness of the ganglion cell layer between control and glaucoma ... 299
Differences in volume of the ganglion cell layer between control and glaucoma ... 300
Differences in thickness of the inner plexiform layer between control and glaucoma ... 301
Differences in volume of the inner plexiform layer between control and glaucoma ... 302 Differences in inner plexiform layer : ganglion cell layer ratio between control and glaucoma 303
xv
Differences in volume of the macula nerve fibre layer between control and glaucoma ... 304
Differences in inner plexiform layer : macula nerve fibre layer ratio between control and glaucoma ... 304
Appendix IV: Published abstracts and conferences ... 305
Oral presentations ... 305
xvi
List of figures
1 Introduction
Figure 1.1: Schematic diagram of the human optic nerve head, where pink indicates astrocytes and blue indicates connective tissue. ... 4 Figure 1.2: Overview of the structure of the human retina ... 8 Figure 1.3: Features of healthy and glaucomatous optic nerve heads ... 13 Figure 1.4: Schematic diagram describing the mechanisms by which optic nerve head biomechanics may result in retinal ganglion cell death in glaucoma. ... 17 Figure 1.5: The effects of scleral biomechanics on the ONH. ... 18 Figure 1.6: Schematic diagram of a generic optical coherence tomography (OCT) device.. ... 21 Figure 1.7: OCT image of the macula acquired using conventional technique and enhanced depth imaging with a Spectralis OCT. ... 25
2 Methods
Figure 2.1: Flow chart showing data processing stages prior to measurements. ... 35 Figure 2.2: (a) Histograms of pixel intensities were normally distributed initially. (b) The lower limit was set to the centre of the histogram and upper limit to the edge of the curve then (c) the pixels were automatically redistributed over this range. ... 36 Figure 2.3: OCT images of the macula and optic nerve head before and after brightness and contrast adjustment. ... 37 Figure 2.4: Maculaand optic nerve head images before and after filtering to improve visibility of retinal and ONH structures.. ... 39 Figure 2.5: Schematic diagram of eye showing the measurements required to calculate the transverse pixel scaling. ... 40
xvii Figure 2.6: Processed OCT images of the macula and optic nerve head prior to and afterscaling using the modified Littmann equation. ... 42 Figure 2.7: The correct orientation of the images was ensured by comparing a maximum intensity projection of the OCT dataset to the corresponding fundus photograph and flipping or rotating the OCT dataset as required. ... 43 Figure 2.8: Macula OCT b-scan with segmentation of the macular nerve fibre layer (mNFL), ganglion cell layer (GCL) and inner plexiform layer (IPL).. ... 45 Figure 2.9: Bland-Altman plots to assess agreement between repeated measures of the mean thickness for ganglion cell complex (GCC), macular nerve fibre layer (mNFL), ganglion cell layer (GCL) and inner plexiform layer (IPL). ... 47 Figure 2.10: Retinal thickness maps were divided into 13 regions centred on the fovea. ... 48 Figure 2.11: 3D OCT image stacks were averaged using maximum intensity projections (MIP) of the optic nerve head (ONH) ... 50 Figure 2.12: (a) A 45° radial reslice starting at the temporal side of the disc was used to create four radial B-scans in the (b) temporal-nasal, (c) superior temporal-inferior nasal, (d) superior-inferior, and (e) superior nasal-inferior temporal planes. ... 51 Figure 2.13: (a) Schematic diagram and (b) fundus photograph of a left optic nerve ... 51 Figure 2.14: (a) Bruch's membrane opening (BMO) diameter in red. The distance from BMO to (b) the prelamina depth, (c) anterior lamina cribrosa (LC) depth and (d) posterior LC depth was measured ... 53 Figure 2.15: Schematic diagram of prelamina measurements above and below BMO ……….54 Figure 2.16: Bland-Altman plots to assess agreement between repeated measures for Bruch’s membrane opening (BMO) in the temporal-nasal plane, and prelamina depth (PreL), anterior lamina cribrosa depth (AnL) and posterior lamina cribrosa depth (PostL) in the central region. ... 55 Figure 2.17: (a) An enface view of the optic nerve head (ONH) in the left eye of a myopic 65 year old male with glaucoma ... 57
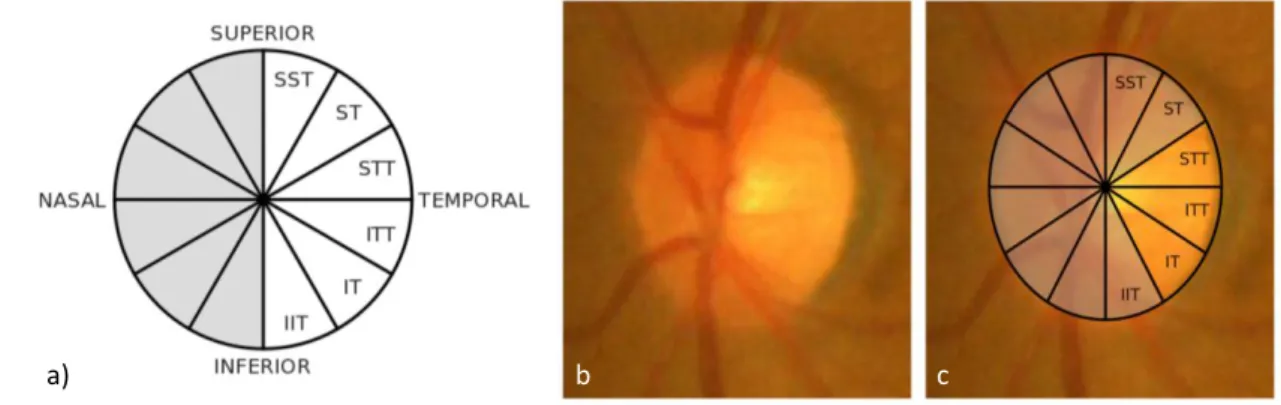
xviii Figure 2.18: The volume of the optic cup (C) was subtracted from the volume of the area between the anterior LC surface and BMO……… 58 Figure 2.19: (a) An oblique radial slice of the ONH in the left eye of a myopic 65 year old male with glaucoma. ... 59 Figure 2.20: (a) An oblique radial slice of the ONH in the left eye of a myopic 65 year old male with glaucoma. ... 60 Figure 2.21: (a) Schematic diagram of division of optic nerve head (ONH) regions of a left eye, with nasal side of the ONH greyed out as the measurements were discarded due to vascular shadowing. (b) Fundus photo of optic nerve head with (c) grid overlay showing regional division. . ... 62
3 Analysis of the inner retinal layers in glaucomatous and healthy eyes
Figure 3.1: (a) Retinal thickness maps subdivisions: 13 regions centred on the fovea. R ... 75 Figure 3.2: Colour-coded thickness maps of ganglion cell complex (GCC), macula nerve fibre layer (mNFL), ganglion cell layer (GCL) and inner plexiform layer (IPL), with the visual field plot (VF) for eyes at different of glaucoma.. ... 76 Figure 3.3: Differences in macula nerve fibre layer (mNFL) and ganglion cell layer (GCL) thickness (thick) and volume (vol) at regions of equal eccentricity from the fovea. ... 77 Figure 3.4: Differences in advanced glaucoma maculae ganglion cell layer (GCL), inner plexiform layer (IPL) and macular nerve fibre layer (mNFL) thickness (thick) and volume (vol) at corresponding hemizones and inner-hemizones. ... 78 Figure 3.5: Differences in macular nerve fibre layer (mNFL) and ganglion cell layer (GCL) volume (vol) at corresponding quadrants and inner-quadrants. ... 79 Figure 3.6: Regional ganglion cell complex (GCC) thickness for each control and each stage of glaucoma progression, and inter-stage regional and total area differences. ... 80 Figure 3.7: Regional ganglion cell complex (GCC) volume for each control and each stage of glaucoma progression, and inter-stage regional and total area differences ... 82
xix Figure 3.8: Regional macula nerve fibre layer (mNFL) thickness for each control and each stage of glaucoma progression, and inter-stage regional and total area differences. ... 84 Figure 3.9: Regional macula nerve fibre layer (mNFL) volume for each control and each stage of glaucoma progression, and inter-stage regional and total area differnces. ... 85 Figure 3.10: Regional ganglion cell layer (GCL) thickness for each control and each stage of glaucoma progression, and inter-stage regional and total area differences. ... 87 Figure 3.11: Regional ganglion cell layer (GCL) volume for each control and each stage of glaucoma progression, and inter-stage regional and total area differences. ... 88 Figure 3.12: Regional inner plexiform layer (IPL) thickness for each control and each stage of glaucoma progression, and inter-stage regional and total area differnces. ... 90 Figure 3.13: Regional inner plexiform layer (IPL) volume for each control and each stage of glaucoma progression, and inter-stage regional and total area differences.. ... 92 Figure 3.14: Regional inner plexiform layer : macula nerve fibre layer (IPL:mNFL) ratio for each control and each stage of glaucoma progression, and inter-stage regional and total area differences ... 93 Figure 3.15: Regional inner plexiform layer : ganglion cell layer (IPL:GCL) ratio for each control and each stage of glaucoma progression, and inter-stage regional and total area differences. ... 95 Figure 3.16: Changes in the ganglion cell layer (GCL) and inner plexiform layer (IPL) were identified between control and increasing stages of glaucoma. ... 102 Figure 3.17: Comparison of (a) ETDRS grid and (b) the grid used to divide the macula into 13 regions in the present study. ... 104
4 Analysis of age related changes in
in vivo
human optic nerve head microstructure
Figure 4.1: Schematic diagram of Bruch's membrane opening (BMO) diameter across the optic disc, and demonstrated on example images from old and young ONH datasets. ... 111
xx Figure 4.2: Bruch’s membrane opening (BMO) diameter for each region of the optic nerve head, and horizontal:vertical BMO diameter, plotted against age. ... 112 Figure 4.3: Schematic diagram of peripapillary nerve fibre layer (pNFL) ... 115 Figure 4.4: Regions of peripapillary nerve fibre layer (pNFL) and border nerve fibre layer (bNFL) that were affected by age, using general linear models. ... 116 Figure 4.5: Peripapillary nerve fibre layer (pNFL) and border nerve fibre layer (bNFL) thickness as a function of age. ... 117 Figure 4.6: Schematic diagram of prelamina depth and prelamina thickness, shown in red, and example images from old and young optic nerve heads ... 122 Figure 4.7: Prelamina depth and prelamina thickness plotted against age, for each region of the optic nerve head. ... 124 Figure 4.8: Optic nerve head regions where prelamina depth ... 125 Figure 4.9: Mean deviation (MD) in visual field, plotted against age, and mean spherical refraction plotted against axial length. ... 129 Figure 4.10: Schematic diagram of measurements of (a) anterior lamina cribrosa (LC) depth, (b) posterior LC depth, and (c) LC thickness ... 130 Figure 4.11: Anterior and posterior lamina cribrosa (LC) depth as a function of age for each region of the optic nerve head. ... 132 Figure 4.12: Lamina cribrosa (LC) thickness as a function of age for each region of the optic nerve head. ... 133 Figure 4.13: Regions of the anterior lamina cribrosa depth (Ant LC), posterior lamina cribrosa depth (Post LC), and lamina cribrosa thickness (LC thick) that were affected as a function of age, using general linear models (GLM)... 137 Figure 4.14: Regions of the optic nerve head that were affected as a function of age, using general linear models (GLM). ... 141
xxi
5. 2D optic nerve head parameters as a function of glaucoma
Figure 5.1: Diagram of the Bruch's membrane opening (BMO) diameter across the optic disc on a schematic and OCT images from each stage of glaucoma ... 158 Figure 5.3:The association between mean spherical refractive error and axial length. ... 160 Figure 5.4: a) Regional Bruch’s membrane opening (BMO) diameter and b) Horizontal:vertical BMO diameter ratio for each stage of glaucoma (G). ... 162 Figure 5.5: Diagram of measurements of peripapillary nerve fibre layer (pNFL), measured at a distance 1.7mm from the centre of the optic disc, and border NFL (bNFL), measured above Bruch’s membrane opening (BMO), on a schematic and OCT images from each stage of glaucoma.. ... 163 Figure 5.6: Peripapillary nerve fibre layer (pNFL) and border nerve fibre layer (bNFL) thickness as a function of visual field loss for each region. ... 165 Figure 5.7: a) Peripapillary nerve fibre layer and b) Border NFL thickness for each glaucoma (G) stage ... 169 Figure 5.8: Regional changes in peripapillary nerve fibre layer (pNFL) and border nerve fibre layer (bNFL) as a function of glaucoma (G) stage detected using linear mixed-effects models and subsequent posthoc analysis (Tukey). ... 171 Figure 5.9: Diagram of measurements of (a) prelamina depth and (b) thickness on a schematic and OCT images from each stage of glaucoma, on a superior-inferior slice. ... 172 Figure 5.10: a) Prelamina (PreL) depth and b) PreL thickness as a function of visual field loss for each region. x-axis is reversed so greater visual field loss is further along the x-axis. ... 174 Figure 5.11: Mean prelamina depth and thickness for each glaucoma (G) stage. ... 179 Figure 5.12: Regions of the optic nerve head where prelamina depth was affected by stage of glaucoma, using linear mixed-effects models and subsequent pairwise comparisons. ... 181 Figure 5.13: Diagram of measurements of (a) anterior and (b) posterior lamina cribrosa (LC) depth on a schematic and OCT images from each stage of glaucoma ... 182
xxii Figure 5.14: Diagram of measurements of lamina cribrosa (LC) thickness on a schematic and OCT images from each stage of glaucoma,. ... 183 Figure 5.15: Anterior and posterior lamina cribrosa (LC) depth as a function of visual field loss for each region... 184 Figure 5.16: Lamina cribrosa (LC) thickness as a function of visual field loss for each region. ... 185 Figure 5.17: Regional anterior and posterior lamina cribrosa (LC) depth for each glaucoma (G) stage ... 192 Figure 5.18: Regions of the optic nerve head where posterior lamina cribrosa depth was affected by stage of glaucoma, using linear mixed-effects models and subsequent pairwise comparisons. ... 194 Figure 5.19: Lamina cribrosa (LC) thickness for each region of the ONH for glaucoma (G) stage, and regions of the LC that were affected by glaucoma using linear mixed effects models (LMM). ... 195 Figure 5.20: Regions of the optic nerve head that were affected by stage of glaucoma, using linear mixed-effects models (LMM).. ... 197 Figure 5.21: Comparison of minimum rim width (MRW, shown in green) and peripapillary nerve fibre layer (pNFL) and border nerve fibre layer (bNFL) measurements demonstrated in red dashed lines, both in relation to Bruch’s membrane opening ... 202 Figure 5.22: (a) Schematic diagram and (b) fundus photograph of a left optic nerve, with a grid superimposed demonstrating the location of prelamina and lamina cribrosa measurements (blue), border nerve fibre layer (bNFL, cyan) and peripapillary nerve fibre layer (pNFL, green). ... 207 Figure 5.23: Schematic diagram of how deformation of the sclera and lamina cribrosa (LC), may be related. ... 209
6. 3D volumetric measurements of the optic nerve head in glaucomatous and healthy
subjects
Figure 6.1: (a) An oblique radial slice of the ONH in the left eye of a myopic 65 year old male with glaucoma. ... 220
xxiii Figure 6.2: Bruch’s membrane opening (BMO) area for each stage of glaucoma. ... 222 Figure 6.3: Cup volume for each stage of glaucoma. ... 223 Figure 6.4: Prelamina volume for each stage of glaucoma... 224 Figure 6.5: Lamina cribrosa (LC) volume for each stage of glaucoma. . ... 224
7. Microstructural analysis of the lamina cribrosa in healthy and glaucomatous eyes
Figure 7.1: Schematic diagram of division of optic nerve head (ONH) regions of a left eye, with nasal side of the ONH in greyscale as the measurements were discarded due to vascular shadowing ... 232 Figure 7.2: Colour code used to represent dominant orientation of LC beams in the OCT datasets. 232 Figure 7.3: Examples of colour coded maps of lamina cribrosa (LC) beam orientation and coherence with increasing depth into the LC for control, early glaucoma and advanced glaucoma ... 235 Figure 7.4: Summary of differences in regional lamina cribrosa (LC) beam coherence in the optic nerve head (ONH). ... 239 Figure 7.5: Regional lamina cribrosa (LC) beam orientation and change in orientation for each stage of glaucoma with increasing depth into the LC. ... 240 Figure 7.6: Regional lamina cribrosa (LC) beam coherence and change in coherence for each stage of glaucoma with increasing depth into the LC. ... 241 Figure 7.7: Regional differences in lamina cribrosa (LC) beam coherence with increasing depth in the optic nerve head were observed in eyes with advanced glaucoma.. ... 241 Figure 7.8: Regional lamina cribrosa (LC) beam orientation and difference in orientation for each stage of glaucoma, with outliers represented by black spots. ... 243
8. Discussion
Figure 8.1: Regions of the optic nerve head that were affected as a function of age, using general linear models (GLM). ... 254
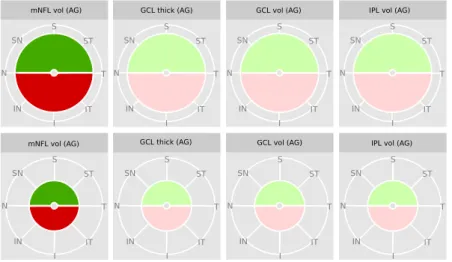
xxiv Figure 8.2: Difference between control and preperimetric glaucoma (PG) and early glaucoma (EG) using linear mixed-effects models (LMM). ... 257 Figure 8.3: Schematic diagram of how deformation of the sclera and lamina cribrosa (LC), may be related. For a compliant sclera, and increase in IOP induces scleral deformation which increases the size of the scleral canal and pulls the LC taut, resulting in a decrease in LC depth. ... 258 Figure 8.4: Schematic diagram of possible scleral canal expansion in glaucoma. Pink indicate the measured volume of the prelamina in (a) control and (b) glaucoma eyes... 260 Figure 8.5: Summary of differences in regional lamina cribrosa (LC) beam coherence in the optic nerve head (ONH) ... 261
Appendix II
Figure 0.1:Regional volume of inner retinal layers for each stage of glaucoma. ... 293 Figure 0.2: Regional mean thickness of inner retinal layers for each stage of glaucoma. ... 294 Figure 0.3: Regional ratio of inner plexiform layer (IPL) : macula nerve fibre layer (mNFL) and IPL : ganglion cell layer (GCL) for each stage of glaucoma.. ... 295
Appendix III
Figure 0.1: Differences in ganglion cell complex (GCC) thickness between control (C) and preperimetric glaucoma (PG), early glaucoma (EG) and advanced glaucoma (AG) ... 296 Figure 0.2: Differences in ganglion cell complex (GCC) volume between control (C) and preperimetric glaucoma (PG), early glaucoma (EG) and advanced glaucoma (AG). ... 297 Figure 0.3: Differences in macula nerve fibre layer (mNFL) thickness between control (C) and preperimetric glaucoma (PG), early glaucoma (EG) and advanced glaucoma (AG). ... 298 Figure 0.4: Differences in ganglion cell layer (GCL) thickness between control (C) and preperimetric glaucoma (PG), early glaucoma (EG) and advanced glaucoma (AG). ... 299
xxv Figure 0.5: Differences in ganglion cell layer (GCL) volume between control (C) and preperimetric glaucoma (PG), early glaucoma (EG) and m advanced glaucoma (AG). ... 300 Figure 0.6: Differences in inner plexiform layer (IPL) thickness between control (C) and preperimetric glaucoma (PG), early glaucoma (EG) and advanced glaucoma (AG). ... 301 Figure 0.7: Differences in inner plexiform layer (IPL) volume between control (C) and preperimetric glaucoma (PG), early glaucoma (EG) and advanced glaucoma (AG). ... 302 Figure 0.8: Differences in inner plexiform layer : ganglion cell layer (IPL:GCL) ratio between control (C) and preperimetric glaucoma (PG), early glaucoma (EG) and advanced glaucoma (AG). ... 303
xxvi
List of tables
2 Methods
Table 2.1: Inclusion criteria for study participants. ... 33 Table 2.2: Classification of glaucoma staging,. ... 43 Table 2.3: Lamina cribrosa slice number and corresponding depth into LC. ... 61
3 Analysis of the inner retinal layers in glaucomatous and healthy eyes
Table 3.1: Demographics for control and glaucomatous subjects. ... 96
4 Analysis of age related changes in
in vivo
human optic nerve head microstructure
Table 4.1: Participant demographics. ... 108 Table 4.2: Mean of each Bruch’s membrane opening (BMO) diameter for each ONH region. ... 111 Table 4.3: General linear models for Bruch’s membrane opening (BMO) diameter for each direction within the optic nerve head. ... 114 Table 4.4: Mean of each nerve fibre layer parameter ... 115 Table 4.5: General linear models for peripapillary nerve fibre layer (pNFL) thickness ... 118 Table 4.6: General linear models for border nerve fibre layer (bNFL) thickness,... 119 Table 4.7: Mean of each regional optic nerve head parameter. ... 123 Table 4.8: General linear models for prelamina (PreL) depth for each optic nerve head region.. ... 126 Table 4.9: General linear models for prelamina (PreL) thicknes ... 127 Table 4.10: Mean of each regional optic nerve head parameter. ... 131 Table 4.11: General linear models for anterior lamina cribrosa depth (Ant LC) ... 134 Table 4.12: General linear models for posterior lamina cribrosa depth (Post LC) ... 135 Table 4.13: General linear models for lamina cribrosa thickness (LC thick), ... 136
xxvii Table 4.14: Independent variables included in the optimised general linear model to explain variance in Bruch’s membrane opening diameter ... 143 Table 4.15: Independent variables included in the optimised general linear model to explain variance in nerve fibre layer parameters. ... 144 Table 4.16: Independent variables included in the optimised general linear model to explain variance in prelamina parameters. ... 147 Table 4.17: Independent variables included in the optimised general linear model to explain variance in regional lamina cribrosa parameters. ... 149
5. 2D optic nerve head parameters as a function of glaucoma
Table 5.1: Participant demographics for those eyes included in the study. ... 154 Table 5.2: Mean of each regional Bruch’s membrane opening (BMO) diameter for each stage of glaucoma. ... 159 Table 5.3: Linear mixed-effects model for Bruch’s membrane opening (BMO) diameter for each direction within the optic nerve head. ... 161 Table 5.4: Mean of each regional nerve fibre layer (NFL) parameter for each stage of glaucoma. ... 164 Table 5.5: Linear mixed-effects models for peripapillary nerve fibre layer (pNFL) thickness ... 168 Table 5.7: Mean of each regional prelamina parameter for each stage of glaucoma... 173 Table 5.8: Linear mixed-effects model (LMM) for prelamina depth (PreL depth) for each optic nerve head region. ... 175 Table 5.9: Linear mixed-effects model (LMM) for prelamina thickness (PreL thick) ... 176 Table 5.10: Mean of each lamina cribrosa (LC) parameter for each stage of glaucoma.. ... 186 Table 5.11: Linear mixed-effects models for anterior LC (Ant LC) depth ... 187 Table 5.12: Linear mixed-effects models for posterior LC (Post LC) depth ... 188 Table 5.13: Linear mixed-effects models for lamina cribrosa thickness (LC thick) ... 189
xxviii Table 5.14: Independent variables included in the linear mixed-effects model to explain variance in regional Bruch’s membrane opening (BMO) parameters. ... 199 Table 5.15: Independent variables included in the linear mixed-effects model to explain variance in regional peripapillary nerve fibre layer (pNFL) and border nerve fibre layer (bNFL) parameters. .... 201 Table 5.16: Independent variables included in the linear mixed-effects model to explain variance in regional prelamina (PreL) depth and thickness parameters. ... 205 Table 5.17: Independent variables included in the linear mixed-effects model to explain variance in regional lamina cribrosa (LC) parameters. ... 213
6. 3D volumetric measurements of the optic nerve head in glaucomatous and healthy
subjects
Table 6.1: Demographics for the eyes included in the present study ... 218 Table 6.2:Quantification of optic nerve head parameters in 3D ... 221
7. Microstructural analysis of the lamina cribrosa in healthy and glaucomatous eyes
Table 7.1: Demographics for the eyes included in the present study. ... 231 Table 7.2: Dominant lamina cribrosa (LC) beam orientation for each optic nerve head (ONH) region at each depth in the ONH ... 236 Table 7.3: Lamina cribrosa (LC) beam coherence for each optic nerve head (ONH) region at each depth in the ONH ... 237xxix
Abbreviations
A angle of scan
ACD anterior chamber depth
AG advanced glaucoma
Ant LC anterior LC depth
APON acquired pit of the optic nerve
AxL axial length
BM Bruch’s membrane
BMO Bruch’s membrane opening
bNFL border nerve fibre layer
C control
CCT central corneal thickness
CD cup-to-disc (ratio)
CRA central retinal artery CRV central retinal vein
D dioptres
dB decibels
EDI enhanced depth imaging
EG early glaucoma
ETDRS Early Treatment Diabetic Retinopathy Study FD-OCT Fourier domain optical coherence tomography
G glaucoma
GCC ganglion cell complex
GCL ganglion cell layer
xxx GLMM generalised linear mixed-effects model
HRT Heidelberg Retinal Tomography
H : V horizontal : vertical ratio
INL inner nuclear layer
I inferior
IN inferior-nasal
IOP intraocular pressure
IPL inner plexiform layer
IPL : GCL ratio of inner plexiform layer to ganglion cell layer IPL : mNFL ratio of inner plexiform layer to macula nerve fibre layer
IT inferior-temporal
LC lamina cribrosa
LGN lateral geniculate nucleus LMM linear mixed-effects model
LUT look up table
MD mean deviation on visual fields
MG moderate glaucoma
MIP maximum intensity projection
mm millimetres
mmHG millimetres of mercury mNFL macula nerve fibre layer
MS mean spherical refraction
n number
N nasal
NFL nerve fibre layer
xxxi NICE National Institute for Health and Care Excellence
nm nanometres
NRR neuroretinal rim
NTG normal tension glaucoma
OCT optical coherence tomography
ON optic nerve
ONH optic nerve head
p constant for the machine used when scaling an image PAGC primary angle closure glaucoma
PG preperimetric glaucoma
pNFL peripapillary nerve fibre layer POAG primary open angle glaucoma Post LC posterior LC depth
PreL prelamina
q axial length – 1.82
r distance between stationary point and retina/radius of the eye
R region
RGC retinal ganglion cell RPE retinal pigment epithelium
s (number of pixels * transverse pixel calibration) / 1000
S superior
SC scleral canal
SD standard deviation
SD-OCT spectral domain optical coherence tomography SEM scanning electron microscopy
xxxii SS-OCT swept source optical coherence tomography
ST superior-temporal
t true size of an image
T temporal
TD-OCT time domain optical coherence tomography
BF visual fields
μm micrometres
2D two dimensional
Chapter 1:
2
1
Introduction
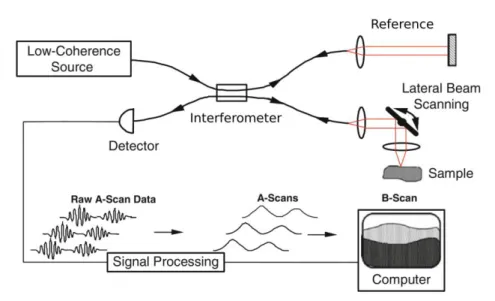
Glaucoma is a progressive optic neuropathy and is the second leading cause of blindness worldwide, affecting around 60 million people (Quigley and Broman 2006; Quigley 2011). The primary site of ocular damage in glaucoma has been proposed to be the lamina cribrosa in the optic nerve (Minckler et al. 1976; Quigley et al. 1981; Quigley et al. 1983; Bellezza et al. 2003), though there is also significant damage to the retina as part of the disease process (Tan et al. 2008; Tan et al. 2009; de A Moura et al. 2012; Niles et al. 2012; Hood et al. 2014). Previously, examination of the lamina cribrosa and individual retinal layers has not been possible in vivo, but the development and subsequent advancements in optical coherence tomography (OCT), especially enhanced depth imaging and long wavelength OCT, has enabled the imaging of deeper structures within the human eye in vivo, including the lamina cribrosa (Keane et al. 2009; Lee et al. 2011; Park and Ritch 2011; Park et al. 2012).
1.1
The structure of the optic nerve head
When viewed anteriorly, i.e. in the enface orientation, the human optic nerve head (ONH) is typically oval shaped. The mean vertical diameter in a Caucasian population is 1.88 mm and mean horizontal diameter 1.70 mm (Quigley et al. 1990). The optic disc is the portion of the optic nerve that is visible when looking through the pupil into the eye; the average optic disc is around 2.38 mm2, and it is generally accepted that there are no significant difference in area between males and females (Sekhar et al. 2001; Hermann et al. 2004; Sihota et al. 2005).
The cup-to-disc (CD) ratio is used to indicate the diameter of the optic cup expressed as fraction of the diameter of the optic disc, measured horizontally and vertically. In healthy eyes the average vertical CD ratio is 0.34 (Jonas et al. 1988b). Asymmetry of 0.2 or more between the two eyes can be an indication of glaucomatous development. Afro-Caribbean patients have larger CD ratios than
3 Caucasian patients (0.35 and 0.24 respectively, Beck et al. 1987). Important to note is that different viewing techniques, such as slit lamp fundoscopy, Heidelberg Retinal Tomography (HRT) and stereoscopic photography, can give significantly different measurements for the same discs (Durmus et al. 2009), likely due to the difference in internal optics of the different viewing modalities.
Retinal ganglion cell (RGC) axons run from cell body in the retina to the optic nerve head. There are roughly 1.2 million RGC axons in the eye (Anderson et al. 1967), each with a mean diameter 1.18µm (Jonas et al. 1992), and these axons come together to become the optic nerve.
The optic nerve head (ONH) can be anatomically divided into three structurally distinct regions: the prelamina, lamina cribrosa (LC) and the postlaminar optic nerve (Figure 1.1). Basic organisation of RGC axons is the same in all three regions: the axons are collected into bundles (fascicles) of several thousand, each surrounded by ensheathing tissue that differs from region to region.
1.1.1 Prelamina
The prelamina region represents the optic nerve head proper, and is the region of the optic nerve head that is commonly assessed during routine ophthalmic examination. 80-95% of the region consists of neural tissue (Wilczek 1947). Astrocytes form thin sheets around the blood vessels in these regions (Oyama et al. 2006). The optic nerve head is separated from the vitreous by a thin layer of astrocytes called the internal limiting membrane of Elschnig, which is continuous with the internal limiting membrane of the retina (Hogan et al. 1971)
4 Figure 1.1: Schematic diagram of the human optic nerve head, where pink indicates astrocytes and blue indicates connective tissue. Lamina cribrosa in shown between dotted lines. Adapted from Anderson (1969)
1.1.2 Lamina cribrosa
The lamina cribrosa (LC) is a thin sieve-like structure located at the level of the sclera, which offers structural support to the RGC axons leaving the eye to form the optic nerve. It is made up of 10-11 cribriform sheets (Quigley et al. 1983), that are a network of collagen fibrils and elastic fibres that separates the RGC axons into bundles (Hernandez 1989, Morrison et al. 1990, Albon et al. 1995, Albon et al. 2000; Oyama et al. 2006). The RGC axon bundles pass through the pores formed by these connective tissue beams.
There are substantial amounts of collagen types I and III in the lamina cribrosa (Hernandez et al. 1986; Morrison et al. 1989; Albon et al. 1995; Albon et al. 2000). Collagen fibrils interspersed with elastin make up the core of the LC beams (Albon et al. 1995; Albon et al. 2000) and ultrastructurally resemble those found in sclera (Quigley et al. 1991; Hernandez 1992). The elastin appears as discrete fibres intermingled with collagen fibrils, rather than solid structures occupying entire beam
Prelamina
Lamina cribrosa
Postlaminar region
5 (Morrison et al. 1989). It is likely that the recoil properties of elastic fibres work with the collagen fibrils to cushion responses of the lamina cribrosa to changes in intraocular pressure (IOP). Thus the lamina cribrosa provides mechanical support for RGC axons as they pass from a relatively high pressure in the eye to a relatively low pressure in the retrobulbar cerebrospinal space (Downs et al. 2008). Astrocytes form glial columns that line axonal bundles (Hernandez et al. 1986; Oyama et al. 2006).
There is a greater density of connective tissue in the nasal and temporal areas of the LC than in the superior and inferior; and nasal more than temporal (Quigley and Addicks 1981; Radius and Gonzales 1981) The superior and inferior LC contains larger pores and then the nasal and temporal regions (Quigley and Addicks 1981). In glaucoma the superior and inferior-nasal regions of the optic nerve head are affected preferentially, and this is thought to be a consequence of these areas of the LC having less connective tissue i.e. less protection and therefore increased axon susceptibility to damage by elevated IOP (Gaasterland et al. 1978).
The LC has been shown to be thinner in healthy eyes with longer axial length (Ren et al. 2009), although there is significant difference in LC thickness measurements using in vivo and in vitro methods. Jonas and Holbach (2005) used histological techniques to determine a healthy LC thickness of 378 ± 118 μm, and in a different study (Kotecha et al. 2006) measured the thickness to be between 345 µm and 556 µm (average of 451 µm). An OCT study has reported the healthy in vivo LC thickness to be 245.80 ± 69.31 μm (Lee et al. 2011), and the group suggest that the difference between thickness measurements in vivo and those previously published for ex vivo were likely due to histological processing leading to tissue shrinkage, warping and/or swelling in the ex vivo samples.
The connective tissue beams of the LC form pores, through which RGC axons exit the eye. Pores vary in size, with larger pores at the superior and inferior poles where RGC axons originating in the
6 superior and inferior retina pass through the LC. In an ex vivo study Ivers et al. (2011) reported the mean pore area in the healthy human to be 1713 ± 1413 μm2, range 154 to 6637 μm2. More pores are reported at the posterior LC surface than the anterior surface, with anterior pores larger than posterior (Ogden et al. 1988). This is consistent with Quigley and Addicks (1981), Ogden et al. (1988) and Albon et al. (2007) who demonstrated that pores divide as they travel down through the LC, contributing to organisation of RGC axon bundles for higher cortical processing.
1.1.3 Postlaminar Optic Nerve
The postlaminar ON is the area of optic nerve immediately behind the LC. In humans, axons become myelinated from the postlaminar ON to the terminal nuclei in the brain, but myelination does not usually extend past the LC into the retina. However, it has been shown that in approximately 1% of the population myelination of the retinal nerve fibres occurs, and that it is bilateral in 7.7% of these cases (Tarabishy et al. 2007).
The meninges that surround the brain also surround the optic nerve extending towards the posterior LC. The pia mater is the innermost, then arachnoid, and the dura mater outermost. A layer of glial cells lie between the pia mater and outermost axon bundles (Fujita et al. 2000). Connective tissue in the postlaminar ON forms septae that run in the same direction as the RGC axons. The collagen fibres have been found to be continuous with those in the pia mater (Oyama et al. 2006) and lie longitudinally along the optic nerve to provide tensile strength to optic nerve bundles. Of interest is that LC insertion into the pia mater has been proposed to alter with age and glaucoma (Sigal et al. 2010). Astrocytes in the postlaminar region are stellate in shape in the centre of nerve bundles (Oyama et al. 2006).
7
1.2
The structure of the retina
The retina is a multi-layered, light sensitive tissue lining the inner surface of the eye (Figure 1.2). It is the site of transformation of light energy into a neural signal, and contains the first three cells in the visual pathway, namely the photoreceptor, bipolar and ganglion cells. Simply, when light enters the eye, photoreceptor cells transform photons of light into a neural signal through phototransduction. The signal is passed to bipolar cells in the mid-retina, then to retinal ganglion cells (RGCs). Retinal ganglion cells pass the signal from the retina to the brain. The RGC cell bodies are located in the ganglion cell layer (GCL), and their dendrites are in the inner plexiform layer (IPL), where they synapse with both bipolar and amacrine cells. The RGC axons form the nerve fibre layer (NFL) as they cross the retina to exit the eye at the optic nerve head (Hildebrand and Fielder 2011).
There are up to 20 types of RGC in the human retina, although the most prominent are midget ganglion cells, that receive input from midget bipolar cells and as such have a small dendritic tree; and parasol ganglion cells, that have much larger dendritic spread. The midget and parasol cells project to the parvocellular and magnocellular layers of the lateral geniculate nucleus (LGN) respectively (Callaway 2005) and together account for around 80% of the ganglion cell population (Hildebrand and Fielder 2011).
8 Figure 1.2: Overview of the structure of the human retina. Taken from Hildebrand and Fielder (2011).
1.3
The aging optic nerve head
1.3.1 Aging of the optic nerve
In the aging optic nerve there has been shown to be enlargement of the optic cup (Bengtsson 1980; Carpel and Engstrom 1981), i.e. an increase in optic cup diameter and optic cup area, with a subsequent increase in cup-to-disc (CD) ratio (Healey et al. 1997; Klein et al. 2006; Sung et al. 2009). Garway-Heath et al. (1997) also revealed larger cupping with aging, alongside a decrease in the area of the neuroretinal rim (NRR), predicted at 0.28% decrease in NRR/year. The decrease in NRR agrees with studies from Tsai et al. (1992) and is likely due to a decrease in nerve fibre count with increasing age (Dolman et al. 1980; Balazsi et al. 1984; Jonas et al. 1990). Indeed, the loss of RGC axons with increasing age is well reported (Johnson et al. 1987; Mikelberg et al. 1989; Jonas et al. 1990; Jonas et al. 1992), with one histological study reporting a decrease of around 5600 axons/year (Balazsi et al. 1984). However, Dolman et al. (1980) showed a trend for axon count decreasing with age that became more noticeable in those aged over 60 years. Repka and Quigley (1989), in a
9 histological study, reported a 6% axon loss over 75 years in human eyes, however this was not statistically significant.
An increase in LC thickness has been shown with increasing age by Kotecha et al. (2006), who also showed an age-related thickening of the LC beams. The latter is likely due to the age-related increase in connective tissue components of the lamina cribrosa ( Hernandez et al. 1987; Hernandez et al. 1989; Morrison et al. 1989; Albon et al. 1995; Albon et al. 2000). This is consistent with the reports that the proportion of the LC that is occupied by pores decreases with age, causing a subsequent change in the ratio of pore : inter pore tissue (Ogden et al. 1988).
The increase in the amount of connective tissue in the LC with increasing age is accompanied by a change in the ratio of collagen type I : collagen type III (Albon et al. 1995). Collagen type I fibrils are larger and less flexible than collagen type III (Silver et al. 2002) and may contribute to changes in the biomechanical behaviour of the LC with increasing age, i.e. the LC becomes stiffer and less resilient (Albon, et al. 2000). This could influence the susceptibility of an eye to RGC axon damage from increased IOP and contribute to the age-related increase in susceptibility to glaucoma. Similarly, the posterior sclera has been shown to become less compliant with increasing age (Grytz et al. 2012), which is thought to have an effect of the amount of strain experienced by both the LC and the peripapillary sclera, which is turn is likely to increase the susceptibility of an eye to glaucomatous damage (Downs et al. 2008; Campbell et al. 2014).
1.4
Glaucoma
Glaucoma is characterised by retinal ganglion cell (RGC) loss that results in optic nerve damage and permanent visual field loss. Population based surveys indicate that around one in 40 adults over the age of 40 has glaucoma with loss of visual function (Quigley 2011), and prevalence increases from 2% in adults over 40 years to 7% in adults over 75 years. Clinical detection and management of
10 glaucoma is primarily based on three clinical measures: intraocular pressure (IOP), examination of the visual field, and the appearance of the optic nerve head (Anderson 2006). An increase in CD ratio can represent an early glaucomatous change, and as RGC axon loss increases the cupping of the optic disc increases (Kokotas et al. 2012). There is currently no known cure for glaucoma and vision loss is irreversible, and as such, current treatment mechanisms revolve around decreasing IOP to prevent disease progression and further damage to vision (Heijl et al. 2002; Feiner and Piltz-Seymour 2003; Leske et al. 2003). Females account for 59% of all glaucoma; specifically, 55% of primary open angle glaucoma (POAG) and 70% of primary angle closure glaucoma (PACG; Quigley and Broman 2006).
Glaucoma can be either primary or secondary; primary glaucoma is that which occurs as the primary disease, i.e. it is not caused by any other pathology, and secondary glaucoma occurs as a consequence of another pathology, e.g. rubeosis irides, whereby neovascularisation of the iris causes blockage of the trabecular meshwork and subsequent neovascular glaucoma. Similarly, there are two forms of primary glaucoma. Primary open angle glaucoma (POAG) accounts for around 74% of glaucoma worldwide (Quigley and Broman 2006). The disease is slow progressing, usually bilateral but often asymmetrical, and on average there is half as much damage in the better eye than the worse eye (Broman et al. 2008). The mean age of onset is 60 years, and the frequency of glaucoma increases with age (Quigley 2011).
Primary angle closure glaucoma (PACG) is a chronic disorder where the anterior chamber angle becomes blocked, limiting aqueous outflow via the trabecular meshwork. Worldwide, a third of all glaucoma is PACG (Quigley and Broman 2006), and there is significantly higher prevalence in East Asian countries. Optic disc and visual field changes are similar in POAG and PACG, although upon first clinical presentation patients with PAGC tend to have greater levels of visual loss, particularly if the PACG is asymptomatic (Ang et al. 2004).
11 1.4.1 The role of intraocular pressure in glaucoma
Intraocular pressure (IOP) is determined by the rate of aqueous secretion and rate of aqueous outflow. In the healthy eye, aqueous humour is secreted from the ciliary epithelium and flows from the posterior chamber through the pupil and into the anterior chamber, where it exits the eye via either the trabecular meshwork or the uveoscleral pathway. 90% of aqueous outflow is via the trabecular meshwork, whereby aqueous flows though the trabeculae into Schlemm’s canal and is drained by episcleral vessels. This process is pressure-sensitive, therefore increased pressure results in increased outflow. The remaining 10% of aqueous outflow is via the uveoscleral pathway, whereby aqueous flows across the ciliary body into the suprachoroidal space where it is drained by venous circulation in the ciliary body, choroid and sclera, and a small proportion is drained through the iris. In POAG there is higher resistance to aqueous outflow via the trabecular meshwork (Johnson et al. 2002), which leads to an increase in IOP and subsequent damage to RGCs.
According to NICE Guidelines (2009) which govern best practice for clinicians working in the UK, intraocular pressure of a healthy eye is below 21 mmHg and ocular hypertension is defined as IOP over 21mmHg. However, only 10% of patients with IOP 22 mmHg or above have glaucoma (Tielsch et al. 1991), and up to a third of patients with POAG did not initially present with raised IOP (Klein et al. 1992). IOP undergoes diurnal variation, and tends to be higher in the morning, lower in the afternoon and evening. In a healthy eye the IOP could change by up to 4 mmHg throughout the day, although a larger change may be observed in glaucomatous and hypertensive eyes (S. Fan et al. 2011).
1.4.2 Visual field loss in glaucoma
A characteristic feature of glaucomatous nerve damage is the pattern and progression of the visual field defect. The earliest loss typically appears as an isolated paracentral scotoma in the arcuate area between 5˚ and 25˚ from fixation, then becomes larger within the arcuate area, touching the
12 horizontal raphe nasal to fixation then joining to the blind spot. The central 5˚ and temporal visual field are usually preserved until late in the disease (Quigley and Addicks 1981).
Although a retinal nerve fibre defect causes a change in the visual field, it can take several years before glaucomatous damage is identified using perimetry alone, as 35% of the RGC axons can be lost before a visual field defect is detected (Kerrigan-Baumrind et al. 2000). It has also been demonstrated that 86% of patients with an abnormal visual field result revert back to normal on repetition of the test (Keltner et al. 2000), so it is apparent that supplementary methods should be used for glaucoma monitoring and progression.
1.4.3 Optic nerve head changes in glaucoma
Glaucoma causes a progressive enlargement of the optic cup in the ONH due to loss of RGC axons that make up the majority of neuroretinal rim tissue, often prior to detectable visual field loss. The glaucomatous damage exceeds the physiological cupping that is present before the onset of raised IOP, meaning glaucomatous cupping is usually larger than physiological cupping. Clinically, the neuroretinal rim is assessed for thickness, symmetry, colour and the presence of notching, and the optic disc is assessed for any enlargement of cup or vascular changes e.g. bayonetting of blood vessels or disc haemorrhages (Drance 1989; Jonas et al. 1993; Jonas et al. 1999). It is reported that as the LC moves posteriorly during the glaucomatous disease process (Yang et al. 2011), anterior capillaries, present in the ONH and collagenous sheets of the lamina cribrosa, would stretch if they were to maintain connections in the peripapillary retina. Some vessels may rupture under such tension, therefore a disc haemorrhage would be a direct result of distortion of the ONH (Drance 1989; Kim et al. 2010).
13
1.4.3.1 Changes to the Lamina Cribrosa in Glaucoma
The anterior surface of the LC is typically a shallow depression. In glaucoma, the cupping of the optic nerve head becomes deeper than in a healthy eye, due to RGC axonal loss (therefore less prelamina tissue), as well as posterior displacement of the anterior LC surface. This displacement forms a ‘w’ shape from superior to inferior (Quigley and Addicks 1981; Quigley et al. 1983), as seen in Figure 1.3.
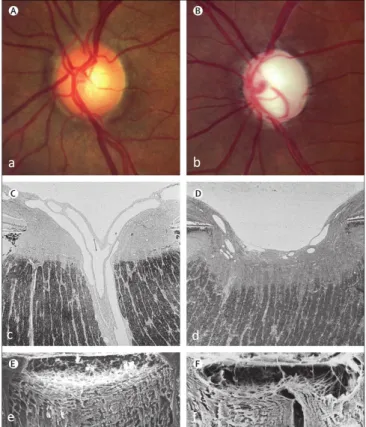
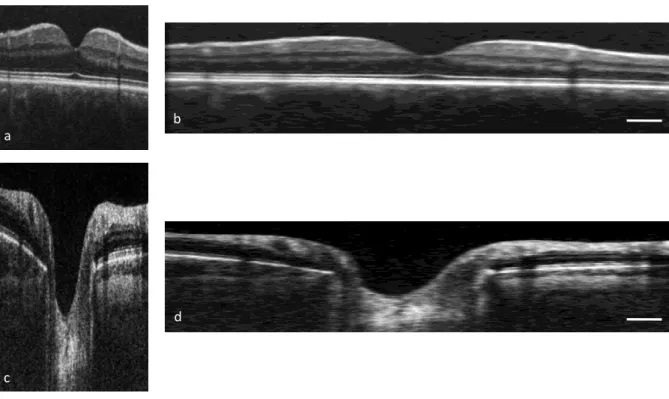
Figure 1.3: Features of healthy (left) and glaucomatous (right) optic nerve heads (ONH). (a) The cup of the optic disc is a small central pale area, whereas (b) the cup is excavated in glaucoma. (c) The typical histological image appearance of the ONH shows prelamina tissue loss in glaucoma (d). (e) Connective tissues of the ONH showing the lamina cribrosa (LC) and (f) the LC becomes bowed backwards forming a ‘w’ shape. Taken from Quigley (2011).
The LC has been shown to be significantly thinner in glaucomatous eyes compared to healthy eyes in both histological studies (Jonas and Hayreh 2009; Ren et al. 2009; Jonas et al. 2012) and in vivo (Lee et al. 2012; Park et al. 2012). In a scanning electron microscopy (SEM) study, the healthy LC was reported to be around 240 μm in healthy eyes, decreasing to 140 μm in glaucomatous subjects (Quigley et al. 1983). One OCT study measured the healthy LC in vivo to have central thickness of around 350 μm, decreasing to around 240 μm in eyes with POAG and 175 μm in eyes with normal
a b
c
e
d
14 tension glaucoma (NTG; Park et al. 2012), whereas another (Inoue et al. 2009) showed the mean LC thickness for subjects with ocular hypertension to be 245 μm, decreasing to 130 μm in advanced glaucoma. As previously stated, the difference in thickness measurements between in vivo and ex vivo measurements has been suggested to be due to tissue processing techniques used in histological studies, causing tissue shrinkage and/or warping.
Additional to posterior displacement of the LC during the glaucomatous disease process, there have also been reports of lateral extension. The LC surface was shown to remain covered by astrocytes that also filled the empty spaces left in pores by loss of nerve fibres. It was suggested that glial activation during glaucomatous neurodegeneration leads to an upregulation of extracellular matrix synthesis (Hernandez et al. 1989; Hernandez 2000) and that the astrocytes were migrating into LC pores (Tezel et al. 2004).
In glaucoma, those eyes that have normal or minimally damaged visual fields have a predominance of small round pores at the anterior LC surface; however, with increasing visual field loss the proportion of elongated pores increases (Susanna 1983; Miller and Quigley 1988). This is consistent with a recent in vivo characterisation of LC pores (Nadler et al. 2014). The LC pores are thought to elongate as the connective tissue fibres that form the LC stretch under the increased IOP in glaucoma.
1.4.4 Damage to the retina in glaucoma
Arguably, the regions of most importance when considering glaucoma are those layers that consist of the retinal ganglion cells, i.e. the retinal nerve fibre layer, ganglion cell layer and inner plexiform layer. The nerve fibre layer becomes thinner during the glaucomatous process as the RGC axons are damaged (Anton et al. 2007), both peripapillary and at the macula. The NFL drop out may be diffuse or localised. Localised damage is characterised by slit defects in NFL that become larger as the