Durham Research Online
Deposited in DRO:
06 October 2020
Version of attached le:
Accepted Version
Peer-review status of attached le:
Peer-reviewed
Citation for published item:
Basu, Tathagata and Einbeck, Jochen and Troaes, Matthias (2020) 'A sensitivity analysis and error bounds for the adaptive lasso.', in Proceedings of the 35th International Workshop on Statistical Modelling. , pp. 278-281.
Further information on publisher's website:
https://web-argitalpena.adm.ehu.es/pdf/USPDF202673.pdfPublisher's copyright statement: Additional information:
Use policy
The full-text may be used and/or reproduced, and given to third parties in any format or medium, without prior permission or charge, for personal research or study, educational, or not-for-prot purposes provided that:
• a full bibliographic reference is made to the original source
• alinkis made to the metadata record in DRO
• the full-text is not changed in any way
The full-text must not be sold in any format or medium without the formal permission of the copyright holders. Please consult thefull DRO policyfor further details.
Durham University Library, Stockton Road, Durham DH1 3LY, United Kingdom Tel : +44 (0)191 334 3042 | Fax : +44 (0)191 334 2971
the Adaptive Lasso
Tathagata Basu
1, Jochen Einbeck
1, Matthias C. M. Troffaes
11
Durham University, United Kingdom
E-mail for correspondence:[email protected]
Abstract: Sparse regression is an efficient statistical modelling technique which is of major relevance for high dimensional problems. There are several ways of achieving sparse regression, the well-known lasso being one of them. However, lasso variable selection may not be consistent in selecting the true sparse model. Zou (2006) proposed an adaptive form of the lasso which overcomes this issue, and showed that data driven weights on the penalty term will result in a consistent variable selection procedure. Weights can be informed by a prior execution of least squares or ridge regression. Using a power parameter on the weights, we carry out a sensitivity analysis for this parameter, and derive novel error bounds for the Adaptive lasso.
Keywords: Adaptive lasso; Sensitivity analysis; Variable selection.
1
Introduction
LetX= (X1,· · · , Xp) withXj = (X1j, . . . Xnj)T for 1≤j ≤p, andY = (Y1, . . . , Yn)T. We can characterise their relation in the linear regression setting
Y =Xβ+, (1)
where β = (β1,· · · , βp)T is a vector of regression coefficients and ∼
N(0, σ2In), withIndenoting then-dimensional identity matrix. We assume XandY to be scaled to mean 0.
The least squares method is the conventional way to estimate these regres-sion coefficients. However, in high dimenregres-sion (i.ep > n), the least squares method, which involves inversion ofXTX, cannot be used. Several
estima-tors have been proposed which solve the issue by introducing bias in the estimation process. Tikhonov (1963) introduced`2penalised regression or
Ridge regression. The `2 penalty achieves a stable solution through the
This paper was published as a part of the proceedings of the 35th Inter-national Workshop on Statistical Modelling (IWSM), Bilbao, Spain, 19–24 July 2020. The copyright remains with the author(s). Permission to reproduce or ex-tract any parts of this absex-tract should be requested from the author(s).
2 A Sensitivity Analysis of Adaptive Lasso
eigen value decay method, which, however, fails to be sparse which is a desirable property in high dimensional statistics. Tibshirani (1996) intro-duced the lasso or least absolute shrinkage and selection operator, which attains sparsity through a`1penalty. Zou (2006) proposed an adaptive form
of lasso based on data-driven weights in the penalty term that satisfies de-sired asymptotic properties for high-dimensional problems as suggested by Fan and Li (2001). We exploit the framework given by Zou (2006) to in-vestigate and understand the sensitivity of the adaptive lasso. For this we apply a two-step approach. We employ least squares or ridge estimates, say ˆβj, and a parameter γ to initialise the weights of type 1/|βˆj|γ which are then embedded in the penalty term. The effect of the parameter γ is then investigated, theoretically, through error bounds, and experimentally, through a sensitivity analysis.
2
Adaptive Lasso
Let us consider the linear model (1) which can be written in alternative form as
E[Y |X] =Xβ=β1X1+· · ·+βpXp. (2) Note thatXTXis guaranteed to be positive semi-definite but not
necessar-ily positive definite, even forp < n. We make the following two assumptions on the designX:
(A1) E[XT|X] = 0
(A2) limn→∞1nXTX= Σ exists, where Σ is positive definite.
Letβˆ= ( ˆβ1,· · · ,βˆp)T be any root-n consistent estimator ofβ. Then the
adaptive lasso estimates are given by
ˆ
βalasso(λ, γ) = arg min β 1 2kY −Xβk 2 2+λ p X j=1 wj(γ)|βj| (3) where wj(γ) =|βˆj|−γ, for γ >0. (4) We generally use least squares estimates or ridge estimates as weights since these are root-nconsistent.
3
Main Result
Let ˆβalasso(λ, γ) be the adaptive lasso estimates with respect to the param-etersλandγ and Σn= 1nX
Theorem: For any root-nconsistent estimate ˆβ= ( ˆβ1,· · · ,βˆp), we have the following error bounds:
ˆ βalasso(λ, γ)−β∗ 2 2≤ σ2 n Σ−n1 + λ2p n2 Σ−n1 2 min 1≤j≤p| ˆ βj|−2γ (5) Y −X ˆ βalasso(λ, γ) 2 2 ≤λ 2p n Σ−n1 min 1≤j≤p| ˆ βj|−2γ (6)
We see that the error bounds increase with increasing λ (increased bias from regularisation) but tend to decrease with increasingγ.
4
Simulation Study
We simulate the predictors from a standard normal distribution such that,
Xij∼N(0,1) forj = 1,· · ·,20 andi= 1,· · · , n. We assign the regression coefficients to be (β1,· · ·, β6) = (5,3,1,−1,−3,−5) andβj = 0 forj >6. We consider standard normal noise to construct the response vectoryi =
P6
j=1Xijβj +i where, i ∼ N(0,1) for i = 1,· · ·, n. The experiment is repeated forn= 100,500,1000.
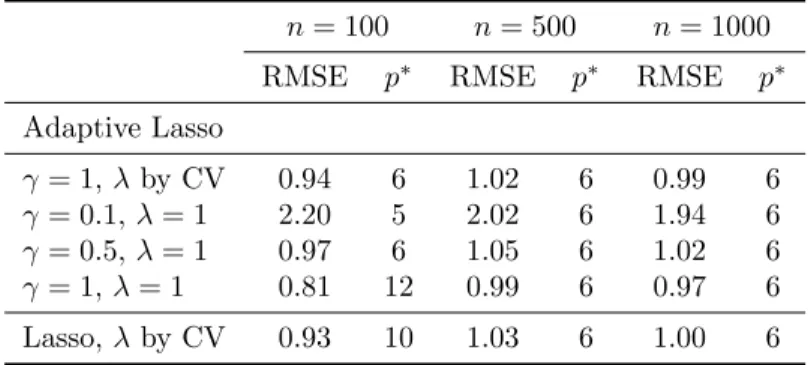
We analyse the sensitivity of the model for 0≤γ≤1 (γ= 0 yields regular lasso estimates). We use least squares estimates for the choice of weights. In Table 1, we compare prediction accuracy of different lasso variants, and also display the number of active co-variates, p∗. In the first row we give the results of the adaptive lasso for γ = 1. We specify λ through cross-validation. In the next three rows we show results for varyingγ and fixed
λ. In Figure 1, we show the coefficient path and RMSE curve evaluated over γ for 100 observations. From Figure 1 we see that as the value of γ
increases, the bias and RMSE decrease which is plausible in the light of Theorem 1. However, we also notice that it overfits and selects six extra variables as important. In the last row we show results from the lasso.
5
Conclusion
We have presented a sensitivity analysis for the adaptive lasso with respect to γ, and obtained novel bounds for the lasso estimates. We have shown through simulation that the bias due to regularisation with λ can be re-duced for larger values of γ, however, especially for small sample sizes, at the potential expense of overfitting and selection of some non-important variables in the model.
Acknowledgments: This work is funded by the European Commission’s
H2020 programme, through the UTOPIAE Marie Curie Innovative Train-ing Network, H2020-MSCA-ITN-2016, Grant Agreement number 722734.
4 A Sensitivity Analysis of Adaptive Lasso 0.0 0.2 0.4 0.6 0.8 1.0 −4 −2 0 2 4 γ coefficient v alue 0.0 0.2 0.4 0.6 0.8 1.0 1.0 1.5 2.0 2.5 γ RMSE
FIGURE 1. Coefficient path and fitting accuracy w.r.t.γ (λ= 1) forn= 100.
TABLE 1. Comparison of prediction accuracy (RMSE) between different meth-ods.
n= 100 n= 500 n= 1000
RMSE p∗ RMSE p∗ RMSE p∗
Adaptive Lasso γ= 1,λby CV 0.94 6 1.02 6 0.99 6 γ= 0.1,λ= 1 2.20 5 2.02 6 1.94 6 γ= 0.5,λ= 1 0.97 6 1.05 6 1.02 6 γ= 1,λ= 1 0.81 12 0.99 6 0.97 6 Lasso,λby CV 0.93 10 1.03 6 1.00 6 References
Fan, J., and Li, R. (2001). Variable selection via nonconcave penalized like-lihood and its oracle properties. Journal of the American Statistical Association,96(456), 1348 – 1360.
Tibshirani, R. (1996). Regression shrinkage and selection via the lasso. Journal of the Royal Statistical Society: Series B (Statistical Method-ology),58(1), 267 – 288.
Tikhonov, A. N. (1963). On the solution of ill-posed problems and the method of regularization.Dokl. Akad. Nauk SSSR,151(3), 501 – 504. Zou, H. (2006). The adaptive lasso and its oracle properties.Journal of the