Procedia CIRP 56 ( 2016 ) 209 – 214
2212-8271 © 2016 The Authors. Published by Elsevier B.V. This is an open access article under the CC BY-NC-ND license (http://creativecommons.org/licenses/by-nc-nd/4.0/).
Peer-review under responsibility of the scientific committee of the 5th CIRP Global Web Conference Research and Innovation for Future Production doi: 10.1016/j.procir.2016.10.056
ScienceDirect
9th International Conference on Digital Enterprise Technology - DET 2016 – “Intelligent Manufacturing in
the Knowledge Economy Era
Visual Analytics as an enabler for manufacturing process decision-making
Danielle Soban
a*, David Thornhill
a, Santosh Salunkhe
a, Alastair Long
aaQueen's University Belfast, Ashby Building, Stranmillis Road, Belfast BT9 5AH, United Kingdom
*. Tel.: +44(0)2890974181; fax: +44(0)2890975598. E-mail address: [email protected]
Abstract
The goal of an optimal manufacturing process is to maximize product performance while minimizing cost, time, and waste. A critical component of this optimization is the appropriate selection of process parameters. While central physical concepts often serve as a starting point, specific parameter selection is frequently done manually, based on operator skill, experience, and intuition. As a result, process optimization is often iterative, non-repeatable, and lacking in traceability. Further, there is no fundamental insight gained into the relationship between process parameter selection and critical process outputs. This paper explores the use of visual analytics as an enabler for manufacturing process decision making. An emerging science, visual analytics couples analytical reasoning with the substantial capability of the human brain to rapidly internalize and understand data that is presented visually. Through the use of interactive interfaces, visual analytics provides a mechanism through which the operator, engineer, and decision-maker can cooperate in real-time with both simulation, experimental, and operational data, facilitating trade studies, what-if analysis, and providing crucial insight into correlations and relationships that drive process optimization. As an exemplar, the concept of visual analytics is applied to the simulation of a notional high pressure die casting process, with the goal of gaining insight into those parameters that contribute to high scrap rates, particularly air entrapment.
© 2016 The Authors. Published by Elsevier B.V.
Peer-review under responsibility of the Scientific Committee of the “9th International Conference on Digital Enterprise Technology - DET 2016.
Keywords: high pressure die casting; visual analytics; manufacturing process; decision-making
1.Introduction
High pressure die casting (HPDC) is the dominant means of producing aluminium alloy castings for the automotive industry. Traditionally, it was primarily used for casting engine components but as the requirements to reduce cost and weight have increased and sustainability demands full recyclability, HPDC is now also being used to cast complex car body components such as sub-frames, suspension components and even the structural framework for car doors. Across the industry, the complexity of castings is tending to increase with finer detail applied to minimise unnecessary material. This of course increases the difficulty for the HPDC industry to manufacture consistent castings.
1.1.The High Pressure Die Casting Process
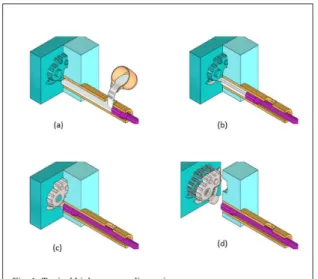
In essence the high pressure die casting process is quite simple. Molten metal, in this case aluminium alloy, is lifted in a crucible attached to a robotic manipulator from a holding furnace and is decanted from the crucible into a shot tube through a hole in the top; at this point the metal only fills the lower half of the shot tube (Fig. 1a). A piston in the shot tube pushes the metal forward towards the die at moderate velocity (typically below ½ m/s) causing the level to rise until the tube is completely full (Fig. 1b); during this phase a vacuum is applied to the die to reduce the possibility of entrained air being trapped in the casting. This achieved, the piston velocity increases twentyfold, filling the die with metal in approximately one tenth of a second (Fig. 1c). The die being liquid cooled causes the liquid metal in contact with its surface © 2016 The Authors. Published by Elsevier B.V. This is an open access article under the CC BY-NC-ND license
(http://creativecommons.org/licenses/by-nc-nd/4.0/).
to chill and over a few seconds the casting will solidify. When the metal is completely solid, the die halves open allowing a robotic manipulator to grab the casting as ejector pins push it away from the fixed die (Fig. 1d). With this completed the die closes and the process can begin again, with the whole cycle takes less than 2 minutes for large parts.
Ideally when castings are produced they should all be perfect. Realistically, there will always be some scrap castings manufactured; perhaps one or two percent is acceptable. Unfortunately, with some complex parts this can rise to as much as 10% and even higher. Of course the scrap is recycled, although each time metal is remelted energy is consumed and a small amount of the aluminium will be lost as it oxidises to form dross. In addition the cost of running the casting machine is lost and the factory’s casting capacity is reduced.
Although the casting process is in essence simple, there are hundreds of parameters that affect the process, resulting in unacceptable scrap rates that further lead to loss of revenue and a decrease in factory casting capacity. Traditionally, all of the parameters are manually adjusted to produce good castings based on the experience of the die casting engineer. Experience will have determined boundaries for many parameters to allow good castings for most of the time. However, this manual process if often untraceable, unrepeatable, and notably does not add overall insight into the effect of the parameters themselves on the outcome. This paper aims to address the early phase of a project to analyse the consequences of parametric variability in a production environment with the objective of making the manufacturing process as robust as possible and consequently reducing the level of scrap produced for complex automotive engine castings, such as a cylinder block.
1.2.Current Die Casting Optimization
Substantial research has been done on the optimization of the high pressure die casting process. Taguchi’s method has been applied by some scholars [1-3] to the die-casting process in order to establish the optimal combination of design parameters. Their study focused on investigation of effects of various die casting control parameters, including the die temperature, injection velocity, and cooling time on the defects in the castings. While other researchers used design of experiments techniques [4-7] for experimentation, the data was further analysed to optimise defects like shrinkage, gas porosity and cold shuts.
Soft computing techniques such as artificial neural networks and genetic algorithms were used by various researchers to map the complex relationship between process conditions and quality indexes [1, 8-11]. Unlike traditional hard computing, the essence of soft computing is that it is aimed at accommodating the universal inaccuracy of the real world. Thus, the principle of soft computing is to exploit the tolerance for imprecision, uncertainty, and partial truth to achieve robustness, low solution cost, and better rapport with reality[12].
In other research, computational fluid dynamics software packages such as Meltflow and ProCAST were used to simulate, verify experimental results and optimize casting design/process by using qualitative parameters [11, 13, 14]. For analysis of defects, computer aided casting simulation techniques can be efficient and accurate. The quality and yield of the casting can be efficiently improved by computer assisted casting simulation technique in shortest possible time and without carrying out the actual trials on foundry shop floor. However, optimization for casting integrity requires a quantitative casting integrity assessment technique, which allows the modelling and quantification of defects [15]. Krimpenis et al., have rightly stated that although die-casting parameters have been studied by various researchers, a unified method that can optimize all process parameters simultaneously regarding one criterion or a combination of criteria is still at its infancy [11]. Die-casting is a typical multidisciplinary system involving many disciplines such as hydrodynamics, heat transfer and elastic-plastic mechanics and their coupled relations are intricate. Moreover there are many inherent uncertainties. Yourui et al, [16] proposed a reliability-based multidisciplinary optimization (RBMDO) model and concluded that the application of RBMDO procedure is suited to optimize the multidisciplinary system like die-casting with epistemic uncertainty.
All of the above research and optimization strategies rely on finding a single, optimum setting of parameters to maximize results and minimize defects for a specific die casting circumstance. The key difference to using a visual analytics approach to explore the same data set is the inherent understanding and insight into the behavior of the process that is gained by the analyst. This insight is then translated into parameter strategies that are applicable across a wide variety of process circumstances.
2.Visual Analytics
The September 11, 2001 terrorist attacks on the United States posed a significant data challenge. Government agencies and emergency responders were forced to assess, analyse, and react in real time to a massive amount of diverse, complex, and rapidly changing data [17]. In response to this serious issue, the newly established US Department of Homeland Security (DHS) put forth a series of goals and objectives that led to the identification of key enablers in various scientific fields and disciplines that would aid its mission of safeguarding the American people [18]. The emerging field of visual analytics was identified as one such enabler, and in 2004, the DHS chartered the National Visualization and Analysis Center (NVAC) to deliver ‘a national and international resource providing strategic leadership and coordination for visual analytics technology and tools’ [19]. A key deliverable of the NVAC was the development of a research agenda for visual analytics. The resulting document, Illuminating the Path: the R&D agenda for visual analytics [20], was published in 2005 and has become the definitive resource for the emerging scientific discipline of visual analytics.
2.1 Defining Visual Analytics
Visual analytics is defined as ‘the science of analytical reasoning facilitated by interactive visual interfaces’ [20]. In its most fundamental form, analytical reasoning is understood to be a process by which something is studied in order to identify its fundamental characteristics as well as gain insight into any principal relationships. Visual analytics is considered a hybrid science that leverages the extraordinary human eye/brain capability to rapidly recognize and analyse patterns and features, including anomalies, in extremely complex visual data [21]. When coupled with analytical reasoning, this visual capability allows vast amounts of information to be rapidly internalized and understood. Thus, visual analytics couples ‘the art of human intuition and the science of mathematical deduction directly to perceive patterns and derive knowledge and insight from them’ [22]. A key feature of visual analytics is human interaction. Data is not presented statically, but rather tools and environments are developed that allow the user to interact directly with the data, manipulating variables in real time and assessing the resulting responses. This interaction not only increases understanding of the information, it facilitates superior judgements with minimal time investment. Another key advantage to using a visual analytics paradigm is the ability to graphically characterize the variability of input parameters, providing the user with a significant improvement in their understanding of how changes to input variables quantitatively and qualitatively affect the results.
It is important to distinguish the difference between the science of visual analytics and the process of data mining coupled with a visual output. Data mining can be defined as ‘the process of exploring abstract data in the search for valuable and unexpected patterns’ [23]. Although automated data mining can be efficient, data mining algorithms are often
biased towards finding a particular outcome [24]. Likewise, even innovative visualization techniques in isolation are rarely sufficient to produce insight into a complex data set [25]. Teoh et al [26] thus argues that visual analytics is the preferred method compared to algorithmic data mining, particularly when the intent is to explore and understand a particular data set with no preconceived notions of expected outcome.
2.1.Visual Analytics as Applied to High Pressure Die Casting
The overall goal of a wider body of funded research is to identify and propose strategies to minimize scrap rates for a large high pressure die casting company. As an initial step, preliminary visual analytics studies were conducted on a high fidelity die casting simulation in order to gain insight into the behavior and effect of key process parameters. It is this portion of the overall research that is reported here.
3.Results
3.1.Defining the Model
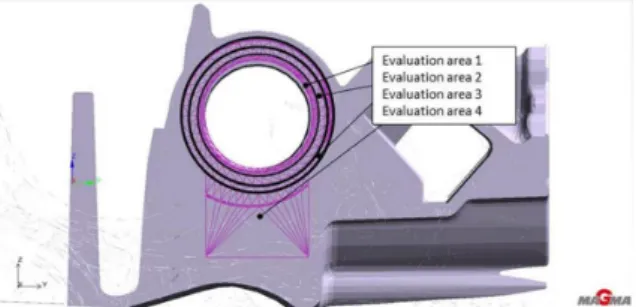
It was decided that the initial exploration of parameters would be conducted by creating a simulation model of a typical die casting part, and using the data created via the model to explore parameter effects on defects. A 3-cylinder engine block was chosen as a representative die casting part for modelling. MAGMA5, developed and supplied by Giessereitechnologie GmbH, was the simulation software used to create the model. MAGMA5 is used world-wide by foundries, casting buyers and designers, especially for the optimization of cast components in automotive and heavy industry applications, and is considered the global industry standard for the simulation of casting processes. Fig. 2 shows the model of the part created with MAGMA5, and illustrates the four key areas of interest for evaluation.
Initially, four process parameters were chosen for exploration: switch over position (distance moved when the piston velocity increases from first phase to second phase velocity in the shot tube), the first phase velocity, the second phase velocity, and the biscuit thickness. Surrogate models of the simulation were created utilising a central composite design and analysis of variance (ANOVA) was used to verify the model statistical accuracy. The primary responses of interest were the air entrapment in each of the evaluation areas.
3.2.Visualization of Effect of Evaluation Area
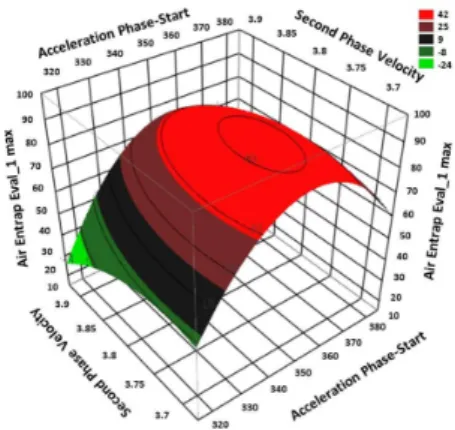
Initial visualizations of the resulting models clearly indicate a complex behavior, even when considering the fairly small set of process parameters of interest. Fig. 3 plots the switch over position (referred to in the plots as ‘acceleration phase-start’) against second phase velocity and maximum air entrapment in the first evaluation area. The brighter green contours indicate areas of minimum entrapment. This is in contrast to Fig. 4, which shows a more benevolent behavior and which favors a different combination of process parameters in the nearby second evaluation area. Similarly, Fig. 5, of evaluation area 3, shows a quite different behavior from that in Fig. 3 and 4, yet physically the evaluation areas are quite close together. These results, shown statically here, are even more readily identifiable when the user manipulates the data interactively. Now that a behavior of interest has been identified, the user may go back and investigate potential reasons for the behavior, which will increase understanding of
the behavior, potentially leading to new insights. 3.3.Visualization of Effect of Second Phase Velocity
Figures 6 a-c show air entrapment as a function of switch over position and first phase velocity, for different values of second phase velocity. As the second phase velocity is progressed from 3.67 m/s in Fig. 6(a) to 3.92 m/s in Fig. 6(c), the surface shape of the response changes markedly. The lighter green areas show the preferred region (lower air entrapment), with the darker red regions indicating areas of increased air entrapment. Looking at Fig. 6(a), there is a clear region of preferred minimal air entrapment (values less than 10). However, this area is quite small and can only occur with very specific combinations of acceleration start phase and first phase velocity. Also, most combinations of these same parameters produce large and unacceptable areas of air entrapment. As second phase velocity is increased, Fig. 6(b), it can be seen that the area of lowest air entrapment does increase slightly for a broader range of parameters, yet any combination of parameters still produce significantly less air entrapment overall than at lower values of second phase velocity. This is indicative of a more robust set of parameter settings. Further increases in second phase velocity, however, result again in increased areas of large air entrapment, but this time the combination of parameters that produce smaller values of air entrapment are exactly opposite, at the other end of the parameter ranges, than at lower second phase velocity values. Although somewhat difficult to convey statically, this trend becomes very clear and intuitive when viewed interactively. While a traditional optimization process may identify the specific combination of parameters that would produce the optimal lowest value of air entrapment, in reality it may be quite difficult to set and hold such a specific combination of parameters. It is much more likely that variability and tolerances in machine settings, as well as operator capability, would result in potentially off-optimum settings. If an understanding of the shape and sensitivity of the relationship surface is developed through the use of visual interaction and analytical reasoning, combinations of settings that produce consistently robust results, even if off-optimum, may be preferred.
Fig. 3. Maximum air entrapment in evaluation area 1 as a function of acceleration phase and second phase velocity
Fig. 4. Maximum air entrapment in evaluation area 2 as a function of accleration phase and second phase velocity
Fig. 5. Maximum air entrapment in evaluation area 3 as a function of acceleration phase and second phase velocity
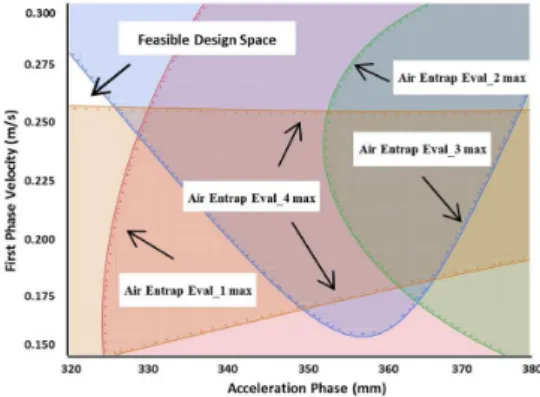
3.4.Visualization of the Design Space
Finally, Fig. 7 shows how a dynamic trade space can be created to lend insight into areas of feasible design, as well as characterizing the effect of process parameters. Fig. 7(a) plots contours of maximum air entrapment for each of the four evaluation areas. In this example, values of 40 or less are considered acceptable for each area. (The dynamic environment, however, allows for the changing of these values in order to further explore the design space.) Returning to Fig 7(a), it is seen that only a small design space exists that allows simultaneous achievement of acceptable air entrapment for all of the evaluation areas. There are therefore limited combinations of first phase velocity and acceleration phase that correspond to the open design space for a given second phase velocity. Fig 7(b) then shows how the plot changes as the second phase velocity is increased. It is important to note that the resulting design space is now not continuous, particularly across the first phase velocity. If a continuous range of first phase velocity was therefore proposed (in this example, between 0.15 and 0.287), then minimizing air entrapment in evaluation area 4 must be sacrificed. Continuing to increase the second phase velocity to its maximum value used in the study results in Fig 7(c). Now it can be seen the original design space has closed up, and a new design space, corresponding to a different range of process parameters, has opened up. Interactive exploration using plots of this sort not only provide insight into the complex behavior of the data, they allow for the establishment of rules of good practice, as well as identifying the sensitivity of off-optimal solutions.
Fig. 6(a)-Air entrapment in evaluation area 1 with a second phase velocity of 3.67 m/s
Fig. 6(b)-Air entrapment in evaluation area 1 as second phase velocity is further increased
Fig. 6(c)-Air entrapment in evaluation area 1 with a second phase velocity of 3.92 m/s
3.5.Conclusions
This paper introduces visual analytics as an enabler for process parameter optimization for high pressure die casting. Unlike pure mathematical optimization, the intent of visual analytics is to allow the user to interact with large data sets, thereby gaining insight into complex behavior, and allowing optimization to occur through consideration of parameter settings that may provide robust, rather than single point, optimization.
Acknowledgements
This research has been funded under an InvestNI grant entitled ‘Improving Cast Part Quality Through Process Optimization.’
References
[1] Zheng, J., et al., Optimization of high-pressure die-casting process parameters using artificial neural network. The International Journal of Advanced Manufacturing Technology, 2009. 44(7-8): p. 667-674. [2] Zheng, J., et al., Optimization of high-pressure die-casting process
parameters using artificial neural network. The International Journal of Advanced Manufacturing Technology, 2009. 44(7-8): p. 667-674.
[3] Chang, M.S., Use of Taguchi method to develop a robust design for the magnesium alloy die casting process. Materials Science and Engineering: A, 2004. 379(1): p. 366-371.
[4] Verran, G.O., R.P.K. Mendes, and M.A. Rossi, Influence of injection parameters on defects formation in die casting Al12Si1, 3Cu alloy: Experimental results and numeric simulation. Journal of materials processing technology, 2006. 179(1): p. 190-195.
[5] Verran, G., R. Mendes, and L. Dalla Valentina, DOE applied to optimization of aluminum alloy die castings. Journal of materials processing technology, 2008. 200(1): p. 120-125.
[6] Kittur, J.K., M. Choudhari, and M. Parappagoudar, Modeling and multi-response optimization of pressure die casting process using multi-response surface methodology. The International Journal of Advanced Manufacturing Technology, 2015. 77(1-4): p. 211-224.
[7] Dabade, U.A. and R.C. Bhedasgaonkar, Casting defect analysis using design of experiments (DOE) and computer aided casting simulation technique. Procedia CIRP, 2013. 7: p. 616-621.
[8] Zhang, L. and R. Wang, An intelligent system for low-pressure die-cast process parameters optimization. The International Journal of Advanced Manufacturing Technology, 2013. 65(1-4): p. 517-524.
[9] Yarlagadda, P.K. and E.C.W. Chiang, A neural network system for the prediction of process parameters in pressure die casting. Journal of Materials Processing Technology, 1999. 89: p. 583-590.
[10] Tai, C. and J. Lin, The optimal position for the injection gate of a die-casting die. Journal of Materials Processing Technology, 1999. 86(1): p. 87-100.
[11] Krimpenis, A., et al., Simulation-based selection of optimum pressure die-casting process parameters using neural nets and genetic algorithms. The International Journal of Advanced Manufacturing Technology, 2006. 27(5-6): p. 509-517.
[12] Shukla, A., R. Tiwari, and R. Kala, Real life applications of soft computing. 2010: CRC Press.
[13] Nikroo, A.J., M. Akhlaghi, and M.A. Najafabadi, Simulation and analysis of flow in the injection chamber of die casting machine during the slow shot phase. The International Journal of Advanced Manufacturing Technology, 2009. 41(1-2): p. 31-41.
[14] Vijayaram, T.R., et al., Numerical simulation of casting solidification in permanent metallic molds. Journal of materials processing technology, 2006. 178(1): p. 29-33.
[15] Reilly, C., N. Green, and M.R. Jolly, The present state of modeling entrainment defects in the shape casting process. Applied Mathematical Modelling, 2013. 37(3): p. 611-628.
[16] Yourui, T., D. Shuyong, and Y. Xujing, Reliability modeling and optimization of die-casting existing epistemic uncertainty. International Journal on Interactive Design and Manufacturing (IJIDeM), 2014: p. 1-7. [17] National Commission on Terrorist Attacks upon the United States.
(Philip Zelikow, Executive Director; Bonnie D. Jenkins, Counsel; Ernest R. May, Senior Advisor). The 9/11 Commission Report. New York: W.W. Norton & Company, 2004.
[18] Securing our Homeland, U.S. Department of Homeland Security
Strategic Plan, 2004.
http://www.iwar.org.uk/homesec/resources/dhs/strategic-plan.pdf [19] National Visualization and Analytics Center, http://nvac.pnl.gov/ ,
accessed March, 2011.
[20] James J. Thomas and Kristin A. Cook (Ed.) Illuminating the Path: The R&D Agenda for Visual Analytics. National Visualization and Analytics Center, 2005.
[21] Ahlberg, C. and Shneiderman, B., “Visual Information Seeking: Tight Coupling of Dynamic Query Filters with Starfield Displays”, Proceedings. CHI ‘94: Human Factors in Computing Systems, ACM Press, 1994, pp. 313-317.
[22] Wong, Pak Chung, and Jim Thomas. "Visual Analytics." Computer Graphics and Applications, IEEE . 24.5 (2004): 20-21.
[23] Nesbitt, Keith V., and Stephen Barrass. "Finding Trading Patterns in Stock Market Data." Computer Graphics and Applications, IEEE . 24.5 (2004): 45-55.
[24] Pike, W., Stasko, J., Cheng, R. and O’Connell, T., “The Science of Interaction”, Information Visualization, Volume 8, 4, 263-274. [25] Teoh S., Ma, K. and Wu, S., “Detecting Flaws and Intruders with Visual
Data Analysis”, Computer Graphics and Applications, IEEE . 24.5 (2004): 27-35.
Fig. 7(b). Changes in feasible design space as second phase velocity is