Florida International University
FIU Digital Commons
FIU Electronic Theses and Dissertations University Graduate School
11-21-2017
The Study of Tissue-Specific DNA Methylation as
a Method for the Epigenetic Discrimination of
Forensic Samples
Joana AP Antunes
DOI:10.25148/etd.FIDC006582
Follow this and additional works at:https://digitalcommons.fiu.edu/etd Part of theBiochemistry, Biophysics, and Structural Biology Commons
This work is brought to you for free and open access by the University Graduate School at FIU Digital Commons. It has been accepted for inclusion in FIU Electronic Theses and Dissertations by an authorized administrator of FIU Digital Commons. For more information, please [email protected].
Recommended Citation
Antunes, Joana AP, "The Study of Tissue-Specific DNA Methylation as a Method for the Epigenetic Discrimination of Forensic Samples" (2017).FIU Electronic Theses and Dissertations. 3676.
FLORIDA INTERNATIONAL UNIVERSITY Miami, Florida
THE STUDY OF TISSUE-SPECIFIC DNA METHYLATION AS A METHOD FOR THE EPIGENETIC DISCRIMINATION OF FORENSIC SAMPLES
A dissertation submitted in partial fulfillment of the requirements for the degree of
DOCTOR OF PHILOSOPHY in
BIOCHEMISTRY by
Joana Alexandra Pereira Antunes
To: Dean Michael R. Heithaus choose the name of dean of your college/school
College of Arts, Sciences and Education choose the name of your college/school
This dissertation, written by Joana Alexandra Pereira Antunes, and entitled The Study of Tissue-specific DNA Methylation as a Method for the Epigenetic Discrimination of Forensic Samples, having been approved in respect to style and intellectual content, is referred to you for judgment.
We have read this dissertation and recommend that it be approved.
_______________________________________ Yuan Liu _______________________________________ DeEtta Mills _______________________________________ Kuppareddi Balamurugan _______________________________________ José Almirall _______________________________________ George Duncan _______________________________________ Bruce McCord, Major Professor Date of Defense: November 21, 2017
The dissertation of Joana Alexandra Pereira Antunes is approved.
_______________________________________
choose the name of dean of your college/school Dean Michael R. Heithaus
choose the name of your college/school College of Arts, Sciences and Education
_______________________________________ Andrés G. Gil Vice President for Research and Economic Development
and Dean of the University Graduate School Florida International University, 2018
© Copyright 2018 by Joana Alexandra Pereira Antunes All rights reserved.
DEDICATION I dedicate this work to you.
What brought me here were the struggles, laugh, happiness and sadness from me, my ancestors’ and their ancestors and all the elements that combined to make us all.
ACKNOWLEDGMENTS
I would like to thank all of those who made this work possible. In my daily life, I get to interact with many people that affect my perception and challenge me to grow. Moving to Miami was one of the most difficult things I’ve endured in my life, which means it brought one of the most valuable opportunities to grow, and I did. This work represented the most stable form of that growth. I was able to see my work capacities, including my limitations and my strengths as a researcher, and evolve from them. Everyone I’ve encountered either further challenged me or held my hand to help me move. Each one showed up exactly when they were supposed to.
First I would like to thank Dr. McCord. His optimism and belief in me happened even before I arrived in Miami. Following my arrival and during my research efforts, he showed great support and understanding of my goals, not only with my work, but also in my personal life. Words cannot describe the profound admiration and appreciation I have for him as a scientist, a leader, and a person. Thank you!
Another individual with whom I contacted regularly regarding this project is Dr. Duncan. His dedication and profound interest in science, being informed of recent
developments, all novelty and technology is inspiring. From the many explorations of this topic to the many other topics we’ve talked about along the years, I sincerely hope to keep contact with you in the future and hopefully develop great ideas together. Thank you!
To my dissertation committee, thank you for your support and challenging ideas you have developed with me throughout these years. Thank you for believing in my
abilities to succeed in this degree and for getting through the ups and downs that existed along the way.
Dr. Bala, thank you for all your help in troubleshooting methods, experiments, and ideas on this project. Having you as a collaborator, and also my committee member allowed me to consult with you more often than only in committee meetings. Your contribution to this project is amazing and continues to provide more pieces of this puzzle so that one day all of this can be routine use in forensic laboratories.
Dr. Liu, ever since the first time I talked to you I have received the upmost respect and also felt great admiration for your work. Thank you for being a great teacher of
biochemistry and to always bring up the more fundamental aspect of my research, which is by itself a separate work from its forensic application.
Dr. Mills, thank you for showing me the side of forensics that deals with non-human samples. Whether it is for species protection or on the use of other species cues to help human cases, the diversity of fields your research includes is truly admirable. It is very inspiring for me to have you as a model representing the professional woman in the forensic field.
Dr. Almirall, thank you for your continuous support and belief in this work and my ability to succeed. Even though the topic of this dissertation is somewhat different from your day-to-day work, I am extremely grateful for your dedication to this project demonstrated so many times during my annual evaluation presentations.
I also would like to thank all my lab mates throughout the years that helped me to grow as a researcher.
I would like to thank my parents and brother, Silvia Antunes, Francisco Antunes and João Antunes that continuously reached out, worried, loved, supported, nourished, amazed me, all the way from across the Atlantic, sending emails, calling and texting and always, every time, receiving me with hugs, kisses and nothing but love at every
opportunity I had to go back home and visit. I love you. Thank you! To the Portuguese people, for nurturing me into who I am, for providing me with a common sense that sometimes clashes with other cultures, challenging me to question my core beliefs and allowing me to grow as an individual. I do things this way because of the way all of you brought me through your culture.
To the practice of budokon, the people I met because of it, and the tools it gave me to better understand myself, my thoughts, my beliefs, my relationship with others, my most human compassionate form. ‘The way you do anything is the way you do
everything’. The acroyoga community that allowed me to see the fun in working out, the positive thinking that exists in the middle of the crowd that inhabits this city. Thank you for being my support system.
Natasha thank you for being my friend. Thank you for listening to me, supporting and helping me so many times, in so many ways. Thank you for being an inspiration in the yoga practice, for guiding my own practice, for sharing your discoveries in adjusting poses and adjusting beliefs. Love you!
Lauren, Deb and João, you made my life at FIU so much more fun! Happy hour took a whole new meaning because of you. I’m looking forward to reuniting with you in a near future. Love you!
To Victoria, Alex and Dileydis – when are we going to live together in the same house again? I think I would’ve given up everything if I didn’t have you in my life at that time. Being your roommate and friend was one of the best random, amazing things that happened in my life. Love you guys, even you Alex!
Saucy, thank you for all your support and help. I am lucky to have had you in my life and as a roommate. Love you girl! Karla, indirectly through you I learned so much about environmental preservation, the activism surrounding it and how to keep thinking positively, even when facing such negative things.
David, thank you for showing me the other side of liberalism. Thank you for your support in writing this work, thank you for being an inspiration regarding focus and attention in one task at a time. Thank you for making sailing a possibility. Love you!
Additionally, I would like to thank the National Institute of Justice for funding my research; Qiagen, especially Mark Guilliano, for the interest and technical support in my work and Florida International University for the opportunity to develop this work.
ABSTRACT OF THE DISSERTATION
THE STUDY OF TISSUE-SPECIFIC DNA METHYLATION AS A METHOD FOR THE EPIGENETIC DISCRIMINATION OF FORENSIC SAMPLES
by
Joana Alexandra Pereira Antunes Florida International University, 2018
Miami, Florida
Professor Bruce McCord, Major Professor
In forensic sciences, the serological methods used to determine which body fluid was collected from the crime scene are merely presumptive or labor intensive since they rely on protein detection or on microscopic identification of cells. Given that certain forensic cases may need the precise identification of a body fluid to determine criminal contact, such is the example of a suspected sexual assault of a minor; certainty in the body fluid of origin may depict a precise picture of the events. The identification of loci that show differences in methylation according to the tissue of origin can aid forensic analysts in determining the origin of a DNA sample. The process of DNA methylation occurs naturally in the genome of living organisms and consists in the presence of a methyl group on the carbon 5 of a cytosine, which is typically followed by a guanine (CpG). Analyzing patterns of DNA methylation in body fluids collected from a crime scene is preferential to the analysis of proteins or mRNA since the same extracted DNA used for STR typing can be used for DNA methylation analysis. We have validated and identified loci able to discriminate blood, saliva, semen and vaginal epithelia. In the current study, we have also established the minimum amount of DNA able to provide
reliable results using methodologies such as pyrosequencing and high-resolution melt (HRM) analysis for the different markers identified. Lastly, we performed an alternative bioinformatic analysis of data collected using an array that studied methylation in over 450,000 individual cytosines on the human genome. We were able to sort the locations that showed potentially higher methylation differences between body fluids and
investigated over 100 of them using HRM analysis. The results of that study, allowed the identification of three new loci able to distinguish blood and two new loci able to
distinguish saliva and vaginal epithelia, respectively.
The use of DNA methylation patterns to aid forensic investigations started with a publication in 2010, therefore each small contribution such as this work may, similarly to what occured in the biochemistry field, result in the discovery of a method able to put the technology in the hands of forensic analysts.
TABLE OF CONTENTS
CHAPTER PAGE
I –INTRODUCTION AND LITERATURE REVIEW ... 1
A. The Molecular Structure and Biochemistry of DNA ... 1
B. The Location of Genomic DNA and the Central Dogma ... 4
C. The Structure of the Eukaryotic Cell ... 10
D. The Cell Cycle ... 12
E. DNA organization in Nucleosomes and Chromosomes ... 14
F. Epigenetics ... 16
G. DNA Methylation ... 20
II – FORENSIC DNA ANALYSIS ... 34
A. History and Advancements in Technology ... 34
B. Methods used in Forensic Laboratories for DNA analysis ... 38
B.1 Sample Collection ... 38
B.2 DNA Extraction ... 40
B.3 DNA Quantitation ... 42
B.4 Polymerase Chain Reaction (PCR) ... 49
B.5 Capillary Electrophoresis ... 53
B.6 Methods for Body Fluid Identification ... 58
B.7 Description of the problem ... 66
III – FORENSIC EPIGENETICS ... 72
A. DNA Methylation Analysis for Forensic Applications ... 72
B. Methods to Analyze DNA Methylation Patterns ... 72
B.1 Restriction Enzymes ... 73
B.2 Bisulfite Modification ... 75
B.3 Pyrosequencing ... 76
B.4 High-Resolution Melt (HRM) Analysis ... 81
B.5 Methylation-Sensitive Single Nucleotide Primer Extension ... 85
C. State of the Art ... 87
IV - FORENSIC DISCRIMINATION OF VAGINAL EPITHELIA BY DNA METHYLATION ANALYSIS THROUGH PYROSEQUENCING ... 89
A. Abstract ... 90
B. Introduction ... 90
C. Material and Methods ... 93
D. Results and Discussion ... 95
E. Concluding Remarks ... 103
V - VALIDATION OF FORENSIC MARKERS BY PYROSEQUENCING AND SNAPSHOT ... 104
A. Developmental Validation Studies of Epigenetic DNA Methylation
markers for the detection of Blood, Semen and Saliva samples ... 105
A.1 Abstract ... 105
A.2 Introduction ... 106
A.3 Materials and Methods ... 108
A.4 Results and Discussion ... 115
A.5 Conclusion ... 126
B. A Collaborative Exercise on DNA Methylation-based Body Fluid Typing ... 127
B.1 Abstract ... 127
B.2 Introduction ... 128
B.3 Materials and Methods ... 130
B.4 Results and Discussion ... 138
B.5 Conclusion ... 145
VI – HIGH-RESOLUTION MELT ANALYSIS OF DNA METHYLATION TO DISCRIMINATE SEMEN IN BIOLOGICAL STAINS ... 147
A. Abstract ... 148
B. Introduction ... 148
C. Methods ... 151
D. Results and Discussion ... 153
E. Conclusion ... 161
VII - IDENTIFICATION OF NEW CpGs ABLE TO DISCRIMINATE BODY FLUIDS FROM CRIME SCENES ... 163
A. Introduction ... 163
B. Materials and Methods ... 167
C. Results ... 172
D. Discussion ... 179
E. Conclusion ... 183
VIII – CONCLUDING REMARKS ... 185
IX – FUTURE DIRECTIONS ... 189
LIST OF REFERENCES ... 191
LIST OF TABLES
TABLE PAGE
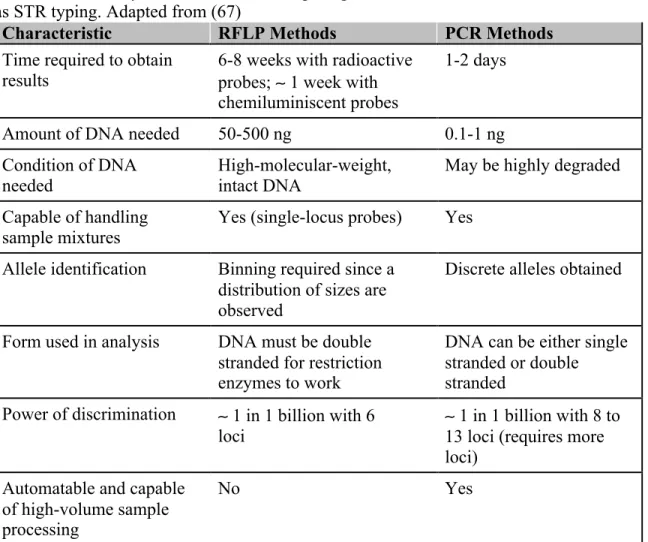
1.1Summary of characteristics comparing RFLP and methods based on PCR, such as
STR typing. Adapted from (67) ... 37
4.1 Sequence of PFN3A primers used in this study. ... 94
5.1 Panel of markers used in this study ... 111
5.2 Methylation profiles of the three loci investigated in this study ... 115
5.3 Methylation profiles of the three investigated loci when testing menstrual blood, vaginal epithelia and nasal epithelia/secretion samples. Comparison with methylation levels of the three main fluids investigated in this study. ... 117
5.4 Methylation profiles of the three investigated loci when using low amounts of pre-modified DNA.. ... 119
5.5 Methylation levels of simulated case-type samples ... 123
5.6 Overview of the samples and experiments required in each part of collaborative exercise ... 131
5.7 Summary of the kits, chemicals and instrumentation used in 7 participating laboratories ... 137
5.8 Summary of settings and instruments used to analyze the SBE products in the 7 participating laboratories ... 138
6.1 Sequence of the primers used in this study ... 152
7.1 Summary of parameters used to filter CpGs by ratio of methylated versus unmethylated probes for each target body fluid. The number of CpGs displayed correspond to those obtained from each parameter only. ... 173
7.2 List of primer sequences for the 5 markers identified in this study. Fw stands for forward primer and Rv stands for reverse primer ... 174
7.3 Summary of the TM values for the loci identified in this study as potential markers for blood and vaginal epithelia (VE). TM ± SD for each body fluid represents an average melting temperature value and standard deviation calculated for 10 samples analyzed per body fluid, 3-4 samples analyzed for the unmethylated (UnM) and methylated control (M). ... 174
7.4 Average TM of amplified samples with the markers INPPD200_TM60, VE_8
and ZC3H12D at 54 ºC annealing. Values displayed are of 3 samples of blood, saliva, semen and vaginal epithelia (VE) and 2 samples of each unmethylated (UnM) and methylated (M) control. ... 178
LIST OF FIGURES
FIGURE PAGE
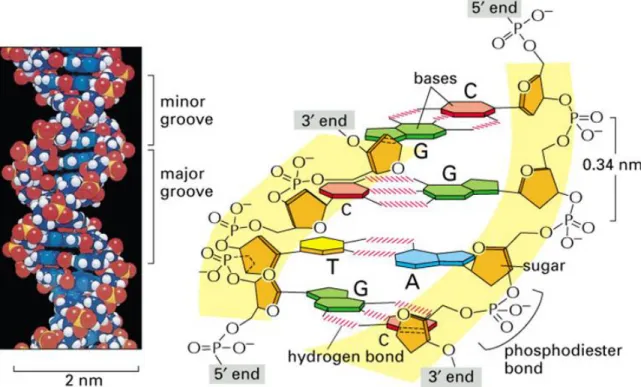
1.1 The structure of the DNA double helix showing hydrogen bonds between two antiparallel strands. The nucleotides on the same strand are linked together by
phosphodiester bonds through the 3’-OH of one group to the 5’-phosphate of the next. Adapted from (4) ... 2 1.1Schematic representation showing all the genomic and epigenomic factors and
mechanisms involved in gene regulation. The center of the figure represents 4 nucleosomes and the main mechanisms for epigenetic regulation such as DNA methylation (red circle with Me), histone modifications (Mod), histone variants (yellow nucleosome) and non-coding RNA (wavy blue lines). The brown boxes display genomic functions that affect epigenome modifications and help in its regulation. The main factors needed for genomic functions are shown near the boxes. Adapted from (22). ... 19 pdf re
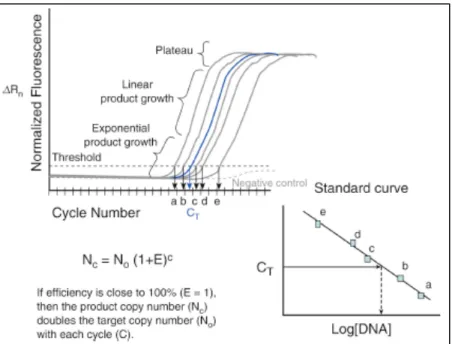
1.3 Schematic representation of the enzymes and the chemical modifications they catalyze. Cytosine is modified to 5-methylcytosine by DNMTs. The methylated cytosine can undergo modification by one enzyme of the TET group which converts it to 5-hydroxymethylcytosine, which can be further oxidized to 5-formylcytosine (5-fC) and 5-carboxylcytosine (5-caC). The conversion back to unmethylated cytosine can be catalyzed by thymine-DNA glycosylase (TDG) – mediated base-excision repair (BER) or by decarboxylases. Adapted from (25) ... 28 2.1 Schematic representation of the calculations performed for DNA quantification using methods based on real-time PCR. The increase of fluorescence as a result of increasing copies of DNA are displayed in a graph of normalized fluorescence versus
cycle number (CT). On a second graph the CT is plotted against the Log of the
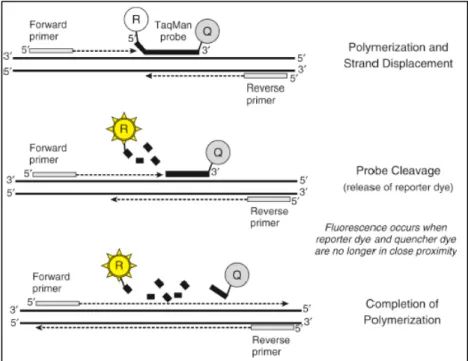
concentration of DNA for the standard solutions (with known DNA concentration). The concentration of samples can be extrapolated from the linear regression line and the efficiency is also calculated. Adapted from (79) ... 44 2.2 Schematic representation of TaqMan probes and their mode of function. Adapted from (79) ... 46 2.3 Schematic representation of how Plexor chemistry fluorescently labels each
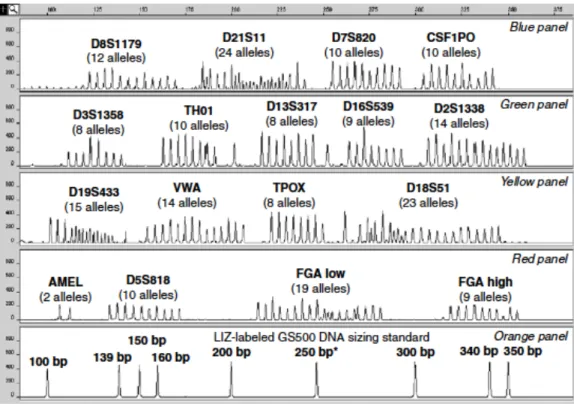
amplicon produced from primers tagged with the same fluorophore. Adapted from (82) ... 47 2.4 Schematic representation of all possible alleles for 16 STRs plus the sex marker amelogenin. The STRs are displayed in electropherograms separated by fluorophore colors and sizes in base pairs. Adapted from (103) ... 56
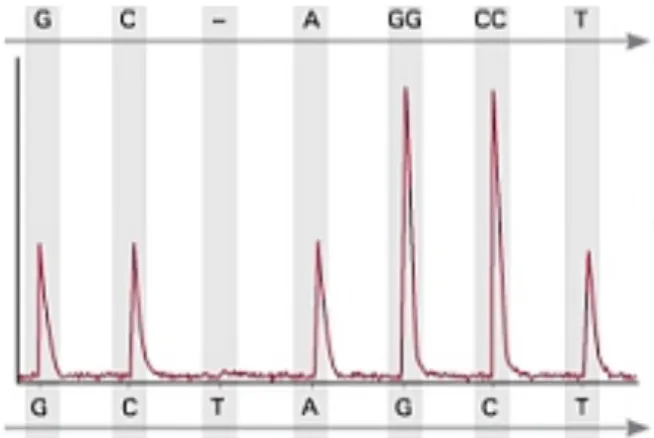
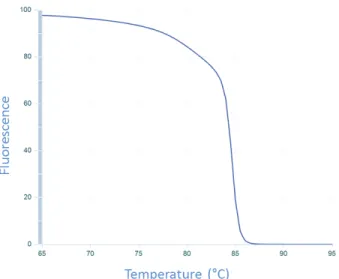
3.1 Pyrogram depicting the relative peak height for all the nucleotides dispensed when sequencing the fragment ‘GCAGGCCT’. The pyrogram only shows peaks when the dispensed nucleotide is in the sequence. The relative peak heights for a position with two repeated nucleotides (‘GG’ and ‘CC’) are double the height of peaks in positions that contain only single nucleotides. Adapted from (154) ... 78 3.2 Pyrogram showing the percent methylation in 5 CpGs (highlighted in blue). The peaks corresponding to ‘C’ are very low when compared to ‘T’, which makes the methylation level to be below 10% for all peaks. The pyrogram shows relative light units on the y-axis and position on the target sequence on the x-axis. The ‘E’ and ‘S’ on the beginning of the x-axis correspond to the dispensation of enzyme and substrate mixtures, respectively. The ‘C’ highlighted in red shows the bisulfite control. On top of the pyrogram is shown the sequence to analyze, where ‘Y’ corresponds to a CpG. ... 79 3.3 Schematic representation of differences in melt curve analysis for one DNA target with different methylation status. The melt peaks will locate at different temperatures depending on methylation. Adapted from (161) ... 83 3.4 Schematic representation of the decrease in fluorescence resulting from
intercalating dye release during the separation of the double strands of a PCR product. The slope resulting from the sudden drop in fluorescence is plotted versus temperature to better represent the TM of the PCR product. Adapted from (160) ... 84
4.1 Graph showing mean percent of methylation for samples of blood (n=8), saliva (n=11), semen (n=12) and vaginal epithelia (n=10) with 50 ng input to bisulfite. * CpG where the difference in methylation levels is not statistically significant
(p<0.05) between vaginal epithelia and blood. ... 96 4.2 Graph showing mean percent of methylation for vaginal epithelia samples (n=6) with different input of DNA. *CpGs and nanograms of DNA that present methylation levels with statistically significant differences (p<0.05) between groups. ... 97 4.3 Pyrogram showing a sample with 1 ng input to bisulfite. Peak height for the
majority of peaks corresponding to single nucleotide dispensations are lower than
20 light units (y-axis) which creates a warning recorded by software. ... 98 4.4 Mean percent of methylation for samples containing different ratios of DNA that was extracted from different body fluids. (A) shows the mixture of blood and vaginal epithelia. As the DNA content of blood decreases compared to vaginal epithelia, the percent of methylation also decreases. The average percent methylation for the blood (n=8) and vaginal epithelia (n=11) samples are shown as control. The samples labeled ‘B’ and ‘VE’ are the DNA from blood and vaginal epithelia, respectively, used to make the mixture. (B) shows the mixture of blood and semen. With the decrease in the content of DNA from blood compared to semen, a decrease in the percent of methylation is also observed. The average percent methylation for the
blood (n=8) and semen (n=12) samples are shown as control. The samples labeled ‘B’ and ‘S’ are the DNA from blood and semen, respectively, used to make the mixture. (C) shows the mixture of vaginal epithelia and semen. As the DNA content from vaginal epithelia decreases, so does the methylation percent of the mixture.. The average percent of methylation for the vaginal epithelia (n=11) and semen (n=12) samples are shown as control. The samples labeled ‘VE’ and ‘S’ are the DNA from vaginal epithelia and semen, respectively, used to make the mixture. ... 99 4.5 Pyrograms for the PFN3A locus showing DNA samples from (A) chimpanzee
and (B) human after pyrosequencing. Both samples show good peak height and expected sequence therefore all CpGs analyzed passed the quality test imposed by the software. ... 101 4.6 (A) Pyrograms for the PFN3A locus showing a DNA sample from cattle as an
example of how red warnings are displayed by the software when the sequence in the pyrogram does not correspond to the sequence expected. (B)Pyrogram for the PFN3A locus showing the absence of peaks from a DNA sample extracted from a bacterial pool containing the following species: Escherichia coli, Staphylococcus
aureus, Enterococcus faecali and Pseudomonas aeruginosa. The DNA samples from dog, chicken, mouse and horse show similar pyrograms to (B) . ... 102 5.1 Mean methylation levels of samples in which PCR inhibitors were added before bisulfite modification. There were no significant differences between the control and the tested samples. A) Marker ZC3H12D: saliva samples. B) Marker ZC3H12D: blood samples. C) Marker ZC3H12D: semen samples. D) Marker cg06379435: saliva samples. E) Marker cg06379435: blood samples. F) Marker cg06379435: semen samples. G) Marker BCAS4: saliva samples. H) Marker BCAS4: blood
samples. I) Marker BCAS4: semen samples. ... 120 5.2 Mean methylation levels of samples degraded by heat with different time points. There were no significant differences between the control and the degraded samples. A) Marker ZC3H12D: saliva samples. B) Marker ZC3H12D: blood samples.
C) Marker ZC3H12D: semen samples. D) Marker cg06379435: saliva samples. E) Marker cg06379435: blood samples. F) Marker cg06379435: semen samples. G) Marker BCAS4: saliva samples. H) Marker BCAS4: blood samples. I) Marker
BCAS4: semen samples. ... 122 5.3 Mean methylation levels of different ratios of DNA mixtures. A) Marker
ZC3H12D: semen + blood+ saliva. B) Marker ZC3H12D: semen + blood. C) Marker ZC3H12D: semen + saliva. D) Marker cg06379435: blood + saliva+ semen. E) Marker cg06379435: blood + saliva. F) Marker cg06379435: blood + semen. G) Marker BCAS4: saliva + blood+ semen. H) Marker BCAS4: saliva +
5.4 Comparison between pyrosequencing data generated by two independent laboratories: Laboratory 1 (Florida International University) and Laboratory 2 (University of Southern Mississippi). A) Methylation data of marker BCAS4 (saliva samples n=8). B) Methylation data of marker cg06379435 (blood samples
n=8). C) Methylation data of marker ZC3H12D (semen samples n=8). ... 126 5.5 List of PCR primers used in this study. ... 135 5.6 List of SBE primers used in this study ... 136 5.7 DNA methylation profiling results of part 1 conducted with the final SBE products of the multiplex methylation SNaPshot reaction. DNA methylation was recorded as a percentage value by dividing nucleotide G intensity by nucleotide G plus nucleotide A ... 140 5.8 DNA methylation profiling results of part 2 conducted with bisulfite converted DNA. Part 2 results show the proficiency of each laboratory in SBE reaction. (Un) indicates samples provided with unspecified body fluid origin. ... 141 5.9 DNA methylation profiling results of part 3 conducted with genomic DNA.
Part 3 results show the proficiency of each laboratory in bisulfite conversion.
(Un) indicates samples provided with unspecified body fluid origin ... 142 5.10 DNA methylation profiling results of part 4 with body fluid samples. Part 4
results show the proficiency of each laboratory in the whole procedure of DNA methylation-based body fluid typing raging from DNA extraction to capillary electrophoresis. Methylation percentages in a menstrual blood swab and a mixture swab of semen, blood and saliva with unspecified origin were presented in
consideration of the possibility of sample switch in laboratory 5. (Un) indicates
samples provided with unspecified body fluid origin. ... 144 6.1 Negative of the first derivative calculated from the change in slope resulting from a decrease in fluorescence with temperature (-dF/dT) for high-resolution melt curves, showing 7 semen samples (blue), 10 blood samples (red) and 9 saliva samples (green). A no template control (NTC, no DNA) was also included and is seen at the baseline in pink color. Body fluid samples were donated from individual volunteers. Samples were amplified from 50 ng of genomic DNA added to bisulfite conversion. ... 154 6.2 Chart showing the mean values for melting temperatures (ºC) determined by
HRM for 10 blood samples, 9 saliva samples and 7 semen samples. Analysis of variance was performed showing that the melting temperature is significantly
different for semen when compared to blood and saliva (*signifies p<0.05) ... 155 6.3 Chart showing the melting temperatures (ºC) for 3 individual samples from 3
The x-axis shows the different amounts of input DNA added to bisulfite modification. Each body fluid should have 3 individual bars for individual amplifications. The
absence of a bar indicates that amplification failed ... 156 6.4 Chart showing the melting temperatures (ºC) for 3 individual samples from
3 different volunteers of each body fluid, Blood (red), Saliva (green) and Semen (blue). The x-axis shows the dilution factor from samples that were bisulfite-modified with 1 ng of DNA. For comparison the non-diluted samples (1ng) are displayed. Each body fluid should have 3 individual bars for individual amplifications. The absence of a bar indicates that amplification failed. ... 157 6.5 Graphs showing samples before and after bisulfite modification. bDNA from
semen samples are blue, from blood samples are in orange and from saliva samples are in green. gDNA samples are shown in pink. (A) shows the increase in fluorescence as a result of incorporation of the green fluorescent dye Eva Green® as the cycle number increases. DNA samples that were not bisulfite modified (gDNA) do not amplify and are in pink color at the baseline. The bDNA samples amplify showing an increase in fluorescence. (B) Melt curve analysis shows that the bDNA samples amplified show a melt profile consistent with Figures 6.1 and 6.2. Semen samples are blue, blood samples are in orange and saliva samples are in green. ... 158 6.6 Graphs showing amplification curves for samples without humic acid (control, thin lines), samples where humic acid was added prior to bisulfite conversion (dashed lines) and samples where humic acid was added to the PCR master mix (thick lines). DNA from blood is in red, saliva cells in green and semen in blue. (A) The presence of the inhibitor during amplification (thick lines) causes a decrease in the steepness of the slope of the curve when compared to samples without humic acid (thin lines) or when humic acid was added prior to bisulfite conversion (dashed lines). (B)The presence of humic acid does not affect melt curve since all samples
have a similar TM even when amplified in the presence of humic acid ... 160
7.1 Genotype differences between saliva (n=10), in green color and thick lines, when compared to blood (n=10) in red color, vaginal epithelia (n=10) in orange and semen (n=10) in blue. Controls used are depicted in black . ... 175 7.2 Melt curve obtained in the presence of 2.5% DMSO or Glycerol in ‘My Mix’
which includes BSA (0.2 µg/µL). The dashed lines represent the melt temperature for the DNA controls amplified with the Epitect® HRM kit (Qiagen, CA) used as reference for ‘My Mix’, where green is the unmethylated control and red is the
methylated control. ... 177 7.3 Melt curve for an unmethylated control (red) and a methylated control (blue)
amplified in a multiplex PCR reaction with INPP5D200_TM60, VE_8 and
ABBREVIATIONS AND ACCRONYMS
3’-OH 3’-hydroxyl group
5-caC 5-carboxylcytosine
5-fC 5formylcytosine
5-hmC 5-hydrozymethylcytosines
5-mC 5-methylcytosines
A Adenine
ANOVA Analysis of variance
ATP Adenosine triphosphate
BER Base excision repair
bp Base pairs
BSA Bovine serum albumin
C Cytosine
CpGi CpG islands
DEPC diethyl pyrocarbonate
DMSO Dimethylsulfoxide
DNA Deoxyribonucleic acid
DNMTs DNA methyltransferases
dNTP deoxynucleoside triphosphate
dNTPs Deoxyribonucleotides
G Guanine
HRM High-resolution melt
kb kilobases
KMTs Histone lysine methyltransferases
Mb Megabases
miRNA Micro RNA
mRNA Messenger RNA
ms-SNuPE Methylation-sensitive single nucleotide primer extension
ORF Open reading frame
PCR Polymerase chain reaction
RFLP Restriction fragment length polymorphism
RFU Relative fluorescence units
RNA Ribonucleic acid
SBE Single base extension
ssDNA Single-stranded DNA
STRs Short Tandem repeats
T Thymine
Taq Thermus acquaticus
tDMRs tissue-specific DNA methylation regions
TET Ten-eleven translocation
TGS Transcriptional gene silencing
tRNA Transfer RNA
TSS Transcription start site
UHRF1 (ubiquitin-like, containing PHD and RING finger domains 1
CHAPTER I - INTRODUCTION AND LITERATURE REVIEW A. The Molecular Structure and Biochemistry of DNA
The molecular structure of deoxyribonucleic acid (DNA) was established in 1953 as a result of several years of research. Maurice Wilkins and Rosalind Franklin were able to capture high quality X-ray diffraction photographs of the molecular structure of DNA (1). In 1952, Alexander Todd and colleagues (2) established the existence of 3’-5’
phosphodiester bonds in DNA which laid the ground work for the final structure of the double helix explained by James D. Watson and Francis Crick in 1953 (3). The DNA structure includes a double helix composed of two linear strands, similar in structure, that bind to one another through hydrogen bonds. Each linear strand is composed of building blocks named adenine (A), cytosine (C), guanine (G) and thymine (T) that compose the interior part of the double helix. These nitrogen bases are linked to a sugar-phosphate backbone that forms the linear structure. The two linear strands of DNA form the double helix by complementary hydrogen bonds between the nucleotides or nitrogen bases (Figure 1.1). Each base-pair on the double helix was named Watson-Crick base pairing. The double helix coils around a central axis and the stacking of the bases on its interior has the distance of 3.4 Å. Each base has a rotation of 36 degrees from the adjacent ones and therefore each turn (360 degrees) is composed of 10 bases (4). The two DNA strands within the double helix are also organized in an anti-parallel fashion. The connection between adjacent nucleotides is made between the previous nucleotide and the 5’carbon and the hydroxyl group on the 3’carbon of the deoxyribose to the next nucleotide.
Figure 1.1 – The structure of the DNA double helix showing hydrogen bonds between two antiparallel strands. The nucleotides on the same strand are linked together by phosphodiester bonds through the 3’-OH of one group to the 5’-phosphate of the next. Adapted from (4).
The formation of the double helix depends on different chemical forces that act on the structure’s constituents. The covalent binding of atoms in the nucleotides’ structures is the strongest chemical force present in the DNA structure. For that reason, the building blocks are stable structures and rarely suffer modifications on their structure. Several forces are responsible for the high stability of double-stranded DNA when compared to single-stranded structure. Hydrogen bonds are formed between a hydrogen donor and an acceptor. The hydrogen atom itself is shared between two electronegative atoms such as nitrogen and oxygen, typically in complementary nucleotides of the double-strand
structure. In this fashion, adenine base pairs with thymine in a double hydrogen bond and cytosine base-pairs with guanine with a triple hydrogen bond (5). When the two DNA
strands exist apart from one another, the nucleotides are exposed to water forming hydrogen bonds with the molecules of water. As the correct complementary nucleotide gets closer, the hydrogen bonds that form between the complementary nucleotides
replace those formed with water molecules. Because the energy required to make the new bonds and to disrupt those with water is similar, the total energy of the molecule and its environment is constant and the First Law of Thermodynamics is observed (5). However, if the nucleotides are not complementary, some of the hydrogen bonds cannot form which makes the reaction greatly disfavored. Additionally, the formation of a non-polar moiety within the double-strand contributes to hydrophobic interactions that force water to the outside of the structure. These forces help explain why there is a release of energy in the formation of the double strand, therefore increasing the entropy of the surroundings and favoring the double-helix formation. Van der waals forces between adjacent nucleotide bases in the double helix are also optimal which further contributes to the stability of this structure when compared to single stranded DNA (4). However, some unfavorable electrostatic interactions between the negative phosphate groups of the backbone also exist. These unfavorable interactions occur mainly on adjacent phosphate groups present when the double strand circles around the axis. These forces are reduced because of the presence of positively charged ionic species like sodium and magnesium and the dielectric constant of water that stabilizes the negative charge of phosphates. Even before Watson and Crick proposed this model for the double-helix, there was already the notion that DNA was responsible for storing genetic information able to code for effector proteins that carry specific tasks within a cell (5).
B. The Location of Genomic DNA and The Central Dogma
Deoxyribonucleic acid itself is not the effector biomolecule that allows all cellular processes to exist. Genomic or nuclear DNA is located in the nucleus of a cell and
therefore cannot process cellular mechanisms that operate on the cytoplasm and other organelles of the cell. Instead, DNA contains the information necessary to synthesize proteins, which are the effector molecules within cells (5).
To explain how the information stored in the DNA can be transformed into effector proteins, Francis Crick proposed the central dogma pathway in 1958 (6). According to the central dogma model, genetic information stored in the DNA molecule is transcribed to ribonucleic acid (RNA), which carries it to the cytoplasm. Once in the cytoplasm of the cell, RNA is then translated to proteins. Specific characteristics make this model unique (6, 7). The first characteristic is that the information stored in the DNA code can be duplicated to form two identical copies of the same template of DNA. The duplication of DNA happens before cell division in order for the new cell to obtain one DNA
molecule with the same genetic information as the template. The second characteristic of the central dogma is that the flux of information happens in a single direction from DNA, to RNA and then proteins. Third, the intermediate player – RNA – is transcribed from the template DNA and travels to the cytoplasm transferring the information to be translated into proteins.
The duplication (also known as replication) of DNA depends on the concerted action of enzymes such as helicases, DNA polymerases and DNA ligases. The initial step necessary to DNA replication is the unwinding of the double strand at specific regions called origins of replication by the initiator proteins. Each human chromosome has an
origin of replication for each 30-40 kilobases (kb). The DNA helicase then binds to the single-stranded DNA (ssDNA) to further unwind it and allow the primase to synthesize RNA primers necessary for DNA duplication (8). The primase is a specific RNA polymerase that specifically synthesizes 5-10 RNA nucleotides complementary to the ssDNA at the origin of replication. The primer:template junction acts as a substrate for DNA polymerase and signals it to initiate copying the DNA molecule. The tertiary structure of human DNA polymerase enzymes resembles a hand that grips the DNA molecule. The catalysis occurs in the palm whereas the fingers and thumb provide the stabilization residues necessary to the correct nucleotide to be added to the newly formed strand(9). In the moiety of the DNA polymerase, the free 3’-hydroxyl (3’-OH) group of the primer:template junction attacks the alpha-phosphoryl group available on the next deoxynucleoside triphosphate (dNTP) brought close by the polymerase.
Also associated with the DNA polymerase are sliding clamps that maintain its association with DNA even after the end of new strand by the polymerase. The sliding clamp allows the action of other enzymes necessary to the correct duplication of DNA and provides easier association of different DNA polymerases in case corrections are needed in the new copy of DNA. The process continues through DNA unwinding by helicases ahead of the association between the DNA polymerase that copies the leading strand with a direct addition of nucleotides to the 3’ –end of the new strand and the template DNA, which forms the replication fork (9). Since the replication can only occur by addition of nucleotides on a free 3’-OH and each ssDNA runs anti-parallel to one another on the double helix, only one template strand (called the leading strand) can be directly copied as the replication fork forms. The complementary strand that runs in the opposite
direction of the leading strand cannot be immediately copied and is therefore called the lagging strand. Only when there is enough lagging strand template present on the replication fork, can a second sliding clamp associate to the lagging strand, allowing the primase to synthesize a new primer:template junction. The replication of the lagging strand is therefore achieved by the synthesis of small DNA fragments, called Okazaki fragments, instead of a single long strand (8). Each fragment is formed as a result of the progression of the replication fork and recruitment of its own set of replication
machinery. At the same time that the DNA polymerase copies the lagging strand on the second Okazaki fragment, it also uses its 5’-3’ exonuclease activity to remove the portion of RNA primer from the first fragment. The existing nick between the two Okazaki fragments is sealed by another enzyme present in the replication machinery called DNA ligase. The process of copying one entire DNA molecule allows the duplication of information prior to cell division and thus the propagation of the genetic code to the subsequent generations.
The second process described by the central dogma is called transcription. Transcription allows the code stored in the DNA to be transcribed to RNA. Because of the similarity between the two molecules, the process of transcription presents some common steps to replication. The main differences reside in the specific enzymes that catalyze the reaction and in the product formed.
RNA polymerases are enzymes capable of reading deoxyribonucleotides from DNA and convert them to ribonucleotides in the RNA. The pairing of complementary nucleotides is similar to DNA, except to the adenine that is base-paired with uridine, since RNA does not contain thymines. Another difference is that the RNA molecule exists as a single
strand, the only time it exists as double-paired is during transcription, when it is paired with DNA.
The initiation of transcription happens when RNA polymerase binds to the DNA at promoter regions. The DNA nucleotide that is first transcribed is called the
transcription start site (TSS) and is referred to as the ‘+1’ position. Nucleotides located before the TSS are called upstream and their relative distance to the TSS is established by negative numbers, for example, -10 corresponds to the nucleotide located 10 base-pairs upstream of the TSS. Similarly, nucleotides located after the TSS are called downstream and carry positive numbers (10). Before the initiation of transcription, proteins capable of recruiting the transcription machinery, which includes the RNA polymerase, recognize specific DNA sequences. Those DNA sequences, also called elements, are present near the TSS in the core promoter regions or in other regulatory sequences further away upstream or downstream of the TSS (10). Each core promoter region can be 40-60 nucleotides long and contain different combinations of the possible elements. Transcription occurs from the 5’ to the 3’end similarly to replication and it does not require primers. As elongation occurs, the polymerase encounters specific sequences that signal the end of the gene thus promoting termination. Transcription of those specific sequences triggers the transfer of polyadenylation enzymes to the newly formed RNA. The RNA copied from a single strand DNA needs to undergo post-transcription modifications such as addition of a poly-A tail, addition of a 5’-cap and splicing (11). Polyadenylation enzymes catalyze the addition of about 200 adenines (poly-A tail) to the 3’-end of the newly formed RNA (pre-mRNA) and also allow the complete detachment of RNA polymerase and the messenger RNA (mRNA) from the DNA molecule. The
5’cap consists in the addition of a modified guanine to the 5’-end of the newly formed RNA. The 5’ cap has functions in the transport of mRNA to cytoplasm as well as
important functions in translation to proteins and protection against exonucleases. Before exiting to the cytoplasm, the pre-mRNA must also be spliced to remove any regions of RNA transcribed from DNA but that do not code for proteins (11).
Within each DNA region that codes for proteins, downstream of the promoter, the DNA sequence has coding regions or exons interspaced by non-coding regions called introns. The pre-mRNA contains a transcription of both exons and introns, which need to be removed. The spliceosome is composed of 150 proteins and 5 RNAs that catalyze transesterification reactions responsible for RNA splicing - the removal of introns and combination of exons to form a mature mRNA. The importance of this process is that it allows the generation of several spliced mRNAs that code for different polypeptides from one pre-mRNA molecule transcribed from the same DNA region (11). The process from splicing the RNA and formation of a mature mRNA with different exons is called alternative splicing and it accounts for the diversity of proteins that each gene can code. In humans, 75% of genes undergo alternative splicing, explaining the enormous diversity observed for the number of genes carried by each individual considering the size of the genome. Since exons from different genes can combine to form new proteins, alternative splicing is thought to have greatly contributed to evolution and to the immense increase in cell functions from simpler organisms to the complex biology in humans (12).
The last process described in the central dogma is translation. The translation of mRNA happens in the cell cytoplasm, therefore the mRNA must exit the nucleus through a pore protein called nuclear pore complex. As it reaches the cytoplasm, translation can
start at the 5’ end of a string of codons called open reading frame (ORF, (13)). In
eukaryotes, the first codon is called start codon and is the sequence of the ribonucleotides AUG-3’. Translation ends with one of three possible stop codons: UGA-3’, 5’-UAA-3’ or 5’- UAG-3’. The translation process occurs by the ribosome being recruited and assembled at each mRNA. The recruitment is initiated by the presence of the 5’cap on the mRNA which promotes two subunits of the ribosome (60S and 40S) to assemble at the 5-end of the mRNA. In the newly formed protein, the larger subunit is responsible to form the peptide bonds between amino acids whereas the smaller subunit decodes the 3 nucleotide codons to recruit the corresponding amino acid. In fact, even before assembly, the small subunit is already associated with a transfer RNA (tRNA) that codes for
methionine and recognizes the start codon (13). After assembly, the ribosome scans the mRNA until it finds that start codon allowing the first methionine to initiate translation. As translation progresses, the ribosome translocates to the next codon allowing several ribosomes to simultaneously translate a single mRNA molecule. Each ribosome is capable of associating simultaneously with 3 tRNAs that recognize 3 successive codons. Thus, the ribosome is a specialized organelle that allows the concerted action of tRNAs, which specifically recognize codons providing the respective amino acid for protein synthesis. Upon encountering the stop codon, the ribosome disassembles, translation ends and the polypeptide formed dissociates from both subunits (13).
The genetic code followed by each tRNA corresponds a codon and an amino acid. Each tRNA possesses an anti-codon sequence which is complementary to the mRNA, and it also carries the respective amino acid according to the genetic code. Since each codon has 3 ribonuclotides, there are 64 possible codons. From those 64 codons, 3 are used as a
stop signal and the remaining 61 codons are translated to 20 amino acids(14). As a result, each amino acid is coded by more than one codon, which classifies the genetic code degenerate. The degeneracy of the genetic code promotes correct translation even in the presence of random single nucleotide errors that could accumulate during either
replication or transcription (15).
C. The Structure of the Eukaryotic Cell
The evolution of species throughout time depended on the selective advantage for unicellular organisms to combine into multicellular colonies. With evolutionary time, certain individuals in each colony were able to differentiate and have specific functions. The colony was then able to form an independent tissue with complex signaling pathways between all individual cells. Therefore, the single, common structure to all living
organisms is the cell. Cells can be prokaryotic or eukaryotic. The cells that compose the tissues in the human body are eukaryotic and share common characteristics with other organisms that are composed of the same type of cells (16).
In eukaryotic cells, the cellular membrane separates the cell from the outside
environment, keeping a balanced level of salts and an adequate pH to cell functions. The membrane is composed of a bilayer of phospholipids associated with proteins. Some proteins can function as pores or channels that allow specific passage of extracellular components, such as nutrients, neurotransmitters, hormones and others. Inside the cell, a fluidic structure called the cytoplasm maintains several organelles that carry out
pathways allowing for cell survival and response to external stimulus. Another structure present inside the cells is the nucleus. A nuclear membrane separates the genetic
information stored in the DNA from the cytoplasm where the organelles are located. The compartmentalization of organelles is a characteristic of eukaryotic cells which provides them with a higher complexity when compared to prokaryotic cells. Since each specific compartment can have its own environment, the compartmentalization allows the survival of organelle-specific enzymes which leads to more specialized organelles. At any certain point in time, numerous pathways take place in an eukaryotic cell due to the presence of proteins, ions, water, genetic material (DNA and RNA), organelles and several biochemical compounds that are either the substrate or the product for such pathways (16).
Genomic DNA is found in the nucleus of the cell condensed into chromosomes and mitochondrial DNA is found in the mitochondria in the form of a circular molecule. The genomic human DNA is extremely lengthy and therefore needs to be compacted into chromosomes in order to fit inside the nucleus of the cell. Human chromosomes are linear structures, contain telomeres which are located at the ends of the chromosome arms; and a central region – centromere – connecting the arms. In the process of cell division, the centromeres form a kinetochore which interacts with protein filaments that help pull the two copies of each chromosome to opposite sides of the dividing cell (17). The mitochondrial DNA is located in the mitochondria which is the main organelle responsible for the synthesis of adenosine triphosphate (ATP) - the main energy currency in the cell. The mitochondria are capable of oxidizing proteins, lipids and sugars to convert them to carbon dioxide and water with ATP production. The mitochondria also has its own RNA, ribosomes and a small number of proteins that allow for self-assembly. Similar characteristics between contemporary mitochondria and bacteria, illustrates how
evolution may have occurred. A bacterium capable of oxidizing nutrients fused with an archaic eukaryotic cell providing it with an enhanced system of acquiring ATP from more complex nutrients. The fusion of both cells proved to be advantageous and therefore such symbiosis relationship was selected (17).
D. The Cell Cycle
In order to form an organism, the initial cell is composed by the fusion of male and female gametes and must divide several times to form a population of cells. Once that occurs, some cells gain specialized functions and then further divide to maintain a constant replacement of cells that are either damaged or that have died resulting from loss of functions (apoptosis). Both pathways – expansion of a population of cells to form and organism, or cell division to maintain the organism – have similar characteristics. In both cases the cell cycle is composed of a series of events that allow for the duplication of all the constituents of a cell followed by the division of such cell giving origin to two identical daughter cells (18). When a new organism is being formed, the initial cell is undifferentiated and is commonly called a stem cell. Once it receives specific stimulus, the stem cell can divide and one of the daughter cells undergoes a cycle of rapid
duplication and division to form a subpopulation of cells. Upon the cessation of cell divisions, the subpopulation of cells differentiates to acquire the characteristics of the tissue they form. In humans, the process from stem cell to differentiated cell occurs for example in the zygote cell formed upon egg fertilization and also in adult tissues that are constantly regenerated, such as skin. In both cases, the cell cycle is divided into
interphase in which the cell grows and duplicates all of its contents, and a second phase called M phase, where the cell divides into two identical daughter cells (18).
When differentiated cells divide, they do so in order to replace cells that die. In such case, the number of chromosomes must be maintained and the division is called mitosis. During the interphase, more specifically in the S phase, the chromosomes duplicate by forming an identical copy of each other through DNA duplication. Before and after the S phase, two gap phases G1 and G2 function as check points to both prepare for the next phase and to confirm that the previous actions were completed successfully. The M phase follows which is composed of a rearrangement of the chromosomes in the center of the cell to prepare it for division (18). The kinetochores and associated
microtubules pull the chromosomes in separate directions and so when the cytoplasm of the cell divides, each new daughter cell has a diploid number of chromosomes, similar to the cell that gave them origin.
Somatic cells have ‘2n’ or diploid number of copies of chromosomes whereas gametes have haploid or ‘n’ number of chromosomes. In humans the gametes are the sperm cell and the egg and when they fuse, they form the zygote with a diploid number of chromosomes. Both egg and sperm are formed from precursors of reproductive cells which are diploid. When these cells divide, they do so by a process called meiosis. In meiosis, after the initial duplication of chromosomes and cell components, there are two consecutive rounds of cell divisions without further duplication of chromosomes. The two cell divisions that occur after chromosome duplication leave each gamete with haploid number of chromosomes, allowing them to combine to another gamete and form a diploid cell (18).
E. DNA organization in Nucleosomes and Chromosomes
Human chromosomes are linear structures composed of DNA wrapped around proteins. The number of chromosomes is characteristic of each type of eukaryotic cell. In humans, all cells except the reproductive cells, are diploid and contain two copies of each of the 22 chromosomes plus a single copy of the sex chromosomes, X and Y for males and two copies of X for females.
The chromosomes are visible under the microscope and their structure varies according to each phase of the cell cycle. For example, chromosomes in the M phase are condensed and present a typical ‘X’ shape with visible arms and the centromere (18, 19). During interphase, the structure is less compact and it is called chromatin. The more compact version of chromatin is called the 30-nm fiber whereas the less compact is called the 10-nm fiber. Under the microscope, the 10-10-nm fiber has the appearance of beads on a string. The chromatin fiber is composed of nucleosomes which are constituted by a core of histone proteins and a DNA molecule that is wrapped around them. The shape of beads on a string visible under the microscope is therefore the nucleosomes (beads) with a string of approximately 20-60 base pairs (bp) of DNA (linker DNA) uniting them (19). The histones are proteins that are specific to nucleosomes. Each nucleosome contains two copies of H2A, H2B, H3 and H4 histones. Immediately after DNA replication, the
nucleosomes assemble thanks to the specific action of histone chaperones which are negatively charged. The replicating DNA functions as a signal for the chaperones, which are then directed to form complexes with the tetramers or dimers of the H2A, H2B, H3 and H4.To initiate the formation of the nucleosome, a tetramer of two copies of H3 and H4 associates with DNA, promoting the recruitment of two H2A.H2B dimers. Each
newly formed nucleosome contains histones from the parental cell that were released upon relaxation of the chromatin fiber and new histones formed during the interphase. Since some of the existing histones are recycled to the new cell, the chaperone needs only to direct the assembly of the new ones.Additionally, the histones regenerated from the mother cell carry with them important modifications that can be copied to the daughter cells (19).
The DNA is wound 1.65 times around the core of histones for a total of 147 bp per nucleosome. Further condensation of the structure is achieved when a fifth histone – H1 – binds to the linker DNA, further condensing the chromatin fiber and originating the 30-nm fiber. The histones have amino-terminal tails that protrude from the nucleosome core and that can have modifications such as presence of methyl or acetyl groups that help recruit proteins and also stabilize the DNA. Depending on which modification is present in the histone tails at each time, the proteins recruited can help further condensing or relaxing the chromatin structure. A more relaxed structure is more suitable for DNA replication or transcription (19).
Overall the human genome is composed of 3,200 Mb (Mega-bases) of DNA from which only 48 Mb are genes that code for proteins. Introns, unstranslated regions (UTRs) and pseudogenes compose about 1,152 Mb and another 2,000 Mb are intergenic DNA. Regulatory regions such as those that code for miRNA allow the regulation of gene expression (19). About 3% (or 90 Mb) of DNA is composed of microsatellites, which are short-tandem repeated sequences of less than 13 nucleotides. The gene density defined as the number of genes per Mb of DNA, and not the total number of genes or length of DNA is what determines the level of complexity of a species. More complex species have
their gene-coding regions interspaced with non-coding DNA such as repeated sequences, intergenic sequences, introns, etc, thus having a lower gene density (19).
F. Epigenetics
Epigenetics is a term that was first defined by Doctor C.H. Waddington in 1942 to explain the interactions between “genes and their products, which bring the phenotype into being.” (20). Nowadays the term ‘epigenetics’ is used to coin all the genome modifications that cause differential gene expression, independent from changes in the DNA sequence (21). Some of the mechanisms included in epigenetics cause regulation of gene expression through changes in the level of chromatin condensation, changes in the mRNA resulting from transcription or changes in the DNA itself - DNA methylation. Since the DNA contains the genetic information that codes for chromatin condensation and mRNA synthesis, DNA methylation can be linked to modifications in the chromatin and RNA therefore resulting in cell-specific gene expression (22).
The epigenetic mechanisms that allow changes in the degree of relaxation of chromatin are commonly known as chromatin remodeling and can directly influence DNA transcription. The nucleosomes are composed of 147 bp of DNA wrapped around histones. If the wrapping is tight, the DNA is less likely to be available for transcription (19). The tightening of the chromatin fiber can be promoted by the presence of different modifications on the histone tails, which are mostly composed of residues of arginine and lysine (5). The specific modifications on the histone tails occur post-translationally and can be methylation, acetylation, phosphorylation, propionylation, butyrylation,
tails is known as ‘histone marks’ and a combination of several histone marks leading to a gene regulation event is known as ‘histone code’ (23).
One of the most studied examples of histone modification is the methylation of lysine (K) residues in tails of histone H3 that can either cause gene repression when tri-methylation occurs on lysine 9 of histone 3 (H3K9me3) or gene activation for H3K4me3 (24). Another type of histone modifications intimately related to gene expression consists on the presence of histone variants. Some histones contain differences in few amino acid residues when compared to the canonical histones. For example, in mammals there is a known variant of the histone H2 called H2A.X. When H2A.X is phosphorylated, it marks a double strand DNA break. Another variant known as H2A.Z, which is widely present at transcription start sites, shows a negative correlation with the existence of DNA
methylation. Even though information regarding the mechanism of action of these variants is limited, the existence of dedicated mechanisms responsible for the removal and addition of these histone variants into the nucleosome further reinforces the importance of these histones in gene expression (22).
Gene expression can also be regulated at posttranscriptional levels through RNA. Two main mechanisms are known to date: one is related to the RNA secondary structure and the other related to the binding of small regulatory RNAs to the mRNA.
Regulation through the RNA secondary structure occurs when a specific factor binds to certain mRNA transcripts preventing them from unfolding thus preventing translation. For example, in eukaryotes several proteins such as ferritin mediate the harmful accumulation of iron. Ferritin is an iron-storage protein mainly found in the liver and kidneys. The ferritin mRNA can only be translated when the 5’-end stem-loop is free
from another protein called IRP. Since iron binds to IRP strongly, in high concentrations of iron, the IRP preferentially binds to iron releasing the ferritin mRNA and promoting translation for higher protein availability (5).
Another type of gene expression at the RNA level can occur when specific mRNA transcripts are deleted. The deletion of mRNA after it has been transcribed occurs when certain small RNA – called micro RNAs (miRNA) – are transcribed from specific genes. After being synthesized the miRNAs bind specific proteins from the Argonaute family, which have the capacity to degrade mRNA transcripts complementary to the miRNA sequence. Since each miRNA sequence can be complementary to several mRNA transcripts, several types of mRNAs can be degraded in this manner (5). Recent discoveries show that this form of gene silencing mediated by miRNA can establish a repressed chromatin state through back-signaling to DNA. Such chromatin state
represents a more stable gene silencing mechanisms since it can be propagated through several cell divisions (22). Additionally, small nuclear RNAs can also operate through transcriptional gene silencing (TGS, see Figure 1.2) pathways. It has been proposed that in order to defend the organism from harmful DNA elements introduced by viruses, small RNAs can interact with effectors of histone lysine methylation pathway to silence the extraneous DNA (22).
The third type of epigenetic modification, the DNA methylation, has been widely studied. In humans methylation occurs primarily in the 5’ carbon of cytosines followed by guanines (CpGs) and because of the large effect of that methyl group in gene
expression, methylated cytosines have been referred by some as the 5th nucleotide (25). In fact, DNA methylation plays important roles in several genetic processes such as
repression of transposons and repetitive elements, genomic imprinting and
X-chromosome inactivation, where one of the X X-chromosomes is silenced in every somatic cell of female mammals (21, 26).
Figure 1.2 – Schematic representation showing all the genomic and epigenomic factors and mechanisms involved in gene regulation. The center of the figure represents 4 nucleosomes and the main mechanisms for epigenetic regulation such as DNA methylation (red circle with Me), histone modifications (Mod), histone variants (yellow nucleosome) and non-coding RNA (wavy blue lines). The brown boxes display genomic functions that affect epigenome modifications and help in its regulation. The main factors needed for genomic functions are shown near the boxes. Adapted from (22)
The close physical relationship between DNA and histones in the nucleosomes precludes possible correlations between the different states of chromatin and DNA methylation. Ongoing research aims to further draw a mechanism of how such
interactions affect gene expression. In 2010 direct evidence was found that connect the methylation status of CpGs to recruitment of proteins able to mediate modifications in the
histone tails. One example is the specific recognition and binding of protein CXXC-type zinc finger protein 1 to unmethylated CpGs which promotes the recruitment of enzymes called histone lysine methyltransferases (KMTs). Methylation of histone tails on their lysine residue by KMTs seems therefore to be influenced by unmethylated cytosines on associated DNA regions (27).
G. DNA Methylation
The genetic diversity observed in humans is not only a result of DNA
polymorphisms in the DNA sequence that accumulate over generations, but also due to a more transient modification – DNA methylation – that is altered during the life of one individual and accounts for phenotypic changes (24). In the 1980s the link between DNA methylation and gene expression was established. After blocking DNA methylation in vitro using the drug 5-azacytidine, researchers were able to establish the link between irregular DNA methylation and the onset of cancer. The connection between anomalous DNA methylation and such a devastating disease such as cancer greatly increased research interests towards studying DNA methylation and the enzymes responsible for maintaining a stable methylome (22).
Typically, the cytosines that can undergo methylation are followed by a guanine and therefore they are commonly referred as CpGs. The ‘p’ between the C and G
highlights the phosphate link between the two nucleotides on the same strand of DNA as opposed to the complementary cytosine-guanine hydrogen bond in the Watson-Crick base-pairing. Cytosines in other dinucleotides such as CpA, CpT or CpC can also undergo methylation, however those forms are less common.
The DNA methyltransferases (DNMTs) promote the catalysis of cytosine methylation (28). Methylation in somatic cells of mammals is most predominantly seen in CpGs as a result of an increased affinity (40-500 fold) of DNMTs to that dinucleotide, when
compared to the dinucleotides CpA, CpT or CpC (29). Non-CpG methylation is therefore a rare event in somatic cells. A different scenario is present in pluripotent cells such as stem cells where non-CpG methylation accounts for about 25% of all methylation seen in those cells. Interestingly, the levels of non-CpG methylation for in vitro-induced
pluripotent cells are similar to those of embryonic stem cells, indicating that non-CpG methylation levels are re-established when cells are in their undifferentiated state (28, 29). The exact molecular mechanisms that allow the non-CpG methylation to occur only in pluripotent cells can be of great interest to understand how DNA methylation is involved in establishing cell type identity and to help future determination of genomic regions that are involved in cell differentiation.
The successful establishment of an embryo depends on how gene expression and silencing is modulated between the two progenitor’s DNA. All stages from oocyte development, maturation and after fertilization are marked with several epigenetic modifications. Whole genome demethylation occurs in two specific events in the embryo development – during germ cell migration and immediately after fertilization.
Demethylation of DNA in these stages is crucial to develop the new embryo’s epigenome by first erasing the progenitor’s epigenome and thus establishing state of pluripotency necessary for cell development (30). After embryonic implantation, a de novo
methylation is generally observed in the whole genome occurs and a new methylome is established (31). In contrast, de novo methylation is not so prominent in specific tissues
during differentiation, establishing a link between low level of new methylation in the genome and cell differentiation. At the tissue level, de novo methylation is therefore rare in normal development and cell differentiation but is widely seen in the development of cell lines in vitro and in cancer (32). Research using pluripotent stem cells (ESC) have observed that unlike somatic cells, ESC have the ability to de novo methylate exogenous DNA introduced in the cells. At this stage of organism development, unique motifs in the DNA sequence determine which regions are methylated. It has been observed that at the time of implantation, some CpGs such as those of housekeeping genes, are protected from de novo methylation. Most of those unmethylated CpGs are located near places where the RNA polymerase binds (transcription start sites) marked with H3K4me3, suggesting a role for RNA polymerase to bind the DNA and protect it from de novo methylation (31).
Regarding the distribution of DNA methylation in adult human genomes (somatic cells), it has been established that there is an equal distribution on gene bodies,
transposons and intergenic DNA (28). From all the CpGs in the human genome, those that are unmethylated regardless of gene expression constitute only 1-2% of all CpGs and they are located mostly in CpG islands (CpGi). CpGi are areas with higher-than-normal density of CpGs and they are mostly located near or at gene promoters (33). The physical proximity between CpGi and promoter regions agrees perfectly with the notion that changes in DNA methylation can lead to changes in gene expression (28, 34). Moreover, it has been proposed that when CpGi regions become methylated during development, the gene associated is silenced permanently (32). Furthermore, Quante and Bird (2016) (35) recently suggested a connection between DNA sequence and DNA methylation.