Open Research Online
The Open University’s repository of research publications
and other research outputs
A fuzzy rule-based colour image segmentation
algorithm
Conference or Workshop Item
How to cite:
Dooley, L. S.; Karmakar, G. C. and Murshed, M. (2003).
A fuzzy rule-based colour image segmentation
algorithm. In: IEEE International Conference on Image Processing (ICIP ’03)„ 14-17 Sep 2003, Barcelona.
For guidance on citations see FAQs.
c
[not recorded]
Version: [not recorded]
Link(s) to article on publisher’s website:
http://dx.doi.org/doi:10.1109/ICIP.2003.1247128
http://ieeexplore.ieee.org/search/wrapper.jsp?arnumber=1247128
Copyright and Moral Rights for the articles on this site are retained by the individual authors and/or other copyright
owners. For more information on Open Research Online’s data policy on reuse of materials please consult the policies
page.
A
FUZZY
RULE-BASED COLOUR IMAGE SEGMENTATION ALGORITHM
Laurence
S
Dooley. Gmir
C
Karmakar,
and Manziir Mirrshed
Eniail: {Lairrence. Dooley, Gozrr.Karmaknr,
[email protected]
Gippsland School of Computing and Information Technology
Monash University, Churchill, Victoria, Australia
-
3842
ABSTRACT
Most / u q ride-based image segmentation teclmiqtres to dote have been primarilv developed for p a y level images. In this paper, a new algoriritm called /uzq rule-hosed colour image segmentation (FRCIS) is proposed bv extending the genericfuzzy rule-based image segnientation (GFRIS) algoritltm [2] and
inlegraring a novel algorithm /or averaging hue angles. Qualitative and qriaiitilative analysis o/ the perJormance o/
FRCIS is erantiiied and contrasted wirli the popular j t z q c- nteans (FCM) and possibilistic c-mrans (PCM) algorithms /or
both the Hiie-Satt,~ation-Vnlue (HSlq and RGB colour models. Overall. FRCIS provides cortsidernhle improvcmeut for mazy
dflerettt inrnge @pes
1. INTRODUCTION
One of the most intractable tasks in segmentation is to define the general properties of objects for perceptual grouping due to the potentially inordinate number of objects and the myriad of variations among them. Such a demand requires human expert and/or domain specific knowledge to be incorporated to achieve superior results. Fuzzy rule-based image segmentation systems can incorporate this expert knowledge, but they are vety much application domain and image dependent. The structures of all of
the membership functions are manually defined and their parameters are either manually or automatically derived [I].
Karmakar and Dooley [2] introduced a novel gemriefrtzq rule based image segn,enlrtlion (GFRIS) algorithm to address many ofthe aforementioned problems for gray level images.
The human eye is able to discem a large number of shades and intensities of colour but only around two-damn shades of
gray scale. By exploiting this additional information, objects that are unable to be segincnted using gray level information, may potentially be able to be segmented using colour information [3]. Some existing fuzzy colour image segmentation techniques are described in [MI. .This paper introduces a new colour image segmentation algorithm, called a Jitzzy rule-based colotrr image
segmoitotion (FRCIS) algorithm by extending the GFRIS algorithm 121, from gray level to colour and developing B new
algorithm for averaging hue angles. The proposed PRCIS algotithm is both perceptually and numerically evaluated [9] and compared uith the fuzzy c-means (FCM) [IO] and possibilistic c-
means (PCM) [ I I ] using the HSV and RGB colour models. This paper is organized as follows. Section 2 provides a brief overview of the techniques used to define the membership functions. The definition of the fuzzy rule and the automatic determining of the weighting factors and the threshold used are presented in Sections 3 and 4 respectively. The new algorithm for calculating the average of hue angles is described in
Section 5, xphile an evaluation of the experimental results are discussed in Section 6. Section 7 provides some conclusions.
2.
DEFINING MEMBERSHIP FUNCTIONSThe FRCIS algorithm uses three membership functions namely, the membership function for region pixel distributions, the closeness to their centres, and the spatial relations among the pixels in a particular region. These have already been fully described in [2] and are the bedrock of the GFRIS algorithm. However, a11 these membership functions have been defined for only gray level pixel intensity. In this section, these membership function definitions are extended for each colour component of each region.
2.1. Membership function
for
region pixel distributionsThis membership function has already been fully described in
[2]. The membership function for the pixel distribution ofregion
R,
, p,,(P,,)
of a pixel with a value of P,, at location (s.t)for the i" colour component can he defined as:-
(1)
uhere
/
is the polynomial for the il" colour component ofregion R , and i E {I,...,4}
where4
is the number of colour components for a particular colour model, i.e.4
= 3 for HSV2.2
Membership function to measure the closenessof
av
eaj(e,,
1
=1;,
@.,
)
( R I
region
The definition of this particular membership function differs slightly from the original definition in 121. This is because it uses a.normalised difference with respect to the maximum value ofthe candidate pixelP,,, and the respective centre
C i ( R l )
o f a regionR I , instead of fixed value (2b
-
1 ) where h-bit gray levels or colour components are presumed. The membership function for the closeness to a region R, ~ pczR,(P,,) of a candidate pixelPs,, for the i" colour component is defined as:
-
PC$, ( P J = 1 - lci(R,)-
e,$
m a x i c k , le,,
I
(2)where C, (R,
)
is the centre of the i" colour component of regionR I . This membership function considers mare accurately the human visual perception than that of the GFRIS algorithrn.
2.3. Membership functions fur spatial relation
The membership function for spatial relation between the pixels of the i I h colour component of a region R,
,
pLNjR,(e,,,,)
for theneighbourhood radius r is defined as:
-
P N , I N P . I ) = C.~,.C~,)/;:f(~~,XG*,) 1=1 j 4 (3)
where N , and G,, are respectively the number of neighbours and the sum of the inverse distances of the i" colour component
of a region R, from the candidate pixel
.
W
is the number of segmented regions.3. DEFINING
THE
FUZZY RULEIn contrast to the fuzzy rule [2] for gray level intensity, in this section a fuzzy rule is heuristically defined for all three colour components. The overall membership value pARJ (P,,,,) of a pixel P,, for a region R, represents the overall degree of belonging to that region for all colour components, 'This is defined by the weighted avera e of all membership functions for eachconvonellt,i.e.
~~,~,k.j,
~ ~ , ~ , ( e , , ) . a n d pLNjR,(S.,.r).~ ~ ~ ~ ( p , , , r ) = ' = I
i:
WLd'D,', (PJ+g
wd+,nj(e,<
)+ Ii:
=, W,#PMj8, (p'.t>4
-=,a=, i E w .(4)
where wI, , w>
,
and wb are the weightings of the membership values of i" colour component for pixel distribution, closeness to the cluster centres, and neighbourhood relations respectively.Definition 1-Rule: IF pAR,
(e.,,.)=
f2n$,"irA8,(P..,,r)}
THEN pixel Ps,, belongs to region R,It is unportant to note that this rule is generic enough to ensure the FRCIS algorithm is both application and image independent.
4.
DETERMINYINGTHE
WEIGHTING FACTORSAND THE THRESHOLD
The data mining algoritlun for the weighting factors and the
lhreshold used by GFlUS [2], is extended to incorporate colour components and determine the weighting factors w,, , wu
,
and w b , and threshold
T
.
The spatial relationship weighting factors w,, and wli for the hue and saturation colourcomponents of
the HSV colour model were empirically chosen as 0.2. The reason for the low value of both parameters is that hue denotes the dominant colour and already represents spatial relations by suppressing the minor variations of a colour, while saturation represents the relative colour punty, that is the whiteness of hue [ 121.5. ARITHMETIC OPERATORS FOR HUE IN THE HSV COLOUR MODEL
Thc hue in the HSV colour model represents the dominant navelength of the colour stimulus. The HSV colour model is
represented by a cone, where tlie hue is the angle of each colour within the cone starting from 0 point on the x-axis 1131. Hue angles are used in calculating the membership functions defmed in Sections2.2 and 2.3 and automatically deriving the key
weighting factors and thresholds described in Section 4 for the hue component of the IlSV colour model, Since hue is expressed in angles, the arithmetic operations for Cartesian coordinates are not suitable for hue this leads to some difficulties when applying certain arithmetic operations on hue angles e.g. avemging. The definition of the difference between two hue
angles h, and h, where both k, and h, are bounded in the range the [0,2n] and the formula for calculating the average of
II hue angles are given as follows: -
Definition 2-Diflet~nce Between Twu Angles: The difference between hvo hue angles h, and h, , dif(hL,h1) is dcfmed as:
-
dfl(/t,,h,)=min(h, - h 2 1 , 2 n - ~ t , -h21) ( 5 )
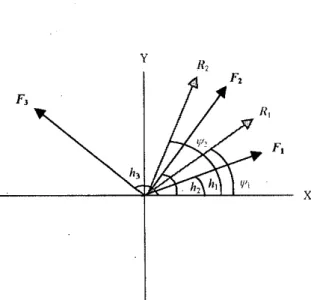
When a candidate pixel joins its nearest region, the centre of that paliicular region is recomputed. The rationale behind recomputing the centre of a region, which considers the previous values of the cen&e and its candidate pixels, is best understood using an analogy from basic force analysis.
Let the initial hue value of the centre of a particular region be It, shown in Fig. 1. If the saturation is assumed as 1, this can
be considered a unit force F, with direction h,
.
If a candidate pixel h, joins this region, this can he regarded as a unit forceF, with direction h2 . The resultant force of Fl and F x , namely
4
and resultant hue anglev,
of A, and /t% s h o w in Fig. 1 arecomputed using the force analysis technique, which will be formalised in Algorithm 1 . Note, that the magnitude of R, may not be unity. If another candidate pixel h, with unit force F,
joins l l u s region, the resultant force of R, and F, , namely
4
and resultant hue anglev2
ofv,
and h, can also be calculated in exactly the same way. Therefore, yr2 is the avemge angle ofi t , , ha
,
and h,.
A similar process is applied to recalculate thecentre of this region for all candidate pixels that join this region. This process can he formalised as follows
-
1 . The initial value of the centre of a region and the rust
candidate pixel are considered two angles of unit force, since the respective saturation values are always one. The resultant angle of the hvo forces (the initial value of the centre and the candidate pixel) is regarded as the current value of the centre.
When
anothercandidate
pixel
joins this
region,the
resultant force (angle and magnitude) for the current centre and the force for the candidate pixel
arr
used to recalculate the centre of this region. This process is repeated for all candidate pixels that join this particular region2.
3.
The actual magnitude ofthe resultant angle depends on the sign of both the X and Y components of the resultant force hecause of the
x
radians penodicity of the tangent function. This means that the resultant angle will be in tiust, second, third, and fourth quadrant dqnmding on the respective signs of the X and Y components.I
Fig. 1 : Resultant (average) hue angle
vi
of h, , h, , and A, The algorithm for calculating the average angle of two hue angles based on force analysis is formalised as follows: -Algorithm 1 Calculation of the average of two hue angles Precondition: Two hue angles h, and h, with magnitudes
F, and F, ofthe forces F, and F, respectively.
Postcondition: Resultant direction 41 (average angle)' and magnitude R of the force R
1. Calculate the X arid Y components of the resultant force R
R, = F;cos(h,)+F2cos(h,)
R, = F; sin(/+)+F2;.in(/t,)
Compute the magnitude of the resultant force R . If it is zero,
mark
the resultant angley
as undefuied hy setting its value as -1 and go to step 4.2.
R = J W
IF (R = 0) T E N
v=-l
GOT0 step 4
3 . Detemiine the resultant direction (average angle).
IF (R. L
n)
THENw.=2rr-v
IF (R, >n) THEN
II:
(Ry < O ) THEN ELSEV = n - y r
y = n + y
ELSE
4. STOP
All those pixel values, for which the average angle becomes undefined are blocked from the process for modification ofeach region centre in Section 2.2.
6. EXPERIMENTAL RESULTS
The new FRCIS, FCM, and PCM algorithms were implemented using MATLAEI 5.6 (The Mathworks, Inc.). Four different image t y p containing two and three real objects as regions were used in the experiments.
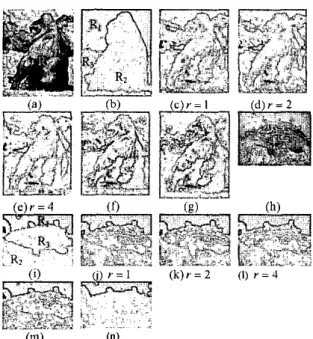
The results produced by the FRCIS, FCM, and PCM algorithms for the cloud (Fig. 2(a)) and crocodile (Fig. 2(c)) images
based
on the HSV colour model are presented in Fig. 2.FRCIS provided better results than FCM and PCM when the segmented results of the FRCIS are visually compared with the respective results of FCM and PCM.
(k) r = 2
(m) (n)
Fig. 2: (a) Cloud image, (b) Ref. image for cloud, (c) Crocodile image, (d) Ref. image for crocodile, The segmented results of the cloud and crocodile unages into two regions hy FRCIS (e) to (g) and
0)
to (I), FCM (h) and (m), and PCM (i) and (U) respectively using the HSV colour model.mmm
I
Fig. 3: Average percentages of error rates of the FRCIS, FCM, and PCM algorithms for the Fig. 2(a) and Fig. 2(c) image segnieiitations using the HSV and RGB colour modeIs.
The avemge error percentages (average of Type I and
LI
[SI) for the cloud
( 9 )
and crocodile ( R , ) regions of the imagecolour models, and the FRCIS, FCM, and PCM algorithms are shown in Fig. 3. It can be seen that the m r rates of FRCIS for all values of neighbourhood radius
r
are better than both FCM and PCM using both the HSV and RGB colour models.and fish images using the HSV colour model, compared with corresponding values of 2.4% and 12.5% for the RGB colour model.
(In) (a)
Fig. 4: (a) Gorilla image, (b) Ref. image for gorilla, (h) Fish inlape, (1) Ref. image for
fish,
The segmented results of the gorilla and fish images into two regions by FRCIS (c) to (e) and (i) to (I), FCM(0
and (m), and PCM (g) and (n)respectively using the HSV colour model.
b
+GorillaHN
&
20B
o
FirhRGB$! FRCIS, FRCIS. FRCIS, FCM CM
a
r i , ,=2 r i 4Algorithm
Fig. 5 : Average percentages of error rates of the FRCIS, FCM, and PCM algorithms for the Fig. 4(a) and 4(c) image segmentations using the HSV and RGB colour models.
Further experiments were conducted using the gorilla (Fig. 4(a)) and fish (Fig. 4(h)) iinages consisting of three distinct regions. The segmented results a i these two images produced by tlie FRCIS, FCM, and PCM algorithnls using the HSV colour model are presented in Fig. 4, which clearly illustrates that FRCIS separated gorilla ( R 2 ) (Pig. 4(c)
-
4(e)) better for the HSV colour model and all values ofr
than FCM and PCM (Pig. 4(f) - 4(g)). FRCIS also outperformed both FCM and PCM especially for ground and trees ( R , ) and fish ( R , ) regions for the fish image (Fig. 4(1)-
4(n)). PCM could not separate at all the fish ( R , ) from ground and trees (R,) region shown in Fig. 4(n). The comparative average error rates are presented in Fig. 5. The FRCIS algorithm obtained 4.9% ‘and 26.3% of the overall error improvnnents over FCM and PCM respectively for thc gorilla7. CONCLUSIONS
This paper has introduced a new algorithm called fuzzy ncle- based colour image sepnrentation (FRCIS) by atending the original GFRIS algorithm and integrating a new approach for averaging hue angles. Both a quantitative and qualitative analysis have been undertaken to compare it with FCM and PCM. The experimental results have shown that FRCIS outperformed both FCM and PCM for both HSV and RGB colour models. Since the proposed technique is fuzzy rule based, it is capable of incorporating any type of attribute of any special application domain.
8.
REFERENCES[I] G. C. Karmakar, L. Dooley, and S. M. Rahman, “Reviewon fuzzy iinage segmentation techniques,” in Design and h4anagenrenf of Multimedia Infomiation $stems: Opportunities a i d Clrallenges: Idea Group Publishing, Chapter).
[2] G.C. h a k a r and L.S. Dooley, “A Generic fuzzy d e b a d image segmentation algorithm”, Paneni Recognition Lenen, vol. 23,pp. 1215-1227,2002.
[3] H. D. Cheng, X. H. Jiang, Y. Sun, and J. L. Wang, “Colour Image Segmentation: Advances and Prospects,” Panem RecogniIionLeners, vol. 11, pp. 2259-2281,2001. [4] Y. W. Lim and S. U. Lee,
“On
the color image segnientationalgorithm hased 011 the thresholding and the fwzy c-means
techniques,” Pattem Recognition Leners, vol. 23, pp. 935- 952, 1990.
[SI A. Moghaddamzadesh and N. Bourbakis, “A fuzzy region growing approach for segmentation of color images,”
PatrcmRecognition Letters, vol. 30, pp. 935-952, 1997. [6] B. C. Chien and M. C. Cheng, “A colour image
segmentation approach based on f u z y similaity measire,” presented at FUZZ-IEEE’O2, 2002.
[7] H. D. Cheng, X. H. Jiang, and J. Wang, “Color inlage seginaitation based on homogram tbresholding and region inerguig,” Pattem Recogiritioir Letters, vol. 35: pp. 373-
393,2002.
[SI
T.
D. Pbam and H. Yan, “Color image segmentation usingfuzzy integral and mountain clustering,” F u z p Sets and , ~ , ~ ~ t ~ ~ ~ ~ , VOI. 107; pp. 121-130, 1999.
[9] Y.J. Zliang, “A survey on evaluation methods for image segmentation”, Pattem Recognition, 29, 8, 1335-1346, 1996.
[IO] J.C. Bezdek, “Patkm Recognition with Fuzzy Objective Function Algorithms”, New York: Plenum, 198 I .
clustering,” IEEE Transactions 011 Firqv Svstenrs, vol. 1,
[I21 S. J. Sangwine and R. E. N. Home, “The colour Image Processing Handbook” first edition ed.: Chapman & Hall, 1998.
[I31 D. Cardani, “Adventures in HSV Space,“
http:llw\\u..buena.com/artlcles/lisvspace.pdf, 2002. USA, pp. 282 -313, ISBN I-930708-00-9, 2001 (a Book
[ I I ] R. Krishnapuran and J. Keller, “A possibilistic approach to
W . 98.110, 1993.