Real-time Systems with TuningFork
David F. Bacon1, Perry Cheng1, Daniel Frampton2, David Grove1, Matthias Hauswirth3, and V.T. Rajan11
IBM T.J. Watson Research Center
19 Skyline Drive, Hawthorne, New York 10532, U.S.A. 2
Department of Computer Science, The Australian National University Canberra, ACT 0200, Australia
3 Universit`a della Svizzera Italiana
Via Giuseppe Buffi 13, CH-6904 Lugano, Switzerland
Abstract. TuningFork is an online, scriptable data visualization and analysis tool that supports the development and continuous monitor-ing of real-time systems. While Tunmonitor-ingFork was originally designed and tested for use with a particular real-time Java Virtual Machine, the ar-chitecture has been designed from the ground up for extensibility by leveraging the Eclipse plug-in architecture. This allows different client programs to design custom data formats, new visualization and analysis components, and new export formats.
The TuningFork views allow the visualization of data from time scales of microseconds to minutes, enabling rapid understanding and analysis of system behavior. We will demonstrate the application of TuningFork to our Metronome real-time garbage collector, and show how it allowed us to discover a variety of surprising phenomena about the operation of the system.
1
Introduction
When designing and developing system software of significant complexity, meet-ing performance goals is as important and challengmeet-ing as correctness. In the case of a real-time system, coarse-grained performance characteristics such as overall throughput alone are not enough to verify responsiveness or determine the causes of failure. The ability to measure and visualize fine-grained events is necessary for determining correctness and analyzing why the system misbehaved.
The large volume of data often generated by these systems is hard to un-derstand without visualization. In production systems where downtime is unac-ceptable, online monitoring and analysis can be useful for problem determination and resolution. During development, a real-time system must be tested for per-formance regression automatically and a useful analysis tool must also support scripting commands.
The demonstration will show how TuningFork is used to diagnose run-time anomalies in real-time behavior in Metronome [?,?], our real-time garbage collec-tor for Java implemented in the IBM J9 virtual machine product. The various views allow the identification of a failure to meet a high-level response-time specification using a time-strip animation, followed by identification of the cause using a histogram which categorizes different atomic sections of the garbage col-lector, and culminating in the identification of the precise point of failure in the execution of the program using an “oscilloscope” view which is able to visual-ize many seconds of execution while still showing behavior at the level of a few hundred microseconds.
2
Overall Architecture
At the high level, TuningFork’s architecture consists of a thin client-side layer which transmits application or JVM events and the server-side TuningFork vi-sualization application which we simply call TuningFork. The client is instru-mented at various points to collect special information and send the data in an application-specificfeed to TuningFork via a socket or to a file for post-mortem analysis.
At the high-level, the feed is broken intochunkswhich are the units of network transmission to TuningFork. Certain initial chunks describe overall properties as well as the format of the rest of the feed. The event chunks are the most interesting and constitute the bulk of the feed. Each event chunk includes a chunk identifier so that TuningFork can obtain the appropriate interpreter plug-in for that application. Splug-ince the client application may be multi-threaded, the data feed is broken into feedlets and each event chunk contains data only from one feedlet.
Because TuningFork is fundamentally a time-based tool, all events have a time stamp, typically the value of a cycle counter which on current architectures provides nanosecond-scale resolution. In order to present a globally time-ordered view of events to the rest of TuningFork, data from different feeds are merged into a single global feed by making data at a certain time visible only after all feeds have reached that point in time. Clock skew issues that arise on NUMA machines with multiple oscillators can be corrected during the event merge phase.
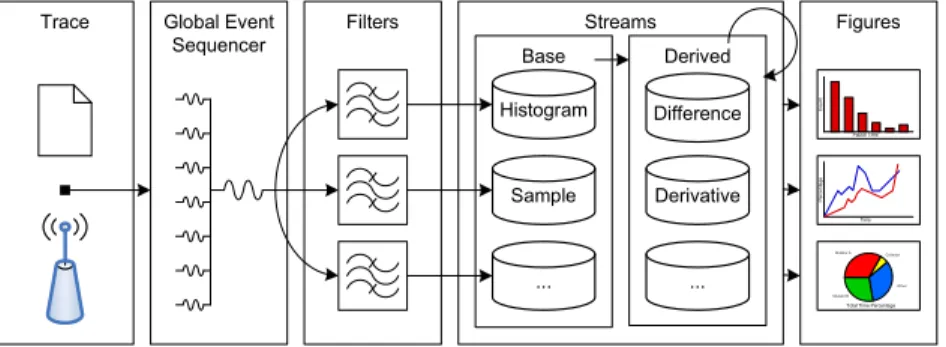
Because TuningFork is built on top of the Eclipse Rich Client Platform, it is simple for the application developer to export application-specific portions such as anevent chunk interpreterto TuningFork via the plug-in architecture. The ap-plication also can exportfilterswhich convert events to non-application-specific streams. These streams can then be composed into figures for visualization.
!
" #
Fig. 1.TuningFork Architecture
3
Streams
In a real-time system, many quantities of interest are time-series data. Because TuningFork can be used to monitor an online system or large post-mortem trace files, the volume of data will generally exceed the memory capacities of Tuning-Fork. The traditional method of implementing a ring buffer is simple but has the disadvantage of losing data that is older than the size of the buffer, making diagnosis of certain problems difficult and understanding of long-term trends impossible.
This can be ameliorated by keeping less precise data for older portions of the event stream. However, baked-in methods of data aggregation often work poorly when the metrics of interest are not known a priori, which is frequently the case when using a visualization tool. TuningFork uses a stream abstraction which approximates a function whose domain is an ever-increasing time range. The precision with which the data is kept changes depending on the volume of data; the particular method of aggregation is configurable.
The functional aspect of streams simplifies the computational model by using standard mathematical functions like addition, differentiation, and smoothing via convolution. Streams are initially created by applying filters to the events that enter the system. For example, a “used memory” filter would generate pairs of values (t, m) which are used to create the used memory stream which logically consists of the function memory(t) and the range [tstart, tend]. A new stream,
allocation rate, can be created by applying the differentiation filter to the “used memory” stream.
From the user’s and the tool developer’s perspective, streams have their own thread of control and auto-expand their time domain as more data becomes available. This makes it easy to develop views that update dynamically as new data arrives from the running system.
data in the streams are always kept at the highest possible resolution and it is the renderer’s responsibility to choose the appropriate resolution for a particular view.
4
Figures
At the heart of TuningFork are the visualization components, called figures. Figures are responsible for taking streams of data and displaying them to the user. The figure architecture has been carefully designed for extensibility, device-independent rendering, and high performance to allow the display of live data feeds with high data rates.
Although there is the potential for a near-infinite variety of visualization displays, visualizations are typically composed of several common reused sub-components. Histograms, axes, legends, and time series plots may occur many times within different visualizations, albeit with minor differences in display characteristics.
In order to facilitate the rapid development of new visualization components, TuningFork introduces two key design features: a high-level drawing interface tailored to on-line visualization, and painters. The high level interface allows device-independent drawing; we currently have both an SWT implementation for the user interface, and a PDF implementation for printing functionality. The programming interface includes simple painting functionality for basic shapes. Painters build on top of this simple interface to provide more complex, data-dependent visualization components such as axes, histograms, and time series plots.
Within this design framework, the role of a figure becomes to divide the visu-alization display into different areas, determine the precise data that needs to be drawn, and delegate drawing to various painter implementations. Additionally, the figure contains all state regarding the display settings for the visualization component. This can be accessed both through a host eclipse view, and via the programmatic conductor interface.
5
Conductor
The interactive visualization and analysis of TuningFork is very powerful. How-ever, there is also a need for automated analysis, in particular for such tasks as regression testing where the results of the analysis must be fed into automated tools that report performance anomalies and automatically create work items in the product development database.
Such text-based analyses are typically written as entirely separate tools. How-ever, the modular stream processing, filtering, and transformation facilities in TuningFork are extremely useful for building such analyses. In order to minimize code duplication, facilitate the creation of automated analyses, and to provide a more productive environment for power users, TuningFork includes the conduc-tor – a lightweight scripting environment.
It is possible to perform nearly all visualization operations from within the conductor, such as connecting to traces, opening figures, performing analysis, and exporting PDF files. Additionally, due to the pluggable nature of the application, it is possible to run the conductor outside of the graphical user interface, an important capability for automated testing. This allows the creation of tools produce purely textual results for use in larger programmatic systems, and for the creation of visualizations of exceptional conditions that can be uploaded into a web-based graphical database.
To assist with sound analysis, the conductor understands many basic math-ematical operations and constants. For commonly executed sequences of opera-tions, it is possible to create score files, which contain a sequence of conductor operations.
6
Related Work
A large body of work exists on performance visualization and analysis tools. ThePV Program Visualizer [?] can visualize very large event traces. Because of its stream based architecture it never needs to load the complete trace into memory. It works like a media player, providing an animated visualization of the information in a sliding window over the trace. PV supports temporal ver-tical profiling, integrating information from hardware, operating system, native libraries and native applications. It mainly focuses on visualizing events, states, and the corresponding source code, but can also visualize the value of a metric over time.
Sevitsky et al. [?] introduceJinsight, a visualization tool for execution traces gathered from Java programs. Its displays leverage the rich static program infor-mation available from Java programs. It introduces the concept of an execution slice as an easily configurable view on the complete trace. De Pauw et al. [?] show how to allow it to capture and visualize short burst of execution to allow the analysis of long running programs. Jinsight focuses exclusively on the Java part of a system, which includes the Java libraries, frameworks and application layers.
Mellor-Crummey et al. [?] present HPCView, a performance visualization tool together with a toolkit to gather hardware performance counter traces. They use sampling to attribute performance events to instructions, and then hierarchically aggregate the counts, following the loop nesting structure of the program. Their focus is on attributing performance counts to source code areas. Miller et al. [?] presentParadyn, a performance measurement infrastructure for parallel and distributed programs. Paradyn uses dynamic instrumentation to
Zaki et al. [?] introduce an infrastructure to gather traces of message-passing programs running on parallel distributed systems. They describe Jumpshot, a trace visualization tool, which is capable of displaying traces of programs running on a large number of processors for a long time. They visualize different (possibly nested) program states, and communication activity between processes running on different nodes. The newer version by Wu et al. [?] is also capable of correctly tracing multithreaded programs.
Pablo, introduced by Reed et al. [?], is another performance analysis infras-tructure focusing on parallel distributed systems. It supports interactive source code instrumentation, provides data reduction through adaptively switching to aggregation when tracing becomes too expensive, and introduces the idea of clustering for trace data reduction. DeRose et al. [?] describe SvPablo (Source View Pablo), loosely based on the Pablo infrastructure, which supports both interactive and automatic software instrumentation and hardware performance counters to gather aggregate performance data. They visualize this data for C and Fortran programs by attributing the metric values to specific source code lines.
Paraver [?] is a parallel program visualization tool. It allows the display of derived performance metrics, and it mentions the idea that vizualizations can facilitate pattern and causality relationship identification. They extend its use [?] for Java.
TheTauTuning and Analysis Utilities for Portable Parallel Programming [?] provide a complete infrastructure for tracing and visualization of static and dynamic properties of parallel programs. Its State and Event Display presents a timeline view of program activity and supports nested states.
The primary focus of most of those tools is on detecting performance bot-tlenecks in parallel high-performance applications. The two primary exceptions are PV and Jinsight, both focusing on general purpose applications.
7
Conclusions
We have presented TuningFork, a comprehensive tool for visualization and analy-sis tool for real-time systems. TuningFork allows visualization of real-time events as they are happening, and provides views that allow data to be visualized across a very wide range of time scales, while still providing a high degree of resolu-tion. Our experience has shown that the broad range of visualization capability promotes a deep understanding of the detailed behavior of real-time systems at both macro and micro time-scales.
References
1. Bacon, D. F., Cheng, P., Grove, D., Hind, M., Rajan, V. T., Yahav, E., Hauswirth, M., Kirsch, C. M., Spoonhower, D., and Vechev, M. T.
High-level real-time programming in Java. InProceedings of the Fifth ACM International Conference on Embedded Software(Jersey City, New Jersey, Sept. 2005), pp. 68–78. Invited paper.
2. Bacon, D. F., Cheng, P., and Rajan, V. T.A real-time garbage collector with low overhead and consistent utilization. InProceedings of the 30th Annual ACM SIGPLAN-SIGACT Symposium on Principles of Programming Languages (New Orleans, Louisiana, Jan. 2003). SIGPLAN Notices,38, 1, 285–298.
3. DeRose, L., and Reed, D. A. SvPablo: A multi-language architecture-independent performance analysis system. In Proceedings of the International Conference on Parallel Processing (Fukushima, Japan, September 1999).
4. Gary Sevitsky, Wim De Pauw, R. K. An information exploration tool for performance analysis of Java programs. InTOOLS Europe (March 2001). 5. Guitart, J., Torres, J., Ayguad´e, E., Oliver, J., and Labarta, J. Java
instrumentation suite: Accurate analysis of Java threaded applications. In 2nd Workshop on Java for High Performance Computing (part of the 14th ACM In-ternational Conference on Supercomputing ICS’00) (May 2000).
6. Kimelman, D., Rosenburg, B., and Roth, T. Strata-various: Multi-layer visu-alization of dynamics in software system behavior. InProceedings of the conference on Visualization ’94 (1994), IEEE Computer Society Press, pp. 172–178.
7. Labarta, J., Girona, S., Pillet, V., Cort´es, T., and Gregoris, L. DiP: A parallel program development environtment. In 2nd. International Euro-Par Conference(August 1996).
8. Mellor-Crummey, J., Fowler, R., and Marin, G. HPCView: A tool for top-down analysis of node performance. In Proceedings of the Los Alamos Com-puter Science Institute Second Annual Symposium(Santa Fe, New Mexico, October 2001).
9. Miller, B. P., Callaghan, M. D., Cargille, J. M., Hollingsworth, J. K., Irvin, R. B., Karavanic, K. L., Kunchithapadam, K., and Newhall, T.The
Paradyn parallel performance measurement tool. IEEE Computer 28, 11 (1995), 37–46.
10. Mohr, B., Malony, A., and Cuny, J.Parallel Programming using C++. M.I.T. Press, 1996, ch. TAU.
11. Newhall, T., and Miller, B. P. Performance measurement of dynamically compiled Java executions.
12. Pauw, W. D., Mitchell, N., Robillard, M., Sevitsky, G., , and Srinivasan, H.Drive-by analysis of running programs. InWorkshop on Software Visualization, International Conference on Software Engineering (May 2001).
13. Reed, D. A., Aydt, R. A., Noe, R. J., Roth, P. C., Shields, K. A., Schwartz,
B., and Tavera, L. F. Scalable performance analysis: The Pablo performance analysis environment. InProceedings of the Scalable Parallel Libraries Conference
(October 1993).
14. Wu, C. E., Bolmarcich, A., Snir, M., Wootton, D., Parpia, F., Chan, A., Lusk, E., and Gropp, W.From trace generation to visualization: A performance
framework for distributed parallel systems. InProc. of SC2000: High Performance Networking and Computing (November 2000).