Environmental metabolomics: Databases and tools for data analysis
Krista Longnecker
a,⁎
, Joe Futrelle
b, Elizabeth Coburn
c, Melissa C. Kido Soule
a, Elizabeth B. Kujawinski
a aWoods Hole Oceanographic Institution, Marine Chemistry and Geochemistry, Woods Hole, MA 02543, USA b
Woods Hole Oceanographic Institution, Applied Ocean Physics & Engineering, Woods Hole, MA 02543, USA cIndependent Consultant
a b s t r a c t
a r t i c l e i n f o
Article history: Received 12 January 2015
Received in revised form 10 June 2015 Accepted 16 June 2015
Available online 19 June 2015 Keywords:
Metabolomics Data analysis Database design
Metabolomics is the study of small molecules, or‘metabolites’, that are the end products of biological processes. While -omics technologies such as genomics, transcriptomics, and proteomics measure the metabolic potential of organisms, metabolomics provides detailed information on the organic compounds produced during metabolism and found within cells and in the environment. Improvements in analytical techniques have expanded our un-derstanding of metabolomics and developments in computational tools have made metabolomics data accessible to a broad segment of the scientific community. Yet, metabolomics methods have only been applied to a limited number of projects in the marine environment. Here, we review analysis techniques for mass spectrometry data and summarize the current state of metabolomics databases. We then describe a boutique database developed in our laboratory for efficient data analysis and selection of mass spectral targets for metabolite identification. The code to implement the database is freely available on GitHub (https://github.com/joefutrelle/domdb). Data organization and analysis are critical, but often under-appreciated, components of metabolomics research. Future advances in environmental metabolomics will take advantage of continued development of new tools that facilitate analysis of large metabolomics datasets.
© 2015 The Authors. Published by Elsevier B.V. This is an open access article under the CC BY-NC-ND license (http://creativecommons.org/licenses/by-nc-nd/4.0/).
1. Introduction
The exchange of organic compounds such as growth substrates, vitamins, and signaling molecules between microorganisms and their immediate surroundings is a central component of biogeochemical cycling in all environments. Genomics, transcriptomics, and proteomics data provide descriptions of how organisms may interact with these organic compounds. This information has led to key insights into the physiology of microorganisms and biochemical pathways that are po-tentially active in the marine environment. Thefield of metabolomics complements these data because it is used to directly assess active biochemical pathways, by measuring the end products of biological metabolic activity, i.e., the metabolites. Metabolomics studies can be grouped into two categories. Targeted metabolomics investigations obtain quantitative data on a pre-defined set of compounds, while untargeted metabolomics studies provide a broader exploration of me-tabolites with the goal of identifying new compounds (Patti et al., 2012). Environmental metabolomics is defined as the use of metabolomics techniques to characterize the metabolic response of organisms to natural and anthropogenic stressors in the environment (Viant, 2007).
Untargeted metabolomics datasets are large and multidimensional. While there have been improvements in computational programs that process mass spectrometry datafiles, tools are still needed to organize metabolites and their associated metadata to facilitate inter-experiment comparisons. Currently, two types of databases serve as re-positories for information on organic compounds such as metabolites. Thefirst type of database is focused on storage of chemical information of a compound, regardless of source. Two examples are the publically-accessible databases PubChem (Bolton et al., 2008) and ChemSpider (Pence and Williams, 2010) which contain vast amounts of data on or-ganic molecules and can be searched by exact mass or compound name. On a smaller scale, METLIN (Zhu et al., 2013) is a curated database of biological compounds which allows searching by exact mass and by fragmentation spectrum. None of the above databases incorporate meta-data and thus they do not provide an environmental context for any me-tabolite. In contrast, the second type of database allows contextualization of submitted experiments by explicitly including experimental metada-ta. The best example of such a database is the MetaboLights database (Haug et al., 2013; Steinbeck et al., 2012) which includes environmental data for the samples in the data repository. However, searches of MetaboLights currently access information about known compounds only. We are not aware of a database that allows searching of unknown compounds while retaining contextual metadata.
A metabolomics database has additional complications compared to other -omics databases. The structural and chemical composition of
⁎ Corresponding author at: WHOI MS#4, Woods Hole, MA 02543, USA. E-mail addresses:[email protected](K. Longnecker),[email protected] (J. Futrelle),[email protected](E. Coburn),[email protected](M.C. Kido Soule), [email protected](E.B. Kujawinski).
http://dx.doi.org/10.1016/j.marchem.2015.06.012
0304-4203/© 2015 The Authors. Published by Elsevier B.V. This is an open access article under the CC BY-NC-ND license (http://creativecommons.org/licenses/by-nc-nd/4.0/).
Contents lists available atScienceDirect
Marine Chemistry
genes and proteins are inherently simpler than that of metabolites because the number and diversity of building blocks are fewer. For ex-ample, gene sequences are comprised of only four orfive possible nucle-otides (A, G, C, T or U). Thus, a nucleic acid database such as GenBank (Benson et al., 2013) contains little chemical complexity and errors are primarily associated with interpretation such as gene annotation and homology assessments. In contrast, metabolites have no common building blocks, other than the elements of C, H, O, N, S and P; and their molecular structures and sizes are extremely diverse. Mass spectrometry-based metabolomics data are further complicated because each metabolite may be present as one or more adducts (e.g. [M + Na]+or [M + H]+) with different mass-to-charge values. In addition, there is instrument-specific error associated with the mass-to-charge measurement. For liquid chromatography-based (LC) measurements, retention time varies as a function of chromatographic parameters such as column chemistry, mobile phase, and elution gradi-ent. Finally, as with the gene-based databases, there is still the issue of identifying the metabolites and placing them into an environmental context.
An overarching goal of the research in our laboratory is the discov-ery, and subsequent quantification, of ecologically-relevant metabolites within marine ecosystems. For the database, we broadly define a metab-olite as any organic compound observed in the marine environment. We use a combination of laboratory experiments andfield sampling ex-peditions to uncover and to identify novel metabolites associated with important microorganisms in the marine environment. This goal re-quires the ability to store metabolomics data, to compare these data across different sampling scales, and to help focus time-consuming identification efforts on a tractable number of metabolites. As noted above, currently available databases cannot achieve these goals and thus we developed a boutique database for our laboratory. Inherent within this database development is a consideration of the computa-tional challenges associated with the analysis of untargeted metabolo-mics data, in particular those data generated by ultrahigh resolution mass spectrometers coupled to a LC system. In this paper, we start with a review of freely-available and open source data analysis tools and databases for metabolomics data. We then describe our boutique database and conclude by providing examples of advances that rely on this joint consideration offield and laboratory samples.
2. Materials and methods
2.1. Designing a metabolomics database
Design of the boutique metabolomics database began with a series of meetings with domain scientists (here, the chemists), information scientists, and software developers. The purpose of these meetings was to establish the goals for developing the database and the desired outcome of the completed database. We employed‘use cases’to guide this process, and the outcome was an informal abstract information model and system design. Use case development is an integral method-ology of the Tetherless World Constellation (Fox and McGuinness, 2008) and is an iterative method in which a small team of domain
scientists and informaticists work together to rapidly develop prototype software to achieve the use case goal. The information model developed during this process captured semantic relationships between key con-cepts involved in the production and analysis of mass spectrometry data, as well as relationships central to extracting new knowledge from metabolomics experiments.
The information model and prototype system architecture were documented to serve as the initial phase of software prototypes. The prototype is a simple command-line interface on an object-relational model (ORM) implemented using Python and SQLAlchemy. These tech-nologies, while not as powerful or scalable as technologies that would be appropriate for a larger database, have a number of features that make them attractive for prototyping. For example, the technologies are compatible with multiple platforms (e.g., Windows, Mac OS, Linux), are simple to install and configure, and enable rapid develop-ment, refinement and testing of new capabilities. The rapid prototyping
Fig. 1.A simplified version of the information model used to design the boutique database prototype. The complete information model is given in Fig. S1. The topics within the blue box are addressed inKido Soule et al. (2015-this issue).
Table 1
Brief description of the sources of metabolomics data used to populate the boutique database. The samples span laboratory experiments (‘lab exp.’) andfield expeditions, and include both intracellular and extracellular metabolite samples.
Sample type Extract type # of
samples # of metabolites
Citation
Lab exp. #1 Laboratory experiment withThalassiosira pseudonana Extracellular metabolites 17 6047 Longnecker et al. (2015) Lab exp. #2 Laboratory experiment withSynechococcus elongatus Extracellular metabolites 16 10,158 Fiore et al. (in press) Lab exp. #3 Laboratory experiment withRuegeria pomeroyi Intracellular metabolites 30 17,130 Johnson et al. (unpublished) Lab exp. #4 Laboratory experiment withThalassiosira pseudonana Intracellular metabolites 24 4835 Kujawinski et al. (unpublished) Lab exp. #5 Laboratory experiment with coastal seawater Intracellular and extracellular metabolites 62 19,294 Liu et al. (unpublished) Field #1 In situ samples, Pacific Ocean Intracellular and extracellular metabolites 73 4236 (unpublished) Field #2 Experiment with phytoplankton exudates, Atlantic Ocean Intracellular and extracellular metabolites 27 7667 (unpublished)
approach allowed us to converge on a stable abstract information model from which future prototypes can be built without having to undertake time-consuming redesign or development of extensive backwards-compatibility features. All prototyping was done under open-source licensing and code and documentation is available athttps://github. com/joefutrelle/domdb. The documentation includes a wiki that details the use of all the commands needed to populate the database and run queries.
Thefirst prototype is a database that can interpretfiles generated during XCMS data processing (seeSection 3.2.1). These inputfiles in-clude the mass-to-charge values, LC retention times, and peak area for all metabolites within a single experiment. The second inputfile is the metadata associated with each of the samples listed in the processed datafile. We require bothfiles to be present in order to prevent the ac-cumulation of data without corresponding metadata. For the metadata
file, we allow the user to provide the variables appropriate for their dataset. For example, the metadata variables for one set of samples may be station locations and sample depths, while another set of samples may include the name of an organism and the media used to culture the organism. These metadata are included in the output from the queries described inSection 2.3.
2.2. Environmental metabolomics data in the database
We populated the database with data from seven different sample sets. The selected sample sets include laboratory experiments and
field expeditions (Table 1) and were processed by different users in our research group. Each sample set contains 4000 to 11,000 metabolites, derived from between sixteen and seventy-three individual samples. To test the prototype database, we included mass spectrometry data collect-ed only in positive ion mode. Positive and negative ion mode data are not directly comparable because the metabolomics data in the database are the charged ions (e.g., [M + H]+or [M−H]−). A future version of the
da-tabase may convert the charged masses to neutral masses to recognize
that a single metabolite may be present as more than one measured mass-to-charge value or occur in more than one ionization mode.
2.3. Querying the metabolomics database
We use database queries to extract a subset of metabolites from the database. We designed two queries to access the metabolomics data. For both of these queries, we allow the user to set the desired retention time window and error in the mass-to-charge measurement. The default parameters are appropriate for our ultrahigh resolution mass spectrom-eter (FT-ICR MS), but they can be varied for other analytical platforms. The queries are implemented as commands in our prototype, and the syntax for each query type is described in the prototype's wiki. Thefirst query is the simplest: are there any metabolites in the database that match a given mass-to-charge value and retention time? This query is useful when the parameters for a specific metabolite are known, and the user is interested in determining the experiments in which the metabolite has been observed. The second query is more directed at our intended use of the database: given the metabolites within one set of samples, how many of these metabolites are found in other sample sets? With this query, the user is not restricted to searching for a single metabolite. Instead, the full set of metabolites for one experiment is queried across the entire database. The output from both of these queries is produced as comma-separated values (CSV) to make them readily available for analysis in R, MATLAB, or the user's desired program.
3. Results and discussion
3.1. Information model for metabolomics data
The information model inFig. 1(also Fig. S1) serves as the basis for the database prototype and is also useful to structure our review of existing data analysis tools and metabolomics databases. Each circle in the information model is a term used by the chemists. We define each term in a way that allows the computer scientists to use the information to guide the development of the database. Thus, the information model translates the language used by the chemists into terms accessible to the software developers, and vice versa. The small white circles in the complete information model (Fig. S1) provide additional details for each general term shown inFig. 1. The companion paper byKido Soule et al. (2015-this issue)discusses issues associated with metabolite extraction, LC–MS analysis, and processing of targeted mass spectrome-try data. This paper focuses on data processing and analysis methods to characterize untargeted metabolomics data.
3.2. Data analysis tools and techniques
The processing of metabolomics data occurs in four stages. Mass spectrometryfiles store data in proprietary formats that can only be accessed with vendor-specific software. Therefore, the data processing often begins with the conversion of mass spectrometry data into open data formats that make the data accessible to an array of analysis tools. Second, these datafiles are aligned to generate concatenated
Table 3
Select publically-accessible on-line metabolomics databases that can be searched to provide putative characterizations of metabolites from an untargeted mass spectrometry experiment.
Database Citation Website Comment
MetaboLights Haug et al. (2013) www.ebi.ac.uk/metabolights Includes metadata for the samples within the database METLIN Tautenhahn et al. (2012a) metlin.scripps.edu Curated database, also includes MS2 search capability ChemSpider Pence and Williams (2010) chemspider.com
PubChem Bolton et al. (2008) pubchem.ncbi.nlm.nih.gov Also searchable via Kasuza MFsearcherSakurai et al. (2014) LIPID MAPS Sud et al. (2007) www.lipidmaps.org
MMCD Cui et al. (2008) mmcd.nmrfam.wisc.edu Human Metabolome Database Wishart et al. (2013) www.hmdb.ca
MetaCyc Caspi et al. (2012) metacyc.org
Table 2
Summary of the classification scheme presented bySumner et al. (2007)to define four levels of compound identification.
Classification Description Identified compound
(Level 1)
At least two independent measurements relative to authentic standard analyzed using the same methods • retention time and mass spectrum
• retention time and NMR spectrum • accurate mass and tandem MS • accurate mass and isotope pattern • full1 H and/or13 C NMR, 2-D NMR spectra Putatively annotated compounds (Level 2)
Without chemical reference standards, based on physicochemical properties and/or spectral similarity with public/commercial spectral libraries
Putatively characterized compound classes (Level 3)
Based upon characteristic physicochemical properties of a chemical class of compounds, or by spectral similarity to known compounds of a chemical class Unknown compounds
lists of metabolites with their mass-to-charge values, retention times, and peak heights across the individual samples. Third, the concatenated lists of metabolites can be examined using univariate and multivariate statistical tools to assess patterns within the dataset. Fourth, the list of metabolites with their mass-to-charge values and retention times can be compared to on-line databases to begin the process of metabolite annotation. We address each of these tasks in the following sections. Thefirst three tasks have already been described in existing scientific literature (e.g.,Johnson et al., 2014), and we provide an overview and information about publications that include additional details. For the
final section, we consider the available metabolomics databases and present an overview of the boutique metabolomics database now used in our laboratory.
3.2.1. Processing mass spectrometry data to obtain a list of metabolites
The conversion of vendor-specific datafiles to open source formats accessible to a range of computational platforms is often thefirst step in data analysis. The ProteoWizard library (Kessner et al., 2008) includes the msConvert tool which is able to read datafiles from different mass spectrometers and convert them into open data formats that can be used to store and exchange mass spectrometry data. We have found that the msConvert tool provides more accurate datafile conversion than the ReAdW.exe program provided by Thermo Fisher Scientific (data not shown). The converted datafiles can then be viewed with tools specifically for mass spectrometry data (e.g., MZmine or XCMS), or with user-defined scripts written in R or MATLAB.
There are multiple open-source programs for mass spectrometry peak picking and alignment. Here, we describe programs that typify the range of available software. MZmine (Pluskal et al., 2010) will identify peaks in mass spectrometry data, align the resulting peaks across a set of samples, and export a list of metabolites for analysis in other programs. MZmine is easy to use due to its graphical user interface. How-ever, MZmine requires manual input from the user at each step and does not retain details about the options chosen during the data analysis. In contrast, XCMS (Smith et al., 2006) requires more programming knowl-edge but the data analysis steps can be automated once the appropriate parameters are chosen. XCMS provides multiple options for peak picking and alignment algorithms. Finally, the expansion of XCMS to XCMS On-line (Tautenhahn et al., 2012b) provides a middle ground for users not as comfortable with computer programming, but who desire more con-trol in parameter selection. XCMS Online also incorporates univariate and multivariate statistical tools that can be used to analyze metabolo-mics data (Gowda et al., 2014). The end product of all of these programs is a list of metabolites that forms the base of subsequent data analysis.
Quality control (QC) of metabolomics data is an important step before further data analysis. One method to assess variability in mass spectrometry data is repeated analysis of a pooled sample that is repre-sentative of all samples analyzed in a single project (for details see:Kido Soule et al., 2015-this issue).Dunn et al. (2011)describe a low-order non-linear locally estimated smoothing function (LOESS) to estimate shifts in peak area in the QC samples as a function of analysis order on the mass spectrometer. The peak area for each metabolite in each sample is then adjusted to thefitted curve. Following this step, any metabolites present in less than 50% of the QC samples or metabolites with a mean rel-ative standard deviation (RSD = standard deviation / mean∗100) in the QC samples of more than 20% are removed from the dataset (Dunn et al., 2011).Vinaixa et al. (2012)extend this idea to sample sets where QC data are not available. They propose removing any metabolite in an experi-ment that has an RSD less than 20% (Vinaixa et al., 2012). Collectively, these data processing steps are designed to reduce the impact of instru-ment variability on conclusions reached during subsequent data analysis.
3.2.2. Finding patterns in metabolomics data
Patterns in metabolite presence or absence as a function of changes in abiotic or biotic parameters provide afingerprint of the chemical di-versity within a sample and can be explored even when metabolite
identities are not available. A simple experimental design can focus the data analysis steps even before the metabolomics data have been generated. For example, metabolites can be measured under two differ-ent growth conditions such as nutridiffer-ent-limited and nutridiffer-ent-replete growth. In this circumstance, the data can be analyzed tofind metabo-lites that are present in significantly higher (or lower) amounts under one of the growth conditions. This question requires univariate statisti-cal tools and the steps needed to prepare metabolomics data for addressing univariate questions have been described byVinaixa et al. (2012). The vast amount of data generated by a metabolomics experi-ment can be more easily reduced to clear conclusions when there is only a single variable altered in an experiment.
Metabolomics data can also be considered in conjunction with mul-tiple biotic and abiotic factors that may alter the patterns of metabolites present in a sample set. Simultaneously considering multiple factors requires the use of multivariate statistical tools. The goal of such analy-ses is often to consider the patterns in overlap between metabolites
Fig. 3.Two-way Venn diagrams are a simple tool to compare metabolites from different sets of samples. Thefigure shows the overlap in the number of metabolites between (A) afield sampling expedition and a laboratory experiment and (B) laboratory experiments with two different marine phytoplankton.
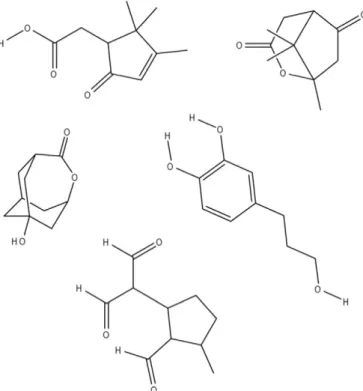
Fig. 2.Exact mass is not sufficient to identify an organic compound. For example,five possible chemical structures were found in the METLIN database for a metabolite with a mass-to-charge value = 181.0868838. Without additional information, we cannot identify this metabolite.
across a sample set and to determine which combination of environ-mental (or experienviron-mental) factors is correlated with specific metabolites. This type of metabolomics data analysis builds on the statistical tech-niques used by community ecologists to understand the factors control-ling the distribution of biological communities (e.g.,McCune and Grace, 2002) and often includes parametric statistical tools. While non-parametric tools result in a loss of statistical power, they do not require the metabolomics data to be normally distributed.
3.3. Databases and related tools for metabolomics data analysis
Putative annotation of statistically-interesting mass spectral features is a common goal of untargeted metabolomics studies. For example, a
metabolite might only be present under specific environmental conditions or might be released solely by one type of microorganism. Compounds in untargeted metabolomics experiments are initially des-ignated‘unknown compounds’and there are different levels of identifi -cation depending on the methods used to identify the metabolites. The strength of metabolite identifications can be characterized using the foundation described bySumner et al. (2007)(Table 2). From strongest to weakest, compounds are‘identified’,‘putatively annotated’,‘ puta-tively characterized’, or‘unknown compounds’. The definitive identifi -cation of a compound requires two independent assessments of the metabolite compared to an authentic standard. However, depending on the research question, putative annotations or characterizations may be sufficient for the study's goals.
Fig. 4.As an example, one metabolite in the database was found in laboratory experiments with three different organisms (A, B, C) and in water samples collected from the Pacific Ocean (D). (C) shows the intracellular (‘int’) and extracellular (‘ext’) metabolites extracted fromR. pomeroyigrown with propionate or DMSP. The dashed lines show the trends in peak areas. In the Pacific Ocean samples (D), the points are color-coded to show the distance from shore where the samples were collected and the peak areas of the metabolite in the extracellular metabolites and the intracellular metabolites extracted from 1.6μm or 0.2μmfilters.
One means to obtain information about a metabolite initially is to search databases of organic compounds by exact mass. There are multi-ple freely-accessible databases where this is an option through an on-line interface (Table 3). While the output from these searches provides afirst glimpse into the potential identity of a metabolite, structural iso-mers cannot be distinguished solely based on exact mass (Fig. 2) and additional data such as fragmentation spectra are needed to provide an identification. In our opinion, METLIN (Tautenhahn et al., 2012a) is the most useful metabolomics database for compound identification be-cause it is a curated database of compounds analyzed by the Siuzdak laboratory, containing exact mass and fragmentation data for a wide variety of metabolites (Zhu et al., 2013). Once a metabolite has been identified, an investigator often wants to compare their data to similar experiments with this metabolite. For this purpose, MetaboLights provides the best publically-accessible database. In contrast to the METLIN database, any registered user can submit data to MetaboLights (Haug et al., 2013) and the submitted data receives an accession number that can be referenced during subsequent publications. MetaboLights is hosted by the European Bioinformatics Institute, part of the European Molecular Biology Laboratory (EMBL-EBI) and is fully backed by EMBL core funding, ensuring data availability and continuity of service. The team working on MetaboLights actively promotes consis-tent standards for the storage and sharing of metabolomics data (Salek et al., 2013) which further ensures that the information will be available now and in the future. Although the data within MetaboLights is search-able, a compound name or ChEBI identifier (Hastings et al., 2013) must be provided.
There are additional computational tools that can aid in putative compound identification. These tools may help distinguish between multiple isomers noted during searches based on exact mass. MetFrag (Wolf et al., 2010) and its successor, MetFusion (Gerlich and Neumann, 2013), combine database searches based on mass with in silico fragmentation of the resulting chemical compounds. The masses of the in silico fragments are then compared to the list of measured masses from the fragmentation (i.e. MS2) spectra. MetFusion expands on this technique by searching the MS2 fragments provided by the user against the MS2 fragments available in databases such as MassBank (Horai et al., 2010). Yet another approach is taken with computational tools that rely on the available biochemical pathway information to rank putative annotations based on the number of metabolites mea-sured within a given biochemical pathway. These programs have been established in Python (mummichog,Li et al., 2013) or in R (ProbMetab,
Silva et al., 2014). Their documentation includes the details needed to incorporate existing knowledge about biochemical pathways to increase the likelihood of obtaining the correct information about a metabolite.
3.4. Boutique metabolomics database
We developed a boutique database for metabolomics data to achieve two goals. First, we wanted a tool to store our processed metabolomics data so it could be mined repeatedly after the initial data analysis was completed. Metabolomics data provide a rich opportunity for explora-tion, and each datafile may ultimately provide the answer to a series of research questions beyond was what originally intended for a given dataset. Second, we wanted to use the database as a discovery tool to search for overlap in metabolites across multiple laboratory experi-ments andfield expeditions. Thus, the database allows us to focus our identification efforts on those metabolites that are most likely to be environmentally and/or ecologically relevant.
Our boutique database relies on matches based on both mass-to-charge values and retention times. All datasets currently within this database have been collected with the same LC-based method for com-pound separation in order to minimize any differences in LC conditions that cause retention time variability and prevent a comparison of data across experiments. Yet, we recognize that even with the same
analytical conditions, differences in extraction methods and matrix ef-fects (Griffith et al., 2014; Matuszewski et al., 2003; Piehowski et al., 2013) raise concerns about directly comparing data from different ex-periments (Lange et al., 2008). The current version of our database con-siders each combination of a mass-to-charge value and a retention time as a unique metabolite. Therefore, if one metabolite forms two different adducts, there will be two different measured mass-to-charge values and our database will consider them as two different metabolites. For these reasons, we view the database as an option to help explore meta-bolomics data, and not as a tool to make definitive metabolite identifi ca-tions. Putative identifications that are suggested by overlap within the database should be confirmed with authentic standards.
We populated the prototype database with metabolomics data from the sample sets described in the methods section. This resulted in a col-lection of almost 70,000 potential metabolites in our database. Two-way Venn diagrams (Fig. 3) allow easy visualization of the number of metab-olites found in more than one experiment. We use these diagrams to initially consider the overlap between metabolites measured in labora-tory experiments andfield expeditions (Fig. 3A) or between two differ-ent laboratory experimdiffer-ents (Fig. 3B). As shown in these examples, most of the metabolites are unique to a given experiment orfield expedition. However, a substantial number of metabolites are found in both laboratory experiments andfield expeditions.
We then differentiate noteworthy metabolites based on the environ-mental conditions under which the metabolite was observed. The re-sults from the database query include the metadata for each sample. For example, one of the metabolites showed increases in peak areas over time in laboratory experiments run with three different model or-ganisms (Fig. 4A, B, C). In the experiment withRuegeria pomeroyi, this metabolite had higher concentrations in the intracellular metabolites compared to the extracellular metabolites regardless of whether
R. pomeroyiwas grown on propionate or dimethylsulfoniopropionate (DMSP) (Fig. 4C). Yet, in thefield samples from the Pacific Ocean (Fig. 4D), the opposite situation was observed and extracellular concen-trations exceeded intracellular concenconcen-trations of this metabolite. Thus, this metabolite is present in multiple sample sets and it warrants additional investigation into its identity.
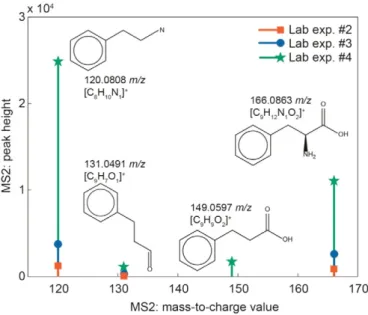
Our next step in the investigation of a metabolite is to access infor-mation such as the fragmentation spectrum. For this metabolite, we have fragmentation spectra from three different sample sets and two
Fig. 5.MS2 fragmentation spectra for the metabolite shown inFig. 4are available from three different experiments. The structures above each measured mass-to-charge value are the in silico fragments calculated by MetFrag. The feature present at 166m/zis the parent ion.
of the MS2 fragments were found in all three sample sets (Fig. 5). We used MetFrag to compare the in silico fragmentation pattern from the parent mass with the measured MS2 fragments. The in silico fragments predicted by MetFrag are shown above each fragment inFig. 5. There are over a thousand possible matches between the measured mass and the exact masses listed in the ChemSpider database. MetFrag ranks its output, and one-third of the top 100 possibilities matched all three of the fragments' measured mass-to-charge values. One of the possible matches presented by MetFrag is phenylalanine, which is a compound we measure in our targeted mass spectrometry method (Kido Soule et al., 2015-this issue). Phenylalanine is a non-polar amino acid present in nanomolar quantities in seawater (Yamashita and Tanoue, 2003). Phenylalanine has been measured in a variety of marine ecosystems and it is generally less than 3% of the amino acids re-covered from seawater samples (Hubberten et al., 1994; Kaiser and Benner, 2009; McCarthy et al., 1996; Yamashita and Tanoue, 2004). This exercise is a compelling proof-of-concept example of the utility of our database because it shows that our targeted and untargeted methods are yielding comparable results across different sample sets and analytical platforms. While the analysis of the MS2 fragments is not yet automated within our data analysis pipeline, this is an obvious next step in the development of the database.
Querying the boutique database can also reveal details about novel metabolites. For example,Fiore et al. (in press)observed the unexpect-ed presence of kynurenine in the extracellular metabolites from a cul-ture experiment withSynechococcus elongatus. The identification of kynurenine was confirmed through analysis of an authentic standard. Yet, prior to this observation, kynurenine was not recognized as a com-ponent of the metabolic profile ofS. elongatusand we did not know if it could be detected in the marine environment. Querying the boutique database revealed kynurenine was present in the intracellular metabo-lites from two additional laboratory experiments (Fig. 6A and B). In the
field samples, kynurenine was observed in the intracellular and extra-cellular metabolites from Atlantic Ocean seawater that was used to con-duct an experiment assessing the utilization of phytoplankton exudates (Fig. 6C). The complete absence of kynurenine in the Pacific Ocean sam-ples raises questions about the interactions between microorganisms and kynurenine. For example, is kynurenine produced in the Pacific Ocean and immediately consumed by the in situ community? What is the role of carbon source or inorganic nutrient availability in the intra-cellular production of kynurenine? Is kynurenine exuded from a cell or released through mortality-related processes? We have future
plans to test these hypotheses using a combination offield and labora-tory experiments. We expect that ongoing and future applications of the database will highlight additional mass spectral features that are common (or unique) across metabolically diverse microbes and distinct environmental settings.
4. Conclusions
Metabolomics data analysis is a newfield that is changing rapidly. The tools we have reviewed here are at the forefront of environmental metabolomics and we expect new tools to be developed as interest in thisfield expands. We have made our database code readily available at GitHub (https://github.com/joefutrelle/domdb) to allow other labo-ratories to implement the database and use it for the organization and analysis of their own metabolomics data. Yet, there are challenges asso-ciated with the expansion of our boutique database to an environmental metabolomics database that can serve as a general resource for ocean-ography. Most important, the community as a whole must address how to consider data collected using different extraction protocols and analytical methods. This data integration challenge will require input from a broad spectrum of scientists interested in marine metabo-lomics. In the interim, our boutique database enables each lab to search within their own datasets in order to develop new hypotheses that can be tested in thefield. With future advances in environmental metabolo-mics, we hope that the ideas we have presented on the combination of metabolomics data and associated metadata will provide new insights into novel metabolites found in marine environments.
Supplementary data to this article can be found online athttp://dx. doi.org/10.1016/j.marchem.2015.06.012.
Acknowledgments
We thank Andy Maffei and Cyndy Chandler for discussions on the organization of metabolomics data, Cara Fiore, Winn Johnson and Yina Liu for providing metabolomics data from laboratory experiments, Craig Carlson for providing the phytoplankton exudate used in the At-lantic Ocean experiment, Crystal Breier and Gretchen Swarr for assis-tance in the lab, and the WHOI FT-MS Users' Facility for analyzing the metabolomics samples. We appreciate the comments of two reviewers who helped us consider the broader relevance of databases in environ-mental metabolomics. Thefield data populating the database comes from scientific cruises funded by grants from the National Science
Fig. 6.Kynurenine, a tryptophan oxidation product, was initially observed in an experiment withSynechoccocus elongatus(Fiore et al., in press). Querying the boutique database, we observed kynurenine in the intracellular metabolites from two laboratory experiments (A, B) and in the intracellular (‘int.’) and extracellular (‘ext.’) metabolites from an experiment con-ducted with Atlantic Ocean seawater (C). The laboratory experiments both compared the response of microorganisms to different media. In (C), the in situ microorganisms were provided with exudate from a phytoplankton culture.
Foundation to EBK and KL (Atlantic Ocean, OCE-1154320) and E.V. Armbrust (Pacific Ocean, OCE-1205233). The laboratory experiment with coastal seawater was funded by a grant from the Gulf of Mexico Research Initiative to EBK and H.K. White; these data are available on the GRIIDC web site under Unique Dataset Identifier (UDI): R2.x229.000:0004. The laboratory experiments with microbial isolates and the database development are funded by the Gordon and Betty Moore Foundation through Grant GBMF3304 to EBK.
References
Benson, D.A., Cavanaugh, M., Clark, K., Karsch-Mizrachi, I., Lipman, D.J., Ostell, J., et al., 2013.GenBank. Nucleic Acids Res. 41, D36–D42.
Bolton, E.E., Wang, Y., Thiessen, P.A., Bryant, S.H., 2008.PubChem: integrated platform of small molecules and biological activities. Annual Reports in Computational Chemistry.
Caspi, R., Altman, T., Dreher, K., Fulcher, C.A., Subhraveti, P., Keseler, I.M., et al., 2012.The MetaCyc database of metabolic pathways and enzymes and the BioCyc collection of pathway/genome databases. Nucleic Acids Res. 40, D742–D753.
Cui, Q., Lewis, I.A., Hegeman, A.D., Anderson, M.E., Li, J., Schulte, C.F., et al., 2008. Metabolite identification via the Madison Metabolomics Consortium Database. Nat. Biotechnol. 26, 162–164.
Dunn, W.B., Broadhurst, D., Begley, P., Zelena, E., Francis-McIntyre, S., Anderson, N., et al., 2011.Procedures for large-scale metabolic profiling of serum and plasma using gas chromatography and liquid chromatography coupled to mass spectrometry. Nat. Protoc. 6, 1060–1083.
Fiore, C.L., Longnecker, K., Kido Soule, M.C., Kujawinski, E.B., 2015. Release of ecologically relevant metabolites by the cyanobacterium,Synechococcus elongatusCCMP 1631. Environ. Microbiol.http://dx.doi.org/10.1111/1462-2920.12899(in press). Fox, P., McGuinness, D.L., 2008.http://tw.rpi.edu/web/doc/TWC_SemanticWebMethodology. Gerlich, M., Neumann, S., 2013.MetFusion: integration of compound identification
strat-egies. J. Mass Spectrom. 48 (3), 291–298.
Gowda, H., Ivanisevic, J., Johnson, C.H., Kurczy, M.E., Benton, H.P., Rinehart, D., et al., 2014. Interactive XCMS Online: simplifying advanced metabolomic data processing and subsequent statistical analyses. Anal. Chem. 86, 6931–6939.
Griffith, D.R., Kido Soule, M.C., Matsufuji, H., Eglinton, T.I., Kujawinski, E.B., Gschwend, P.M., 2014.Measuring free, conjugated, and halogenated estrogens in secondary treated wastewater effluent. Environ. Sci. Technol. 48, 2569–2578.
Hastings, J., de Matos, P., Dekker, A., Ennis, M., Harsha, B., Kale, N., et al., 2013.The ChEBI reference database and ontology for biologically relevant chemistry: enhancements for 2013. Nucleic Acids Res. 41, D456–D463.
Haug, K., Salek, R.M., Conesa, P., Hastings, J., de Matos, P., Rijnbeek, M., et al., 2013. MetaboLights—an open-access general-purpose repository for metabolomics studies and associated meta-data. Nucleic Acids Res. 41, D781–D786.
Horai, H., Arita, M., Kanaya, S., Nihei, Y., Ikeda, T., Suwa, K., et al., 2010.MassBank: a public repository for sharing mass spectral data for life sciences. J. Mass Spectrom. 45, 703–714.
Hubberten, U., Lara, R.J., Kattner, G., 1994.Amino acid composition of seawater and dissolved humic substances in the Greenland Sea. Mar. Chem. 45, 121–128. Johnson, C.H., Ivanisevic, J., Benton, H.P., Siuzdak, G., 2014.Bioinformatics: the next
frontier of metabolomics. Anal. Chem. 87, 147–156.
Kaiser, K., Benner, R., 2009.Biochemical composition and size distribution of organic matter at the Pacific and Atlantic time-series stations. Mar. Chem. 113, 63–77. Kessner, D., Chambers, M., Burke, R., Agus, D., Mallick, P., 2008.ProteoWizard: open
source software for rapid proteomics tools development. Bioinformatics 24, 2534–2536.
Kido Soule, M.C., Longnecker, K., Johnson, W.M., Kujawinski, E.B., 2015.Environmental metabolomics: analytical strategies. Mar. Chem. 177, 374–387 (in this issue). Lange, E., Tautenhahn, R., Neumann, S., Gropl, C., 2008.Critical assessment of alignment
procedures for LC–MS proteomics and metabolomics measurements. BMC Bioinforma. 9, 375.
Li, S.Z., Park, Y., Duraisingham, S., Strobel, F.H., Khan, N., Soltow, Q.A., et al., 2013. Predicting network activity from high throughput metabolomics. PLoS Comput. Biol. 9.
Longnecker, K., Kido Soule, M.C., Kujawinski, E.B., 2015.Dissolved organic matter produced byThalassiosira pseudonana. Mar. Chem. 168, 114–123.
Matuszewski, B.K., Constanzer, M.L., Chavez-Eng, C.M., 2003.Strategies for the assessment of matrix effect in quantitative bioanalytical methods based on HPLC–MS/MS. Anal. Chem. 75, 3019–3030.
McCarthy, M., Hedges, J., Benner, R., 1996.Major biochemical composition of dissolved high molecular weight organic matter in seawater. Mar. Chem. 55, 281–297. McCune, B.M., Grace, J.B., 2002.Analysis of ecological communities. MjM Software Design,
Gleneden Beach, Oregon.
Patti, G.J., Yanes, O., Siuzdak, G., 2012.Metabolomics: the apogee of the omics trilogy. Nat. Rev. Mol. Cell Biol. 13, 263–269.
Pence, H.E., Williams, A., 2010.ChemSpider: an online chemical information resource. J. Chem. Educ. 87, 1123–1124.
Piehowski, P.D., Petyuk, V.A., Orton, D.J., Xie, F., Moore, R.J., Ramirez-Restrepo, M., et al., 2013.Sources of technical variability in quantitative LC–MS proteomics: human brain tissue sample analysis. J. Proteome Res. 12, 2128–2137.
Pluskal, T., Castillo, S., Villar-Briones, A., Oresic, M., 2010.MZmine 2: modular framework for processing, visualizing, and analyzing mass spectrometry-based molecular profile data. BMC Bioinforma. 11, 395.
Sakurai, N., Ara, T., Enomoto, M., Motegi, T., Morishita, Y., Kurabayashi, A., et al., 2014. Tools and databases of the KOMICS web portal for preprocessing, mining, and dis-semination of metabolomics data. BioMed. Res. Int. 2014, 11.
Salek, R., Haug, K., Steinbeck, C., 2013.Dissemination of metabolomics results: role of MetaboLights and COSMOS. GigaScience 2, 8.
Silva, R.R., Jourdan, F., Salvanha, D.M., Letisse, F., Jamin, E.L., Guidetti-Gonzalez, S., et al., 2014.ProbMetab: an R package for Bayesian probabilistic annotation of LC– MS-based metabolomics. Bioinformatics 30, 1336–1337.
Smith, C.A., Want, E.J., O'Maille, G., Abagyan, R., Siuzdak, G., 2006.XCMS: processing mass spectrometry data for metabolite profiling using nonlinear peak alignment, matching, and identification. Anal. Chem. 78, 779–787.
Steinbeck, C., Conesa, P., Haug, K., Mahendraker, T., Williams, M., Maguire, E., et al., 2012. MetaboLights: towards a new COSMOS of metabolomics data management. Metabo-lomics 8, 757–760.
Sud, M., Fahy, E., Cotter, D., Brown, H.A., Dennis, E.A., Glass, C.K., et al., 2007.LMSD: LIPID MAPS structure database. Nucleic Acids Res. 35, 527–532.
Sumner, L., Amberg, A., Barrett, D., Beale, M., Beger, R., Daykin, C., et al., 2007.Proposed minimum reporting standards for chemical analysis. Metabolomics 3, 211–221. Tautenhahn, R., Cho, K., Uritboonthai, W., Zhu, Z., Patti, G.J., Siuzdak, G., 2012a.An
accel-erated workflow for untargeted metabolomics using the METLIN database. Nat. Biotechnol. 30, 826–828.
Tautenhahn, R., Patti, G.J., Rinehart, D., Siuzdak, G., 2012b.XCMS Online: a web-based platform to process untargeted metabolomic data. Anal. Chem. 84, 5035–5039. Viant, M.R., 2007.Metabolomics of aquatic organisms: the new‘omics’on the block. Mar.
Ecol. Prog. Ser. 332, 301–306.
Vinaixa, M., Samino, S., Saez, I., Duran, J., Guinovart, J.J., Yanes, O., 2012.A guideline to univariate statistical analysis for LC/MS-based untargeted metabolomics-derived data. Metabolites 2, 775–795.
Wishart, D.S., Jewison, T., Guo, A.C., Wilson, M., Knox, C., Liu, Y., et al., 2013.HMDB 3.0—the Human Metabolome Database in 2013. Nucleic Acids Res. 41, D801–D807. Wolf, S., Schmidt, S., Muller-Hannemann, M., Neumann, S., 2010.In silico fragmentation
for computer assisted identification of metabolite mass spectra. BMC Bioinforma. 11, 148.
Yamashita, Y., Tanoue, E., 2003.Chemical characterization of protein-likefluorophores in DOM in relation to aromatic amino acids. Mar. Chem. 82, 255–271.
Yamashita, Y., Tanoue, E., 2004.Chemical characteristics of amino acid-containing dissolved organic matter in seawater. Org. Geochem. 35, 679–692.
Zhu, Z.-J., Schultz, A.W., Wang, J., Johnson, C.H., Yannone, S.M., Patti, G.J., et al., 2013. Liquid chromatography quadrupole time-of-flight mass spectrometry characteriza-tion of metabolites guided by the METLIN database. Nat. Protoc. 8, 451–460.