Cape Peninsular University of Technology
Bandile Jama
Aspects of Thermography for Non-Destructive Testing in
Mechanical Maintenance
by
Bandile Jama
Dissertation submitted in partial fulfilment of the
requirements for the degree
Masters of Engineering: Mechanical Engineering
Supervisor : Prof Jasson Gryzagoridis
Co-supervisor : Mr Graham Wilson
Bellville
2017-11-07
CPUT copyright information
The dissertation may not be published either in part (in scholarly, scientific or technical
journals), or as a whole (as a monograph), unless permission has been obtained from the
University.
Cape Peninsular University of Technology
Bandile Jama
DECLARATION
I, Bandile Jama, declare that the contents of this dissertation represent my own unaided work, and that the dissertation has not previously been submitted for academic examination towards any qualification. Furthermore, it represents my own opinions and not necessarily those of the Cape Peninsula University of Technology.
Cape Peninsula University of Technology
IBandile Jama
ABSTRACT
Infrared thermography (IRT) is a non-contacting, non-destructive testing (NDT) technique that provides relatively fast results from inspections; for example, in the detection of defects in engineering components and in systems' condition monitoring. This study examines the use and possible effectiveness of infrared thermography for the detection of faults and defects in just a few aspects that one encounters in the vast mechanical maintenance arena. The study discusses three aspects of infrared thermography, namely internal leaks inspections using passive infrared thermography, pulse thermography and induction thermography both active IRT NDT techniques for the detection of subsurface and surface defects.
The promising results that were obtained by performing an experiment in the laboratory using a model fluid handling pipe network, with three isolation valves connected in parallel, encouraged performing inspections in an operating power plant, where it was suspected that there were leaks from safety and drain isolation valves. In both situations, the results were obtained in a short period of time and indicated that passive infrared thermography can detect internal leaks in pipe networks.
Pulsed thermography is an active non-contacting non-destructive testing technique used to detect subsurface defects in monolithic materials and delamination's in composites. In the particular experiment that was performed pulse thermography was benchmarked with the conventional technique of ultrasound testing. PVC, stainless steel and mild steel specimens manufactured with flat bottom holes (as models of subsurface defects) were subjected to pulse thermography. The time duration to detect the presence of a defect represented by a temperature contrast or a hot spot on the specimen's surface was approximately a couple of seconds following the thermal excitation. No further characterization of the defect was possible with the technique. In contrast when using the ultrasound testing technique to test the specimens, it took considerable time to detect the defects, however, data in terms of size and depth beneath the surface became available thus enabling their full characterization. In this study, the use of induction thermography as an alternative to the conventional non-destructive techniques of magnetic particle and dye penetration inspections for the detection of surface defects was attempted. Experiments using induction thermography, on metallic electromagnetic specimens were performed, in the laboratory as well as on components obtained from the power plant. 304L stainless steel pipe specimen, an HP turbine stud and a CV-joint with natural surface defects (cracks) were subjected to induction thermography
Cape Peninsula University of Technology
IIBandile Jama
conditions for a short duration. The results delineated the presence of cracks as a solid line with higher contrast compared to other areas of the specimen. In comparison with MPI and DPI, the technique could reveal more defects within a short period of time and may be considered as a preferable NDT technique for large surface inspections as per results obtained from 304L stainless steel specimen.The results from this study suggest that infrared thermography is a non-destructive technique that can be utilized with different degrees of effectiveness in the mechanical maintenance arena where NDT techniques such as UT, MPI, and DPI have been, by tradition, employed in the past.
Keywords: Infrared Thermography, Pulse Thermography, Induction thermography, defects, UT, MPI, DPI.
Cape Peninsula University of Technology
IIIBandile Jama
ACKNOWLEDGEMENT
I wish to thank:
The Lord Jesus who granted me wisdom, knowledge and understanding, and gave me courage and passion to pursue and complete this study.
Amanda Jama my wife, for her regular support and encouragement towards the completion of this study.
Prof. Jasson Gryzagoridis my principal supervisor, for his professional guidance, motivation and exceptional feedback throughout this study.
Graham Wilson "Gra" my co-supervisor for his words of encouragement and immense knowledge of non-destructive testing and the skills he transferred to me during experiments studies.
Zain George, for his continuous support and availing the NDT lab for me to perform experiments.
Prof Graham Oliver, for his guidance throughout my Master degree program.
Angelo Force and his team, for continuously allowing me to use their infrared camera FLIR T640 throughout the studies.
Koeberg Machine Shop Team, for assisting me with the preparation of specimens.
Cape Peninsula University of Technology
IVBandile Jama
DEDICATION
Dedicated to my beautiful wife Amanda Jama
And our son Iminathi Jama
Cape Peninsula University of Technology
VBandile Jama
CONTENT
ABSTRACT ... I ACKNOWLEDGEMENT ... III DEDICATION... IV CONTENT ... V LIST OF FIGURES ... VIII LIST OF TABLES ... XI GLOSSARY ... XIICHAPTER 1: INTRODUCTION ... 1
1.1 Infrared Thermography ... 1
1.2 Internal Leaks ... 2
1.3 Non-Destructive Evaluation of Plant’s Components ... 6
1.4 Main Objectives ... 8
1.5 Organisation of the Project ... 8
CHAPTER 2: LITERATURE REVIEW ... 9
2.1 Infrared Thermography ... 9
2.2 Passive Thermography ... 11
2.2.1 Internal Leak Inspection Passive thermography ... 12
2.3 Active Thermography ... 12
2.3.1 Pulsed Thermography ... 12
2.3.2 Long Pulse Thermography ... 14
2.3.3 Induction Thermography ... 15
2.3.4 Lock-in Thermography ... 16
2.3.5 Ultrasound Thermography ... 18
2.3.6 Post Processing Methods ... 19
2.4 Conventional NDT Techniques ... 19
2.4.1 Magnetic Particle Inspection ... 19
Cape Peninsula University of Technology
VIBandile Jama
2.4.3 Ultrasound Testing ... 22
CHAPTER 3: EXPERIMENTAL METHODOLOGY... 24
3.1 Introduction ... 24
3.2 Internal Leak Detection Methodology ... 25
3.2.1 Experimental Procedure with the Model ... 26
3.2.2 Laboratory (Model’s) Experimental Results ... 27
3.2.3 Leak detection across Isolation Valves in the Power Plant ... 28
3.2.4 Results of Internal Leaks through Isolation Valves ... 29
3.2.5 Leak detection across Safety Valves ... 30
3.2.6 Results of Internal Leaks through Safety Valves ... 31
3.3 Pulse Thermography ... 32
3.3.1 Experimental Procedure of Pulse Thermography ... 34
3.3.2 Experimental Results ... 34
3.3.3 Ultrasonic Testing ... 36
3.3.4 Experimental Procedure of Ultrasound Test ... 36
3.3.5 Ultrasound Testing Results ... 38
3.4 Induction Thermography Methodology ... 41
3.4.1 Research Methodology ... 43
3.4.2 Experimental Results ... 44
3.4.3 Magnetic Particle Testing Methodology ... 46
3.4.4 Results of Magnetic Particle Inspection... 46
3.4.5 Dye Penetration Inspection ... 47
3.4.6 Results of Dye Particle Inspection ... 48
CHAPTER 4: DISCUSSION AND CONCLUSIONS... 50
4.1 Introduction ... 50
4.2 Internal Leak Inspection ... 50
4.3 Pulse Thermography ... 50
Cape Peninsula University of Technology
VIIBandile Jama
4.5 Dye Penetrant Inspection ... 52
4.6 Ultrasound Testing ... 52
4.6.1 Comparison between Pulse thermography and Ultrasound Testing ... 52
4.7 Induction Thermography ... 53
4.7.1 Comparison between Induction Thermography and MPI ... 53
4.7.2 Comparison between Induction Thermography and DPI ... 54
4.8 Conclusion ... 54
4.8.1 Future Work ... 55
APPENDICES... 56
Appendix A. Infrared Camera ... 56
Appendix B. Dimensions and material used to manufacture the FHS ... 57
Appendix C. Procedure to measure the emissivity ... 58
Appendix D. Calibration of Kraukramer UT machine using V1 block ... 59
Appendix F. Induction Thermography Comparison Images ... 60
Cape Peninsula University of Technology
VIIIBandile Jama
LIST OF FIGURES
Figure 1-1. Effects of internal leaks ... 2
Figure 1-2. Typical schematic diagram of a Pipe network with isolation ... 3
Figure 1-3. Plant configuration of parallel isolation valves ... 4
Figure 1-4. Plant configuration of safety valves and discharge pipes ... 5
Figure 1-5. Schematic diagram of the Pressure relief ... 5
Figure 1-6. Wheel hub results, thermography results on the left, ... 7
Figure 2-1. Plankian Curves for blackbody emissions at various temperatures, ... 10
Figure 2-2. An in-service pump coupled to its motor (normal image) ... 11
Figure 2-3. Thermal profile of the in-service pump shown in figure 2.2 ... 11
Figure 2-4. Pulse thermography set up ... 13
Figure 2-5. Trapped heat flows around the defect ... 14
Figure 2-6. Induction heating Thermography principle ... 15
Figure 2-7. Penetration depth vs Frequency for 304L Stainless steel ... 16
Figure 2-8. Typical setup for lock-in thermography ... 17
Figure 2-9 Ultrasound Thermography set-up ... 18
Figure 2-10. Demonstration of MPI during inspection ... 20
Figure 2-11. Indication of defect using DPI ... 21
Figure 2-12. Ultrasound testing principle ... 23
Figure 3-1. FLIR T640 Infrared Camera ... 24
Figure 3-2. Set up of internal leak inspection using IRT ... 25
Figure 3-3. Fluid handling system mounted onwooden plinth ... 26
Figure 3-4. Fluid handling model with valve A cracked open ... 27
Figure 3-5. Thermal image of model’s pipe network before experiment ... 27
Figure 3-6. Demonstration of system without internal leaks... 28
Cape Peninsula University of Technology
IXBandile Jama
Figure 3-8. Drain system without internal leaks ... 29
Figure 3-9. Drain system A with internal leak ... 29
Figure 3-10. Drain system B with double isolation leaking ... 30
Figure 3-11. Drain system B with internal leak ... 30
Figure 3-12. Discharge pipe A results ... 31
Figure 3-13. Discharge pipe B results ... 31
Figure 3-14. Discharge pipe C results ... 32
Figure 3-15. Schematic of the experimental setup of pulse thermography ... 33
Figure 3-16. Geometry of the test specimen (units in mm) ... 33
Figure 3-17. Illustration of equipment used during pulse thermography ... 34
Figure 3-18. Rear view of the specimen with machined defects ... 35
Figure 3-19. PVC specimen’s results ... 35
Figure 3-20. Stainless Steel specimen’s results ... 35
Figure 3-21. Mild steel specimen’s results ... 35
Figure 3-22. Ultrasound inspection set-up ... 36
Figure 3-23. Alphabetic Identification of FBH in figure 3-16 ... 37
Figure 3-24. Calibrated Kraukramer Machine ... 37
Figure 3-25. Echo of the PVC specimen’s subsurface defects ... 38
Figure 3-26. Echo of the Stainless steel specimen’s subsurface defects ... 39
Figure 3-27. Echo of the Mild steel specimen’s subsurface defects... 40
Figure 3-28. Schematic diagram of Induction Thermography ... 41
Figure 3-29. Typical 304L stainless steel test piece ... 42
Figure 3-30. Turbine’s stud specimen ... 42
Figure 3-31. CV-joint ... 42
Figure 3-32. Coil used for CV-joint inspection ... 43
Figure 3-33. Typical experimental setup for Induction Thermography ... 44
Figure 3-34. 304L stainless steel after excitation ... 45
Cape Peninsula University of Technology
XBandile Jama
Figure 3-36. Results of CV-joint after excitation ... 45
Figure 3-37. Experimental set-up of MPI with the turbine’s stud ... 46
Figure 3-38. Turbine stud specimen ... 47
Figure 3-39. CV-joint from service ... 47
Figure 3-40. DPI results from the 304L stainless steel test piece ... 48
Figure 3-41. DPI results from the HP-turbine’s stud specimen ... 48
Figure 3-42. DPI results from the CV-joint ... 49
Figure B-1. Dimensions of the model system...51
Figure F-1. 304L Stainless Steel Comparison Results...60
Figure F-2. M80 HP Turbine Stud Comparison Results...61
Cape Peninsula University of Technology
XIBandile Jama
LIST OF TABLES
Table 3-1. PVC specimen’s Ultrasound results ... 38
Table 3-2. Stainless steel specimen’s Ultrasound results ... 39
Table 3-3. Mild steel specimen’s Ultrasound testing ... 40
Table 4-1. Material properties of the specimens used in this study ... 51
Table A-1. Infrared Camera Specifications ... 56
Cape Peninsula University of Technology
XIIBandile Jama
GLOSSARY
Abbreviations
Definition
AC Alternating Current
AEP American Electric Power
CV-joint Constant Velocity Joint
DC Direct Current
DPI Dye Penetration Inspection
FBH Flat Bottom Hole
FHS Fluid Handling System
HP turbine High Pressure Turbine
IR Infrared Radiation
IRT Infrared Thermography
MIN Minute (s)
MPI Magnetic Particle Inspection
NDE Non Destructive Evaluation
NDT Non Destructive Testing
PTFE Polytetrafluoroethylene
PVC Polyvinyl Chloride
SCB Standard Calibration Block
SCC Stress Corrosion Cracking
UT Ultrasound Testing
VT Visual Inspection
WCP White Contrast Powder
Variables
obj
T Object absolute temperature...|0C|
obj
Q Electromagnetic energy released by an object...|J| blackbodyj
Q Electromagnetic energy released by blackbody... |J| T Temperature... |0C| k Thermal conductivity... | 1 1 . K Wm |
Cape Peninsula University of Technology
XIIIBandile Jama
t
Time... |s
|e
Thermal effusivity... | 12 2 1 .m K Ws | pc
Specific heat... | 1 1 . K Jkg | 0T
Initial temperature... |0C| C T Thermal contrast... |K| d diameter of flat bottom hole... |m
| D Depth of flat bottom hole... |m
| f Frequency... |Hz|J
Current density... | 2.m A | E Electric field intensity... | 1
.C N | Greek letters obj
Emissivity... |
|
Penetration depth... |m
|
Stefan Boltzmann... | 2 .m W |
Angle... | 0|
Density... | 3.
m
kg
|
Permeability... | 1 .m Hz |
Thermal diffusivity... | 2 1 .s m |
Wavelength... |m
|Cape Peninsula University of Technology
1Bandile Jama
CHAPTER 1:
INTRODUCTION
1.1 Infrared Thermography
Infrared thermography (IRT) is considered to be a useful non-contacting non-destructive tool that has not yet met its full potential as a non-destructive testing (NDT) technique in the mechanical maintenance arena. Unlike the current situation in electrical engineering where IRT is extensively used to monitor and find faulty termination in high power electric circuits, identify problems in electric switchgear and locate overloaded circuit breakers in a power panel [1]. In mechanical maintenance, the IRT technique is mainly used for condition monitoring of rotating equipment such as the degradation of bearings and excessive friction on sliding surfaces such as belts and pulleys, clutches and brake slippage [2].
IRT is a technique used to capture and process thermal information from equipment that radiates electromagnetic energy [2]. It is a technique that processes the invisible thermal profile of any object to visible thermal images. This technique applies to all objects that have the temperature above absolute zero degrees, Kelvin, since these objects emit electromagnetic radiation energy [3].
In non-destructive evaluation (NDE), IRT is divided into two categories, as passive and active thermography [2, 3 and 4]. Passive thermography is based on the acquisition of thermography images of the object under study without external heat supply [2, 5 and 6]. In some cases, the heating is caused by the radiation from the sun, moving machinery, endothermic or exothermic process etc., [2, 5, 7]. Active thermography is based on the use of an external energy source that enables the flow of heat waves in the material [3, 5]. The energy (not always heat) source varies according to the technique employed [2, 7]. So far the techniques employed are pulsed laser and flash lamps, mechanical vibrations, induction heater, acoustic wave excitation and microwaves [5, 8]. Infrared thermography provides the following advantages.
Fast inspection compared to magnetic particle inspection (MPI), Dye Penetration Inspection (DPI) and Visual Testing (VT) [5].
Non-contact [5].
Hygienic; not harmful to the environment [6].
Results that are easy to interpret compared to MPI, DPI, and VT [6].
Cape Peninsula University of Technology
2Bandile Jama
Possible measurements in inaccessible and hazardous areas [9].
With the advantages mentioned above, it is of interest to find out where in the mechanical maintenance arena, IRT can be employed effectively. This study evaluates the effectiveness of IRT to enhance and alleviate the difficulty in detecting internal leaks through isolation valves. The study also explores the use and the effectiveness of infrared thermography as an alternative to the traditional NDT techniques, such as MPI, DPI and VT, and the conventional NDT technique of Ultrasound Testing (UT).
1.2 Internal Leaks
Internal leaks occur in a pipeline system due to a failure of internal barrier components such as isolation valves, steam traps, safety valves and heat exchanger tubes. These leaks cannot be observed by the naked eye; only their symptoms can be noticed, particularly when there are many such components in a system, then it becomes difficult to pinpoint the root cause of an internal leak. In principle, under normal circumstances, the high-pressure system will leak through to a low-pressure system and disturb the operation and design parameters of the system, which can lead to plant anomalies. Figure 1.1 illustrates the effects of internal leaks.
Internal Leaks Environmental Effects Increase in cost Disrupt design parameters Loss of Production Human Safety
Cape Peninsula University of Technology
3Bandile Jama
In a plant, the disruption of design parameters such as pressures, temperatures, and contamination from foreign substances can cause loss of production and compromise human and environmental safety. The increase in cost due to internal leaks includes expenses in detecting the internal leaks, the recovery strategies to restore the plant to its original state and maintenance of in-service components. Environmental mishaps include the contamination of natural resources such as drinking water, seawater, and soil.The early detection of any leaks internal or external, whether it is steam, water, oil, air or gases, is very important for early decisions to be made to prevent loss of inventory in the system, which can lead to the deterioration of a system’s performance, safety can be compromised and complicate its maintenance [10 and 11]. These leaks need to be detected and resolved as soon as possible. Thus a technique is required to detect internal leaks before catastrophic events occur. In this study, internal leak detection from isolation valves and safety valves will be attempted/performed using Infrared Thermography. The failure of isolation valves and safety valve to perform its desired function can lead to internal leaks, which can be highly expensive to resolve. Usually, the leak is due to the valve not being closed properly, i.e. the valve seat is not square with the plug, erosion of the seat or plug material, wear on the valve seat, valve seized etc.
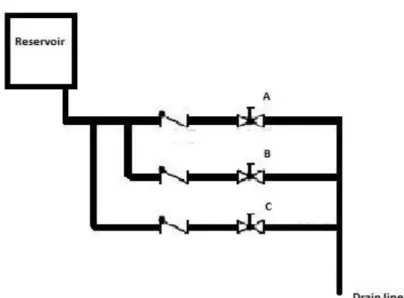
Figure 1-2. Typical schematic diagram of a Pipe network with isolation valves connected in parallel
The main concern in this study is a scenario where valves are connected in parallel pipes (as indicated in Figure 1-2) draining to a common drain header. It becomes difficult to identify which of the valves is leaking when the medium/fluid is observed at the common
Cape Peninsula University of Technology
4Bandile Jama
drain header (drain line) [12]. In a situation like this, hours are spent trying to determine the source of the problem. In this study the use of IRT as a diagnostic inspection tool for the detection of internal leaks will be investigated. The passive thermography technique will be used to detect internal leaks through the isolation valves and safety valves, where the system’s temperature is the main variable that has to be monitored.The concern mentioned previously was observed on a drain recovery system of a power plant. Where the leak was observed on the main drain line but it could not be determined which of the valves was leaking. Figure 1-3 illustrates a typical system with valves connected in parallel, draining to a common recovery receiver. During operation, the valves are supposed to be closed therefore condensed steam is not expected on the main drain line. However, in this scenario, condensed steam was observed on the main drain line, and that is an indication of leaking valve(s). It becomes difficult to pinpoint the leaking valve and opening the drain receiver hatch poses a risk of burns to the operator/investigator.
Figure 1-3. Plant configuration of parallel isolation valves
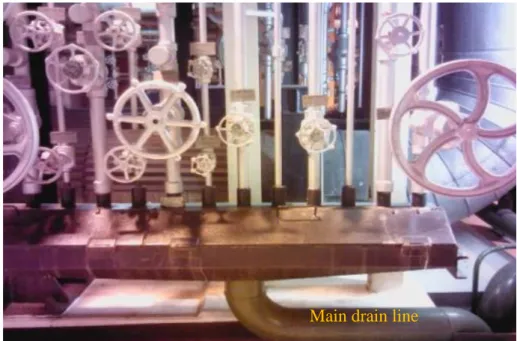
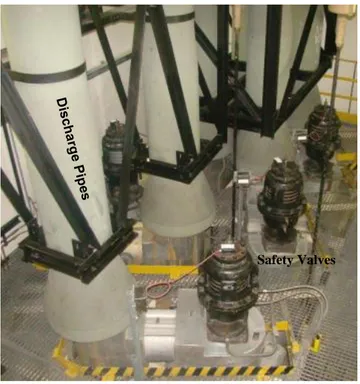
During the performance test on the main steam line of a power plant, ‘leaking" steam was observed on the exhaust manifold silencer, (see schematic diagram in Figure 1-5). In this scenario, it was difficult to identify which of the safety valves were leaking when steam was observed on the manifold because they all discharged to a common manifold. Figure 1-4 illustrates the safety valves and discharge pipes to the manifold.
Cape Peninsula University of Technology 5 Bandile Jama
Figure 1-4. Plant configuration of safety valves and discharge pipes
Figure 1-5. Schematic diagram of the Pressure relief system of the main steam line
Safety Valves
Exhaust manifold
A B C
Main Steam line
Discharge lines
10.5m
Inlet Pipes Safety Valves
Cape Peninsula University of Technology 6 Bandile Jama The methods suitable that industries use to detect leaks through leaking process valves, steam traps, and safety valves are Ultrasound and Acoustic test. These techniques are attempted to pinpoint the leaking component [10 and 11]. The ultrasonic wave which is caused by the leaking fluid can be detected by special equipment. However, the use of such equipment is limited due to the environment (background noise) and the orientation of the valves, Acoustic testing is used when it is difficult to use IRT especially on the line that carries fluids at ambient temperature.
For both scenarios of leaking valves (as described above) a technique is required to identify the faulty one(s) without interrupting the operations of the plant, thus affecting its production and compromising human and environmental safety. As mentioned by Sulaiman [13], with IRT costs are reduced, process interruption can be planned to avoid unexpected loss of production, and harmful effects on the environment may be reduced.
1.3 Non-Destructive Evaluation of Plant’s Components
The conventional NDT techniques (MPI, DPI, VT, and UT), mentioned previously are used for the inspection of surface and subsurface defects on valve stems, pipe surfaces, vessels, tanks, composite material and other mechanical equipment. These techniques are used effectively and entrusted by industries to inspect metallic components [6]. However, in this study aspects of Infrared thermography (Pulse Thermography and Induction Thermography) will be evaluated as an alternative or an additional NDT technique to the conventional ones, for the detection of defects on some of the above-mentioned plant's components. This study will compare infrared thermography with conventional NDT techniques. Induction excited thermography will be compared with MPI and DPI for the detection of surface defects, and pulse thermography will be compared with UT for the detection of subsurface defects.
Suhas [14] performed a study considering the comparison between pulse thermography and ultrasound testing on 3mm steel plates bonded structures with silicone rubber layer in between. The study considered IRT to have an advantage over UT inspection in terms of quickly detecting the defect (artificial induced delamination) between the steel plate. However, regarding the sizing of the defects IRT is not recommended to perform this operation. The results obtained from the UT testing were informatively accurate in terms of defect sizes and location, however in comparison very time-consuming in locating the defects.
Xingwang et al [15] used IRT and UT to detect cracks on aluminum parts. The UT technique was used as an excitation source while the infrared camera monitored the temperature profiles of the aluminum parts. The combination of the two techniques is known as
Cape Peninsula University of Technology 7 Bandile Jama Ultrasound - excited infrared thermography. Their results indicated that the technique can effectively detect closed cracks/defects that have been previously considered undetectable by traditional NDT techniques.
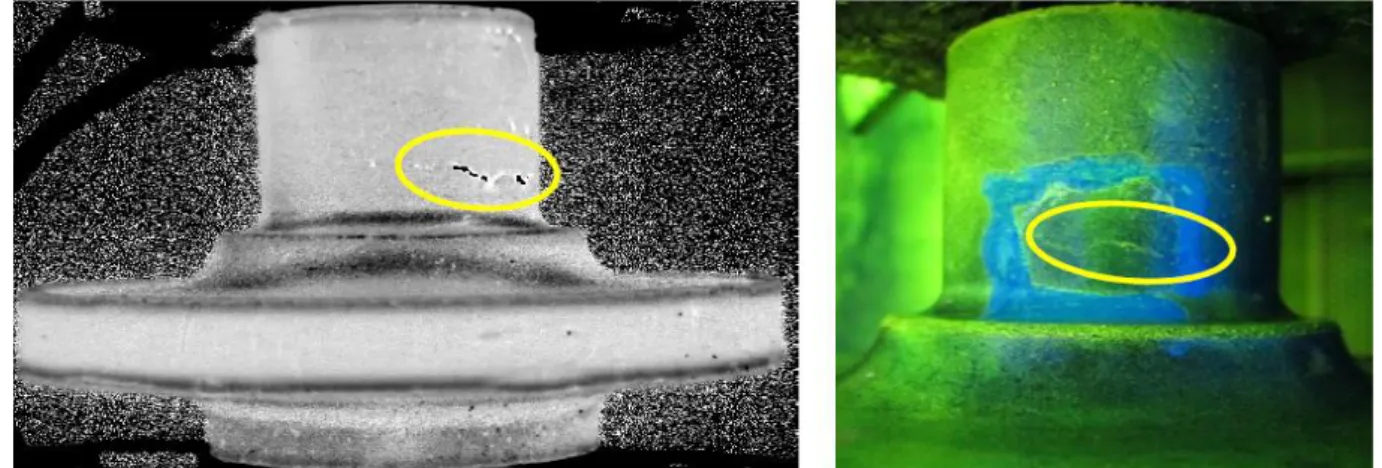
Patrick et al [16] conducted a study determining the capability of induction stimulated infrared thermography for non-destructive testing of forged parts. The comparison was conducted between Induction Thermography and Magnetic Particle Inspection on a batch of 26 cracked wheel hubs. This study was to introduce induction thermography as an alternative NDT technique to MPI. The results indicated that Induction thermography provides better results than MPI, is a quick and environmentally friendly technique.Figure 1-6 illustrate the results obtained during wheel hub inspection.
Figure 1-6. Wheel hub results, thermography results on the left, and MPI results on the right
(Adopted from Patrick et al [16])
Patrick et al [16] also compared the NDT technique of IRT using induction thermography, and the traditional dye penetration inspection, on artificial hip joint manufactured from titanium, austenitic and cobalt-based alloy. The results indicated that induction excitation IRT revealed more details of the defects compared to the dye penetration inspection. The results also revealed that induction heating IRT is well suitable for ferromagnetic material, but less efficient on titanium, stainless steel, and cobalt-based alloys because of low thermal conductivity.
Cape Peninsula University of Technology 8 Bandile Jama
1.4 Main Objectives
The main objective of this study is to investigate aspects of infrared thermography for non-destructive testing in the mechanical maintenance arena. The intention is to compare the effectiveness of detecting defects using infrared thermography with those achieved using traditional/current NDT techniques in the mechanical maintenance areas of interest in a power plant.
1.5 Organisation of the Project
This dissertation contains four chapters and four appendices. Chapter 1 is an introduction to the subject covered in this study. Chapter 2 is a literature review, where the fundamental principle of infrared thermography and the two modes of IRT active and passive thermography are presented. Chapter 3 provides the results obtained from the various experiments. It also provides the results obtained from the traditional NDT techniques of UT, MPI, and DPI. Chapter 4 is the discussion and conclusions of the results obtained.
Cape Peninsula University of Technology 9 Bandile Jama
CHAPTER 2:
LITERATURE REVIEW
2.1 Infrared Thermography
Infrared Thermography (IRT) is a technique used to capture and process thermal information from equipment that radiates electromagnetic energy [2, 17]. It is a technique that processes the invisible thermal profile of any object to visible thermal images. This technique applies to all objects that have a temperature above absolute zero-degree temperature, since these objects emit electromagnetic radiation energy [3]. The electromagnetic radiation energy is directly proportional to the surface temperature and the emissivity of an object. The emissivity is defined as the ability of an object to emit infrared energy [5]. Since the energy emitted by the object is not visible to the naked eye an infrared camera is used to capture and process the thermal information to visual thermal images.
Infrared radiation (IR) energy is in the form of rays and it falls within the range of 0.75μm to 100μm (wavelength) of the electromagnetic spectrum [2, 17]. Equation 1 defines the electromagnetic energy emitted by any object and received by the camera as the product of emissivity of an object (
obj), Stefan-Boltzmann constant ( 8 2 4.
.
10
670
.
5
W
m
K
) andthe fourth power of the object’s absolute temperature (Tobj), assuming no absorption loss by the medium separating the emitter and camera [2].
Qobj
obj
Tobj 4 (1) From equation 1 the emissivity of the object can be calculated by finding the quotient of the energy emitted by the body to the maximum energy that could be emitted by a ‘blackbody’ at the same temperature, (see Equation 2).blackbody obj obj
Q
Q
(2)Whereas the energy emitted by the blackbody can be calculated using Planck's Law, (see Equation 3) where the power emitted is per unit area and per unit wavelength [15, 16]. C1 and C2are constants,
is the wavelength and T isbody’s absolute temperature.1
2 5 1
T C be
C
Q
(3)Cape Peninsula University of Technology 10 Bandile Jama Figure 2-1 illustrates the distribution of the electromagnetic radiation energy emitted by a blackbody at different temperatures. It shows the amount of energy emitted at each wavelength. Norman [17] stated that as the temperature increases the amount of the electromagnetic radiation emitted at each wavelength also increases.
Figure 2-1. Plankian Curves for blackbody emissions at various temperatures, (Adopted from Ruben et al [2])
IRT being a non-contact non-destructive evaluation (NDE) method; measures the electromagnetic energy emitted from a component using an infrared camera (defined as a spectral radiometer). The camera measures the energy emitted from the component’s surface and distributes it accordingly to degrees of surface temperature, which gets displayed in the form of thermal images [15, 16, and 17]. IRT is used effectively in either passive or active mode in the medical field, electrical and mechanical equipment, fluid systems, building applications, condition monitoring and in non-destructive evaluation [2, 7].
Cape Peninsula University of Technology 11 Bandile Jama
2.2 Passive Thermography
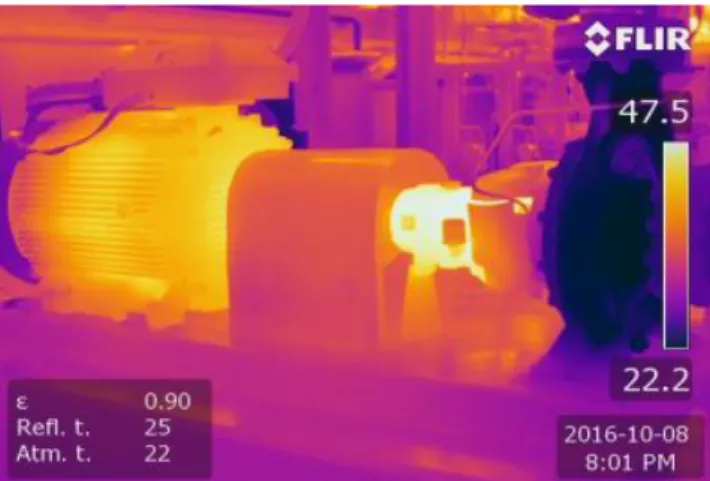
Passive thermography is based on the acquisition of images of the object under study without external heat supply, the temperature induced is natural. In some cases, the heating is caused by the radiation from the sun, moving machinery, running plant, friction, endothermic or exothermic process, fission process etc. [2, 5]. The technique is used in quality control and condition monitoring applications because temperature plays a crucial role in many industrial processes [2]. Figures 2-2 and 2-3 is a typical example of a passive thermography technique, where a running motor emits electromagnetic energy without external source applied. The energy is due to moving parts such as bearings (friction), the rotor of the motor, and electric current resistance.
Figure 2-2. An in-service pump coupled to its motor (normal image)
Cape Peninsula University of Technology 12 Bandile Jama
2.2.1 Internal Leak Inspection Passive thermography
For this study, passive thermography will be used as a diagnostic tool to detect internal leaks through isolation and safety valves. It is expected that this technique will be successful by comparing the thermal images of the pipes upstream and downstream of a leaking valve. The change of the temperature of the pipe's surface downstream of a valve will depend on the amount of energy released by the leaking fluid, provided that the fluid's temperature exceeds the environment's level.
2.3 Active Thermography
Active thermography is based on the use of an external energy source that enables the temperature change in the material. According to Rodrigues et al [4], the application of active thermography to detect defects in materials began in the decade from 1960 to 1970. "That was when electronics and optics systems in the infrared band started to be employed in aerospace and nuclear engineering". However, the poor operational characteristics of infrared systems in those years caused the development of this NDT technique to be delayed. Aerospace industries use various forms of active thermography to detect, for example, the delamination of composite materials. The thermal excitation source varies according to the particular IRT technique in the following list
Pulsed thermography
Long pulsed thermography
Lock-in thermography
Induction thermography
Mechanical vibration thermography
However, this study will consider two types of active thermography techniques; Pulse thermography and induction thermography, and give a brief discussion about other active thermography techniques.
2.3.1 Pulsed Thermography
Pulsed thermography is an active thermography non-contacting non-destructive testing (NDT) technique used to detect subsurface defects in monolithic materials and delamination in composites [2, 5 and 19]. In principle, a specified quantity of energy in the form of heat
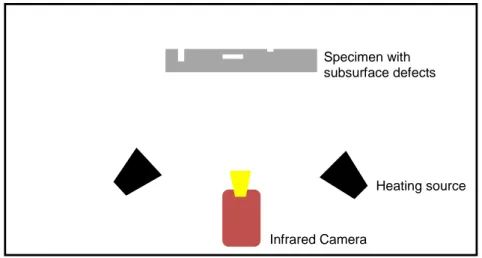
Cape Peninsula University of Technology 13 Bandile Jama pulse is applied to an object for a fraction of a second while using an infrared camera to monitor the temperature decay curve of the surface as the heat travels through the material [20, 21 and 22]. Figure 2-4 is a typical setup of pulse thermography.
Figure 2-4. Pulse thermography set up
The heat source for pulse thermography can be flash lamps, halogen lights, heating gun, hair dryer and laser beams. It is fast in inspection and is easy to operate. The drawback of the technique is that; the non-uniform application of heat and variation of surface emissivity might affect the results [22].
According to Sheregii [23], the heat propagation through the thickness of the specimen after excitation can be explained by a one-dimension solution of the Fourier's law. The time depended on surface temperature response to heat pulsation is given by equation 4 [22, 23].
12 0t
e
Q
T
t
T
(4)where, Q (J) is energy absorbed by the surface of the test pieces,
T
0(0C) is the initial temperature,t
is the time (the rate of heat propagation) in seconds,e
(W.s12.m2.K1) is the material’s effusivity which is defined by [20 and 23] as an ability of the material to exchange heat with the surrounding. Francisco et al, [20] mention that the effusivity of a material can be expressed by equation 5.
12 p c ke (5)
In equation 5, k (Wm1K1) is the thermal conductivity of the material,
(kg.m3) is the density and cp (Jkg1K1) is its specific heat [13].Infrared Camera
Heating source Specimen with
Cape Peninsula University of Technology 14 Bandile Jama According to Almond et al [24], equation 5 could be modified to equation 6 specifically to simulate thermal response(contrast) of materials with circular subsurface defects.
t D n t nd p C e e kt c Q t T
4 2 1 0 2 2 1 2 (6)where Q0 (J) is the initial heat energy applied on the surface of the specimen, d (mm) is the depth of the defect, D (mm) is the size of the defect, t is the response time in second and
(m2.s1) is the thermal diffusivity that measures the material's ability to conduct heat in relation to its capacity to store it [20 and 23]. Thermal diffusivity is defined as an indicator that can be used to check how quickly a material will change the temperature in response to the application of heat Wrobel at al [25]. Thermal diffusion is a thermo-physical property that is directly proportional to thermal conductivity and inversely proportional to material density and specific heat (see Equation 7).p
c
k
(7)According to Grzegorz [26], hot spots in areas over flat bottom holes (FBH) (subsurface defect) are observed as an indication of a high concentration of heat trapped between the surface and subsurface defect (see Figure 2-5).
Figure 2-5. Trapped heat flows around the defect (Adopted from Grzegorz Stanislaw Ptaszek [26])
2.3.2 Long Pulse Thermography
Long Pulse Thermography also known as Square Pulse Thermography which is defined as Pulse Thermography with relative long heating excitation period, typically at least a couple of seconds of heating compared to the traditional Pulse Thermography [19 and 30]. The
Cape Peninsula University of Technology 15 Bandile Jama technique was introduced to extend the Pulse Thermography analysis of results. Long Pulsed Thermography is suitable for materials that required long pulsation such as buildings, plastics and thick composites [19]. It can also be used to detect subsurface defects such as cracks, delamination, impact damage and moisture ingress or content in the aerospace and aircraft industries [30]. Generally, the technique can be processed to improve defect visibility and perform qualitative studies of defects.
2.3.3 Induction Thermography
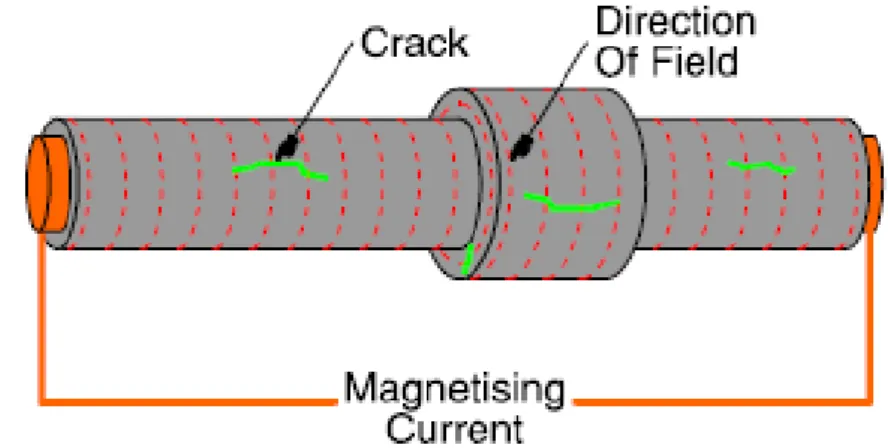
Induction Thermography has been in use since the 1970's to test steel bars in roll mills for cracks [27]. The fundamental concept of this method is that an alternating current is induced in an electrically conducting material by a charged coil or electric wire placed near the inspection surface. An induced current will flow in the opposite direction to the coil and wire current. Any crack on the specimen will disturb the induced current flow and cause it to flow around the crack [27 and 28]. Thus heat will be generated due to a high concentration of current density on the crack tip, (see Figure 2-6).
Figure 2-6. Induction heating Thermography principle (Adopted from Vrana et al [27])
The induced current in a specimen flows to a certain depth from the surface; this is governed by the well-known skin effect. Vrana et al [27], say it depends on the frequency of excitation, electric conductivity and magnetic permeability of the material. Figure 2-7 shows the relationship between frequency and skin depth measured on a 304L stainless steel specimen. As stipulated by the graph and equation 8, the penetration depth increases as the frequency reduces.
f
1
(8)Cape Peninsula University of Technology 16 Bandile Jama
Figure 2-7. Penetration depth vs Frequency for 304L Stainless steel
The penetration depth of the induced current,
(m) is given by equation 1,f
is an excitation frequency (Hz),
is the electrical conductivity (S/m), and
is the permeability (Hz/m) of the material. When the excitation frequency induced in 304L stainless steel is 50Hz the theoretical penetration depth will be0.00238mm.The material under test gets heated by its resistance to the induced current flow. The heat generated is inversely proportional to the electric conductivity and proportional to the square of the magnitude of the electric current’s density [29]. The heat emitted (hot-sport) by the test piece can be formulated as shown by equation 9.
2 2
1
1
E
J
Q
s
(9)Where
the electric conductivity is (S/m), Js is the current density ( 2/m
A ) or electric field intensity
E
(N/C). As mentioned previously, the presence of any defect in a material will restrict the induced flow which can result in a localized high current density and hence a localized increased heat generation. The localized heat generated will affect the surface’s thermal profile which is being monitored by the infrared camera.2.3.4 Lock-in Thermography
In Lock-in Thermography the surface of the specimen is periodically illuminated by sine modulated energy which is converted to sine modulated heat [21 and 22]. The periodic wave propagates by radiation through the air to the surface of the specimen, where heat is produced and propagate through the material by conduction. In some cases, halogen lamps
0 0.01 0.02 0.03 0.04 0.05 0.06 0.07 0 10 20 30 40 50 60 70 80 90 100 110 Sk in De p th ( m m ) Frequency (Hz) 0.0238mm
Cape Peninsula University of Technology 17 Bandile Jama are used as an exciting source to inject thermal waves into the specimen [5 and 22]. Figure 2-8 illustrates a typical setup of lock-in thermography. This technique is recommended for the detection of subsurface defects. It gives good information about defect size, depth and thermal resistance [21]. During excitation, the defects inside the specimen act as a barrier and prevent thermal waves from propagating homogeneously. Larbi et al [22], states that the defects cause a change in amplitude and phase delay to the response signal returning to the surface, then an Infrared camera is used to record the temperature change on the surface of the specimen. Figure illustrate the Lock-in thermography set-up.
Figure 2-8. Typical setup for lock-in thermography
(Adopted from Larbi et al [22])
According to Larbi et al [22], Fourier's analysis is the preferred processing technique to extract the amplitude and phase information of the surface of the material since it provides single image, ampligrams / phasegrams. Equation 10 demonstrate the Fourier's law one dimensional solution for a periodic thermal wave propagating through a semi-infinite homogeneous material.
T
z
z
t
t
z
T
2
cos
exp
,
0 10where T0(0
C
) is the initial temperature produced by heat source, z(m
)
(rad
/
s
) is the modulation frequency which can be expressed as (
2
f , with f being a frequency in Hz),
(m
) is the wavelength, and
(m
) is diffusion length given by (
2
). TheCape Peninsula University of Technology 18 Bandile Jama increase in frequency will improve the Lock in Thermography in revealing the subsurface defects, however, the maximum depth of a defect is limited by the equipment's range of selectable frequencies. According to Ruben et al [2] and Xavier [5], the solution to this problem is Ultrasound Lock-In Thermography by selectively stimulating defective areas with acoustic waves.
2.3.5 Ultrasound Thermography
Ultrasound thermography also known as vibrothermography is a mechanical excitation active thermography technique that is used to detect closed crack in metals and ceramic as well as delamination and disbands in composites material [5, 15]. This technique has been proven to be a promising NDT tool for the detection of defects. Below is the typical set up of Ultrasound Thermography.
Figure 2-9 Ultrasound Thermography set-up (Adopted from Xingwang et al [15])
In principle, the mechanical vibrations with frequency ranging from
5
10
kHz
induced by an ultrasonic generator in a specimen travel through the test piece homogenously causing the specimen to vibrate in unison. Where there is a crack or delamination, the two defect faces will not move in unison. Then the friction movement between the two faces will convert vibration energy to thermal energy [5]. The heat generated between the two surfaces will propagate by conduction through the material to the outer surface. An infrared camera is used to monitor the change in the temperature of the surface. The detection of the defect is influenced by increasing or decreasing the mechanical excitation frequency.Cape Peninsula University of Technology 19 Bandile Jama
2.3.6 Post Processing Methods
According to Ruben el at [2], with active thermography techniques, some defects are small and cannot be observed easily, thus the signal levels associated with them can be lost in the thermographic data noise. Therefore, in such a case different post-processing methods can be used to improve the signal-to-noise (SNR) content of the thermographic data. Post processing methods include statistic moment, principle components analysis, dynamic thermal tomography, polynomial fit and derivatives [2].
The aspect of characterising the defects that have been detected, has been the incentive of rigorous research in recent past, which resulted in specific techniques of thermal excitation, and the recording of the resulting time dependent thermal contrasts, the phase shift created by the modulated heating frequency etc. The nature of these technique requires expensive equipment and lengthy computation processes. Even though the review of these techniques assisted in concluding that considerable progress has been achieved both in terms of detectability and characterization of the defects, however there are still disadvantages in terms of accuracy, process time and expense. Thus for the purpose of this study post processing methods will not be employed. Images will be modified/enhanced by using Microsoft Format Picture.
2.4 Conventional NDT Techniques
There are established long standing, known as conventional, non-destructive testing techniques that are commonly used by industries to inspect for surface and subsurface defects in metallic materials [6]. These techniques are used to inspect high-pressure and high-temperature processing pipes, pressure vessels, rotating shafts, valve stems, gears and other mechanical components [6, 31]. The methodologies of the techniques are not the same, each technique is unique [31]. The application varies depending on the surface to be inspected, the type of material and location. The following section describes the conventional NDT techniques commonly used in industry with details of particular application, function, advantages and disadvantages.
2.4.1 Magnetic Particle Inspection
Magnetic particle inspection (MPI) is a contacting non-destructive technique that is used to inspect the ferromagnetic material. This technique is capable of detecting defects open from the surface and just below the surface [32 and 33]. According to Luk et al [33], MPI is a combination of two NDT techniques: magnetic flux leakage testing and visual inspection.
Cape Peninsula University of Technology 20 Bandile Jama The fundamental principle of MPI is as follows; the test piece is magnetized by using a permanent or an electromagnet through the surface of the specimen. The magnetic field induced to the specimen is composed of magnetic force lines flowing from South to the North Pole. Any surface defect on the material will disturb the flow of magnetic lines and caused the lines to exit and re-enter the specimen The exit and re-entry of the magnetic force cause the crack edges to become magnetic poles North and South which have the power to attract finely particles of iron fillings. The collection of iron fillings around the defect is an indication of the presence of a defect [33 and 34]. Figure 2-9 illustrates the working principle of MPI.
Figure 2-10. Demonstration of MPI during inspection (Adopted from Willcox et al 34)
Advantages of Magnetic Particle Inspection
Simple to operate
The technique is not expensive
It is rapid/quick to perform
It is aportable NDT method
Cape Peninsula University of Technology 21 Bandile Jama
Disadvantages of Magnetic Particle Inspection
The piece to be tested must be of ferromagnetic materials
Limited to the surface and near surface defects.
The magnetic force line must be at a right angle (perpendicular) to the defect.
Demagnetization following inspection is necessary.
Inspection of large surfaces requires high current. 2.4.2 Dye Penetration Inspection
Dye penetration inspection (DPI) also known as liquid penetrant inspection (LPI) is a non-destructive technique that is used to inspect surface defects using colour dye [32, 34 and 35]. According to Sharon et al [36], the test was developed in 1940's to detect flaws on the surface of the material. The technique is very effective in detecting defects that are open to the surface. It can be used successfully on nonporous and smooth surfaces such as metals, glass, plastic and ceramics [35]. It is widely used to inspect manufactured products, castings, forgings and welded parts. Figure 2-10 illustrate a typical DPI results indicating an existing of a defect close to the weld.
Figure 2-11. Indication of defect using DPI (Adopted from Luk et al 33)
Cape Peninsula University of Technology 22 Bandile Jama In principle, a liquid is applied to the surface to be inspected for a period of time. The time is to allow the penetrant to find access through the cracks/defects. After sufficient time has elapsed the excess penetrant on the surface of the specimen is cleaned and dried and a developer is applied to the surface being inspected. The remnants of the penetrant inside the defects are absorbed by the developer which changes colour locally. This will be the indication of an existing defect [33, 34, 35 and 36].
Advantages of Dye Penetration Inspection
It is a low-cost technique
It is simple to perform
The equipment is portable
Disadvantages of Dye Penetration Inspection
DPI is limited to surface defects
The technique is messy
It uses a considerable amount of consumables.
Is limited by space and orientation of an object. 2.4.3 Ultrasound Testing
Ultrasound testing is a contacting non-destructive technique that is used to detect surface and subsurface defects and characterize the material. This technique makes use of the propagation and reflection of high-frequency ultrasound waves [34, 38 and 39]. It is usually used on steels, PVC and other metals, but it can also be used on concrete, wood, and composites.
According to Willcox et al [34], the UT principle is the same as that of echo sounding. An electric charge is applied to a piezo electric crystal to vibrate for a very short period at a frequency related to the thickness of the crystal (generating a short pulse of ultrasound) [38, 40]. The induced Ultrasound waves propagate homogeneously through the material. Where there is a discontinuity of material the propagation of waves will be disturbed and not
Cape Peninsula University of Technology 23 Bandile Jama continue further and reverse with the same magnitude to the inducer [40, 41 and 42]. Figure 2-11 is an illustration of ultrasound induced and reversed due to the material discontinuity.
Figure 2-12. Ultrasound testing principle (Adopted from Willcox et al [34])
Advantages of Ultrasound Testing
The Technique is portable.
No harmful consumables are used.
The results are obtained in real time.
Can detect defects at different positions, size, and type. Disadvantages of Ultrasound Testing
Requires a special skill/training and experience to obtain adequate results.
Indications require interpretation.
Cape Peninsula University of Technology 24 Bandile Jama
CHAPTER 3:
EXPERIMENTAL METHODOLOGY
3.1 Introduction
This section presents the methodology that was used to investigate the effectiveness of infrared thermography (IRT) as a non-contacting non-destructive testing (NDT) technique in the mechanical maintenance arena. Three experimental methods were used to assess the effectiveness of IRT. In the first set of experiments, IRT was employed as a diagnostic technique to detect internal leaks through isolation. In the second lot of experiments, IRT was employed to detect subsurface defects in various materials, and the effectiveness was measured by comparing the methodology with the conventional NDT technique of ultrasound testing. The third set of IRT experiments aimed at detecting surface defects on metals and the effectiveness was compared with the classical NDT techniques of magnetic particle inspection (MPI) and dye penetrant inspections (DPI).
A FLIR T640 Infrared camera was used for the acquisition of data during all experiments (internal leak inspection, surface and subsurface defects' detection). Figure 3-1 depicts an image of the camera used, and Table 5-1 in appendix A-1 contains the specifications of the camera.
Cape Peninsula University of Technology 25 Bandile Jama
3.2 Internal Leak Detection Methodology
The approach to validate the assumption that an inspection for internal leaks from isolation valves could be performed using an infrared camera was conducted by performing a laboratory experiment using a model fluid handling system (see Figure 3-3). The fluid handling system model was intended to obtain and prove the working principle of the technique before it was used in the plant. Figure 3-2 demonstrates schematically the infrared thermography inspection set up for the detection of leaks from isolation valves. The schematic consisting of a thermal camera, medium flowing through the system's processing pipe and an isolation valve. A and B are points used to check the change in temperature of the pipes.
Figure 3-2. Set up of internal leak inspection using IRT
For this study, the medium flowing through the system was hot water with a temperature that was above atmospheric levels. The energy from the water was transferred by conduction through the wall thickness of the pipe raising the outer surface temperature of the pipe to above atmospheric level. The experiment performed in the laboratory used boiled water while in the plant related inspections, condensed steam flowed in the various plant systems.
B
A
ISOLATION VALVE
INFRARED CAMERA FLOW
Cape Peninsula University of Technology 26 Bandile Jama The model's fluid handling system was constructed with a schedule
40
diameter of12
.
7
mm
galvanized pipe. Appendix B-1 provide the sizes of the system and Table 5-2 contains the list of materials used to construct the model. A thread seal tape was used when assembling the model's pipe network to ensure no leaks when under pressure. The system was pressure tested up to
500
kPa
for leak tightness.The Model's fluid handling system contained three
12
.
7
mm
stainless steel ball valves connected in parallel. The valves were connected between the pipes leaving three threads on the pipe protruded outside not to damage the Teflon seal inside the valve.3.2.1 Experimental Procedure with the Model
Figure 3-3 illustrates the fluid handling system of the model which was secured on a wooden plinth, inclined 150to the horizontal. The isolation valves were placed in closed position and the system was filled with hot water (at a temperature of 800 achieved using a domestic kettle). Approximately 2 minutes’ post filling the system, an infrared camera was used to measure the temperature difference across the valves.
Figure 3-3. Fluid handling system mounted onwooden plinth
Thereafter maintenance valve (A) was cracked open (simulating a leaking valve) while valves B and C were maintained in their closed position (see Figure 3-4). Valve A was set slightly open such that the minimum amount of water passing through was approximately
min
/
12
ml
observed in the common drain.Wooden Plinth
A B C
Cape Peninsula University of Technology 27 Bandile Jama
Figure 3-4. Fluid handling model with valve A cracked open
3.2.2 Laboratory (Model’s) Experimental Results
Figure 3-5 is a thermal image of the system before the commencement of the experiment while Figure 3-6 demonstrates the system filled with hot water without any internal leaks noted across the valves. Figure 3-7 illustrates the system with a leak (as expected), observed by a change in the temperature of the pipe downstream of valve A. The results also indicate that valve B and C are not leaking.
Figure 3-5. Thermal image of model’s pipe network before experiment
A
Cape Peninsula University of Technology 28 Bandile Jama
Figure 3-6. Demonstration of system without internal leaks
Figure 3-7. Demonstration of internal leak through valve A
3.2.3 Leak detection across Isolation Valves in the Power Plant
Three different drain systems in the power plant were identified to have potential internal leaks across their isolation valves. The drain systems in the power plant consisted of different types of valves welded between the drain pipes from different systems. Figure 1-3 is a typical arrangement of drain system with ball valves, globe valves and gate valves painted grey in colour. Other systems had double isolation valves with similar valves connected in series. The sizes of drain pipes ranged from
12
.
7
mm
to63
.
5
mm
schedule40
. The pipes were joined together by weld and coated with grey colour paint.Cape Peninsula University of Technology 29 Bandile Jama The experiment was performed during plant operation and the valves were in closed position. The systems were classified as drain system A, B and C and they were assessed to have sufficient thermal energy emitted by the surface of the pipes. The emissivity of the target was measured and the camera was set to the desired emissivity. This was to eliminate other systems around the area with high thermal energy compared to the target, (see the procedure to calculate the emissivity in Appendix C-1).
3.2.4 Results of Internal Leaks through Isolation Valves
Figure 3-8 is an illustration of drain system without internal leaks. Figure 3-9 to 3-11 represent different drain systems with an internal leak.
Figure 3-8. Drain system without internal leaks
Figure 3-9. Drain system A with internal leak
Cape Peninsula University of Technology 30 Bandile Jama
Figure 3-10. Drain system B with double isolation leaking
Figure 3-11.Drain system B with internal leak
3.2.5 Leak detection across Safety Valves
Three safety valves in the power plant were suspected to have potential internal leaks across their seats. These valves installed in the main steam line (1800C of steam flowing through) of the power plant discharge to a common exhaust manifold. The leak was observed on the exhaust manifold but could not identify leaking valve(s) (see the arrangement of the valves in Figure 1-4 and 1-5). Each valve consisted of
400
mm
diameter discharge pipe.IRT was used to monitor the temperature difference across the discharge pipes of the safety valves. The discharge pipes were classified as A, B and C. The emissivity of the target was measured and the camera was set to the desired emissivity. This was to eliminate undue
Leaking valves
Cape Peninsula University of Technology 31 Bandile Jama influence from other systems around the area with high thermal energy compared to the target.
3.2.6 Results of Internal Leaks through Safety Valves
Figures 3-12, 3-13 and 3-14 demonstrate the results obtained during leak detection across safety valves. The results indicate that discharge pipes A and B are likely to have fluid (steam) passing through them when compared to C, and B seems to be worse than A.
Figure 3-12. Discharge pipe A results
Figure 3-13. Discharge pipe B results
B
C
A
A
C
Cape Peninsula University of Technology 32 Bandile Jama
Figure 3-14. Discharge pipe C results
3.3 Pulse Thermography
The aim of this study was to assess the effectiveness of pulse thermography in detecting subsurface defects. The assessment was performed by comparing the results of this technique with the conventional NDT of ultrasound testing. Both techniques were employed to detect subsurface defects on various specimens as described below. Figure 3-15 is a typical pulse thermography set up comprising of, a heating source, the target specimen and an infrared camera.
A heating gun was used as a source to thermally excite the test specimens. the gun can produce a maximum power of
2000
W
and discharges a stream of hot air with a temperature range between600C5000C. Three specimens manufactured from PVC, stainless steel, and mild steel material respectively of identical geometry (see Figure 3-16) were fabricated with flat bottom holes (FBH), of various sizes and depths, at the far side of each specimen. The near surface (surface without holes) of each specimen was coated with matt black paint to ensure uniform emissivity. A thermal camera was used to monitor the surface temperature of each specimen while cooling after having been excited by the hot air from the heating gun. During the experiment, the camera was set to video mode to capture the variation of the temperature on the surface of the specimens.A
B
Cape Peninsula University of Technology 33 Bandile Jama
Figure 3-15. Schematic of the experimental setup of pulse thermography
Figure 3-16. Geometry of the test specimen (units in mm)
Wooden table Thermal Camera Specimen 0.5m Heating gun 0.3m 190 3.5 1.5 2.5 3.5 6 130 1.5 1.5
Cape Peninsula University of Technology 34 Bandile Jama
3.3.1 Experimental Procedure of Pulse Thermography
Figure 3-17 illustrates the experimental set up of pulse thermography. The specimen was secured vertically on a wooden support. The camera was positioned
500
mm
away from the specimen The heating gun was switched on at low speed and hovered by hand on the front side of the specimen for5
s
at an angle approximately 300 from the horizontal plane The Thermal camera recorded the change of temperature contrast on the surface of the specimen.Figure 3-17. Illustration of equipment used during pulse thermography
3.3.2 Experimental Results
Figure 3-18 shows the rear or far side surface of the specimens. Figures 3-19, 3-20 and 3-21 are the thermal images on the near surface of the PVC, stainless steel and mild steel specimens after excitation. The presence of subsurface defects in all figures is noted by the circular hot spots.
Infrared Camera
Heating gun
Cape Peninsula University of Technology 35 Bandile Jama
Figure 3-18. Rear view of the specimen with machined defects
Figure 3-19. PVC specimen’s results
Figure 3-20. Stainless Steel specimen’s results
Cape Peninsula University of Technology 36 Bandile Jama
3.3.3 Ultrasonic Testing
Ultrasonic testing was employed for the inspection of the specimens with the flat bottom holes which were previously examined using Pulse thermography. The test was performed in the UT laboratory at room temperature. A Kraukramer UT machine with a
5
MHz
Twin Crystal probe was used to detect the subsurface defects. An Ultrasound gel was used as a suitable coupling between the probe and the test specimen's surface. Figure 3-22 illustrates the UT experimental set-up.Figure 3-22. Ultrasound inspection set-up
3.3.4 Experimental Procedure of Ultrasound Test
The A-scan mode was used to display the amount of received ultrasonic energy as a function of time to estimate the relative discontinuity sizes by comparing the signal amplitude obtained from an unknown reflector to that of known reflector, and by the position of the signal on the horizontal sweep. The flat bottom holes (FBH) of each specimen in Figure 3-16 were given a unique alphabetic identification from A to F (see Figure 3-23). The Kraukramer UT machine was calibrated prior to the tests using a Standard Calibration Block (SCB) made from
25
mm
thick ferritic steel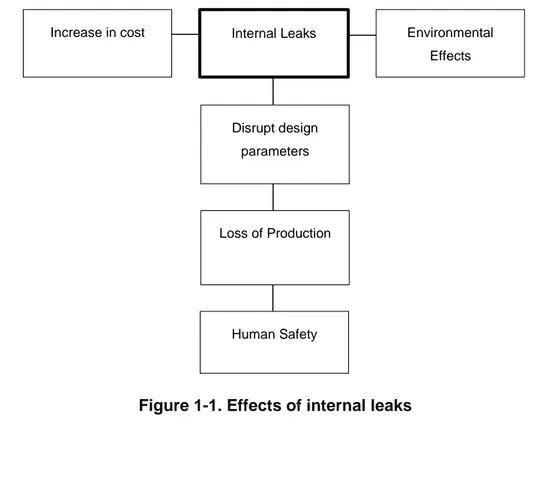
![Figure 2-1. Plankian Curves for blackbody emissions at various temperatures, (Adopted from Ruben et al [2])](https://thumb-us.123doks.com/thumbv2/123dok_us/266472.2527322/25.892.259.679.269.782/figure-plankian-curves-blackbody-emissions-various-temperatures-adopted.webp)
![Figure 2-9 Ultrasound Thermography set-up (Adopted from Xingwang et al [15])](https://thumb-us.123doks.com/thumbv2/123dok_us/266472.2527322/33.892.211.678.501.763/figure-ultrasound-thermography-set-adopted-xingwang-et-al.webp)