Image-Guided Interventions
Der Technischen Fakult¨at der
Universit¨at Erlangen–N¨urnberg
zur Erlangung des Grades
DOKTOR–INGENIEUR
vorgelegt von
Sebastian Vogt
Technischen Fakult¨at der
Universit¨at Erlangen-N¨urnberg
Tag der Einreichung:
18. Februar 2009
Tag der Promotion:
05. Oktober 2009
Dekan:
Prof. Dr. R. German
Berichterstatter:
Prof. em. Dr. H. Niemann
Prof. Dr. N. Navab
Image-Guided Interventions
Submitted to the
Technische Fakult¨at der
Universit¨at Erlangen–N¨urnberg
in fulfillment of the requirements for
the degree of
DOKTOR–INGENIEUR
by
Sebastian Vogt
Technische Fakult¨at der
Universit¨at Erlangen–N¨urnberg
Date of submission:
February 18, 2009
Date of graduation:
October 5, 2009
Dean:
Prof. Dr. R. German
Reviewers:
Prof. em. Dr. H. Niemann
This dissertation summarizes my research activities at the Imaging and Visualization De-partment at Siemens Corporate Research in Princeton, New Jersey. I would like to express my deepest gratitude to Professor Dr. Heinrich Niemann and Dr. Frank Sauer for providing me the opportunity for a dissertation in the field of interventional image guidance in this corporate setting in the United States. While putting great ideas to work under Frank’s direct guidance in the Interventional Imaging Group in Princeton, Professor Niemann has always given me his strong scientific support and many encouraging affirmations during my visits to Erlangen.
Taking an interventional guidance system from its first ideas all the way to pre-clinical animal trials requires a strong team and support from a variety of people. Besides Frank, I would like to thank my colleague Dr. Ali Khamene for the many fruitful discussions we had along the way. I am also very thankful for the contributions from Dr. Fred Azar and all student interns in our group who directly supported my research through user studies and software implementations. Furthermore, I would like to thank all my colleagues and friends at Siemens Corporate Research for the many valuable discussions and advise I received. Special thanks go to Professor Dr. Nassir Navab, Dr. Chanyang Xu, Dr. James Williams, and Dr. Christophe Chefd’Hotel for the discussions on augmented reality, tracking techniques, and image registration methods.
Without the strong support from my colleagues at Siemens Healthcare this research could not have progressed to the presented pre-clinical level. I am thankful for the opportunity to demonstrate the prototype system at the European Congress of Radiology, where we collected valuable feedback. A major part of the study results were collected together with our collab-orators at clinical sites, such as UCLA, Brigham&Women’s Hospital, Case Western Reserve University Hospitals, and Hospital of the University of Pennsylvania. Therefore, I am especially thankful for the contributions of Dr. Frank Wacker, Dr. U. Joseph Schoepf, and Dr. Gregory Rubino, and everybody involved in those pre-clinical trials. Their clinical expertise has helped tremendously to transform an engineering idea into a potential clinical device.
I would like to thank Prof. Dr. Heinrich Niemann and Prof. Dr. Nassir Navab for reviewing my manuscript and the valuable feedback I have received. Furthermore, I would like to express my gratitude to the examiners Prof. Dr. J. Hornegger, Prof. Dr. H. Niemann, Prof. Dr. N. Navab, and PD Dr. M. Lell for providing me the opportunity to defend my dissertation.
Last, but not least, the support of my family and friends was critical in my being able to finish this dissertation. I am indebted to their continued interest in the progress of my research.
1 Introduction 1
1.1 Interventional Image Guidance . . . 2
1.2 Contribution of this Thesis . . . 6
1.3 Outline . . . 8
2 Augmented Reality for Image Guidance 9 2.1 Definition . . . 9
2.2 Challenges . . . 12
2.3 Medical Imaging . . . 15
2.3.1 X-Ray Imaging and Fluoroscopy . . . 17
2.3.2 Computed Tomography . . . 19
2.3.3 Magnetic Resonance Imaging . . . 21
2.3.4 Ultrasonography . . . 23
2.3.5 Endoscopy . . . 25
2.3.6 Other Medical Imaging Techniques . . . 26
2.4 Visualization . . . 27
2.4.1 Medical Images . . . 28
2.4.2 Rendering of Volumetric Medical Images . . . 30
2.4.3 Graphics and Real Scene Fusion . . . 35
2.4.4 Augmented Reality Displays . . . 39
2.5 Registration . . . 43
2.5.1 The Registration Problem in AR . . . 43
2.5.2 Parameters of a Virtual Camera Model . . . 45
2.5.3 System Calibration and Registration Techniques . . . 49
2.5.4 Static and Dynamic Errors . . . 51
2.6 Tracking . . . 54 i
2.6.3 Electromagnetic Tracking Systems . . . 58
2.6.4 Other Tracking Systems . . . 59
2.7 Existing Approaches for Interventional AR Guidance . . . 60
2.7.1 Optical Microscope Systems . . . 60
2.7.2 Video See-Through Systems . . . 63
2.7.3 Large Screens . . . 67
2.7.4 Tomographic Overlay . . . 70
2.7.5 Video Endoscope Systems . . . 74
2.7.6 Other Methods: Direct Projection . . . 75
3 RAMP—A Novel System for AR Guidance 77 3.1 System Design . . . 77
3.1.1 Video See-Through Approach . . . 78
3.1.2 HMD Hardware Components . . . 79
3.1.3 AR Hardware Architecture . . . 81
3.1.4 AR Software Architecture . . . 82
3.1.5 Stereoscopic AR Scene Composition . . . 84
3.2 Single Camera Marker Tracking . . . 85
3.2.1 Head Mounted Tracker Camera . . . 85
3.2.2 Marker Set Design for Head Tracking . . . 85
3.2.3 Marker Cluster Design for Instrument Tracking . . . 86
3.2.4 Marker Detection Strategy . . . 88
3.2.5 Camera and Scene Geometry . . . 91
3.2.6 Offline Camera Calibration . . . 93
3.2.7 Real-Time Tracking . . . 96
4 RAMP—Technical Evaluation 101 4.1 Calibration and Tracking . . . 101
4.1.1 Camera Calibration Accuracy . . . 101
4.1.2 Tracking Accuracy . . . 102
4.2 Marker Cluster Optimization . . . 103
4.2.1 Marker Cluster Tracking Error . . . 103
4.2.2 Evaluation of the Cluster Design . . . 105 ii
4.2.5 Simulated Variation of the Cluster Pose . . . 110
4.2.6 Experimental Variation of the Cluster Pose . . . 112
4.3 AR Guided Navigation . . . 113
4.3.1 Needle Placement Phantom . . . 113
4.3.2 AR Visualization . . . 115
4.3.3 User Study and Success-Rate . . . 116
4.4 Comparison with other Navigation Methods . . . 117
4.4.1 Experimental Setup . . . 117
4.4.2 Four Visualization Schemes . . . 118
4.4.3 User Study and Results . . . 119
5 RAMP—Medical Applications and Pre-Clinical Evaluation 121 5.1 Surgery Planning . . . 121
5.1.1 Setup . . . 122
5.1.2 In-Situ Visualization of Volumetric Medical Imaging Data . . . 123
5.1.3 Interactivity with a Hand-Held Input Device . . . 125
5.1.4 User Experience . . . 127
5.2 MRI-Guided Neurosurgery . . . 128
5.2.1 AR for a Neurosurgical MRI Operating Suite . . . 128
5.2.2 Phantom Experiments . . . 130
5.2.3 Guidance Preceding a Craniotomy . . . 133
5.3 CT- and MRI-Guidance in Interventional Radiology . . . 135
5.3.1 AR for CT-Guided Needle Procedures . . . 135
5.3.2 Phantom Study under CT-Guidance . . . 137
5.3.3 AR for MRI-Guided Needle Procedures . . . 143
5.3.4 Phantom Study under MRI-Guidance . . . 145
5.3.5 Animal Study under MRI-Guidance . . . 149
5.4 Diagnostic and Interventional Ultrasound . . . 153
5.4.1 AR Visualization of Live US . . . 153
5.4.2 AR for US-Guided Needle Biopsies . . . 155
6 Future Work 159
A Mathematical Symbols 165
B German Title and Abstract 167
Bibliography 169
Index 191
1.1 Frame-based stereotactic neurosurgery . . . 3
1.2 Frameless navigation system for neurosurgery . . . 4
2.1 Example for augmented reality in an industrial environment . . . 10
2.2 MILGRAM’Sdefinition of mixed reality . . . 11
2.3 Four enabling technologies of an interventional AR guidance system . . . 16
2.4 Example for the progress of medical imaging technologies . . . 17
2.5 X-ray imaging device and radiograph of the wrist . . . 18
2.6 CT scanner and cross-sectional slices of the head . . . 19
2.7 Different types of visualization of CT data . . . 20
2.8 MRI scanner and cross-sectional slice of the head . . . 22
2.9 Ultrasound machine and ultrasound image of a liver cyst . . . 24
2.10 Endoscope and endoscopic views of a duodenal ulcer . . . 26
2.11 Example for windowing of CT images . . . 29
2.12 Stack of axial CT slices and illustration of a set of voxels . . . 30
2.13 Illustration of multi-planar reformating . . . 31
2.14 Volume rendering of a fractured bone with different transfer functions . . . 32
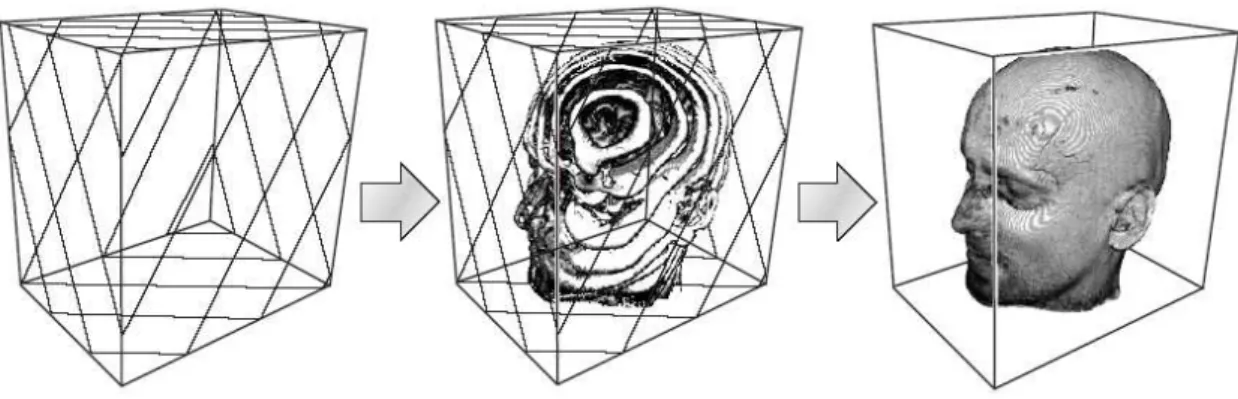
2.15 3D texture-based volume rendering . . . 33
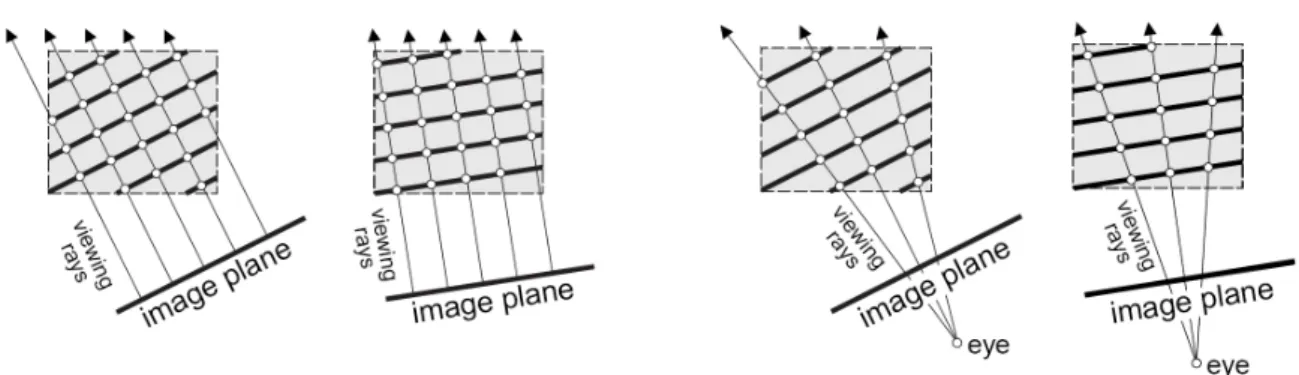
2.16 Illustration of volume rendering with viewport-aligned slices . . . 34
2.17 System model for an AR system with optical or video blending . . . 35
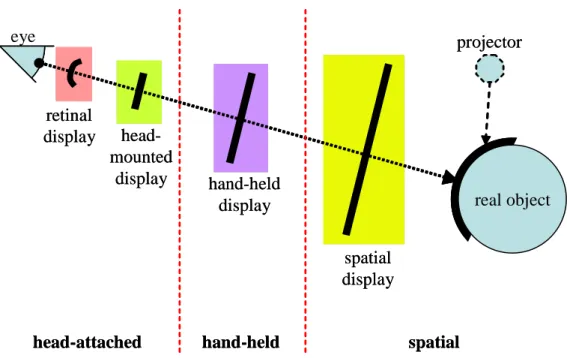
2.18 Illustration of the different types of augmented reality displays . . . 39
2.19 Illustration of the basic concepts of head-attached displays . . . 40
2.20 Coordinate systems of the common pinhole camera model . . . 45
2.21 Two-camera optical tracking system with passive retroreflective markers . . . 56
2.22 Multi-camera optical tracking system with passive retroreflective markers . . . . 57
2.23 Electromagnetic tracking devices . . . 58
2.24 Device for microscope-assisted guided interventions (MAGI) . . . 61 v
2.27 Monitor-based navigation system for image-guided neurosurgery (MIT) . . . 64
2.28 Head-mounted video see-through augmented reality (UNC) . . . 65
2.29 Data-fusion display system and monitor-based video see-through AR . . . 66
2.30 Schematic drawing of CAMC . . . 67
2.31 Large screen image overlay system (CMU) . . . 68
2.32 Image overlay system ARSyS-Tricorder (Fraunhofer) . . . 69
2.33 Autostereoscopic image overlay of integral videography (Univ. of Tokyo) . . . . 70
2.34 Ultrasound overlay with the Sonic Flashlight (VIA Lab) . . . 71
2.35 Principle of real-time tomographic reflection . . . 72
2.36 Tomographic overlay systems inside CT and MRI scanners (Johns Hopkins) . . . 73
2.37 AR of endoscopic images with the daVinci system (INRIA) . . . 75
3.1 Stereoscopic video see-through HMD with camera triplet (RAMP) . . . 80
3.2 Hardware structure of the RAMP system . . . 82
3.3 Software structure of the RAMP system . . . 83
3.4 Marker configuration for head tracking . . . 86
3.5 Marker configuration for instrument tracking . . . 87
3.6 Tracker camera image and zoomed view of a marker . . . 88
3.7 Coordinate transformations which are estimated by the RAMP system . . . 90
3.8 Calibration object for tracking camera and scene cameras . . . 93
3.9 Simulated fields of view of tracker and scene camera . . . 94
3.10 Sequence of operations for the estimation of the pose of the tracker camera . . . 98
4.1 Simulation error plots for synthesized marker clusters . . . 107
4.2 95% confidence ellipsoid for a target point for different marker clusters . . . 108
4.3 Simulation error plots for the estimated pose of a coplanar marker cluster . . . . 109
4.4 Simulation error plots for non-coplanar marker cluster . . . 110
4.5 Error plots for real coplanar marker cluster . . . 111
4.6 Error plots for real non-coplanar marker cluster . . . 112
4.7 Biopsy needle with attached marker cluster for pose tracking . . . 113
4.8 Phantom to evaluate the accuracy of AR guidance in a needle placement task . . 114
4.9 Augmented view for needle guidance . . . 115
4.10 Visualization for 2D navigation and 3D navigation . . . 118 vi
5.1 AR phantom head setup demonstrating surgery planning . . . 122
5.2 In-situ volume-rendering of a CT dataset inside the head phantom . . . 124
5.3 Interactivity with a wireless trackball with attached marker cluster . . . 125
5.4 AR visualization of MPR cross-sections and interactive volume-rendering . . . . 126
5.5 Zoomed view of in-situ volume rendered anatomical structures . . . 127
5.6 In-situ visualization of MRI images on a phantom in a neurosurgical suite . . . . 128
5.7 Calibration phantom for an interventional MRI suite . . . 129
5.8 AR control view of the calibration phantom after calibration . . . 130
5.9 Phantom experiments in the interventional MRI suite at UCLA . . . 131
5.10 Experimental AR-guided “tumor resection” with a gadolinium-doped phantom . 132 5.11 Feedback from neurosurgeons at HUP prior to a craniotomy . . . 133
5.12 Impressions of the RAMP system prior to an actual craniotomy at HUP . . . 134
5.13 RAMP at the interventional CT Suite at Brigham and Women’s Hospital . . . 136
5.14 AR guided needle placement studies in an AR enabled CT suite . . . 137
5.15 Performing a control CT scan of the phantom with inserted needle . . . 138
5.16 Needle placement errors of 10 AR-guided needle placement experiments . . . 139
5.17 Needle placement errors in respect to each target center (for experiments 1–5) . . 140
5.18 Needle placement errors in respect to each target center (for experiments 6–10) . 141 5.19 Needle placement errors averaged over 10 experiments . . . 142
5.20 RAMP at the MRI suite at University Hospitals of Cleveland . . . 144
5.21 AR-guided MRI needle placement experiments on gel phantoms . . . 145
5.22 View of the needle during the needle placement procedure . . . 146
5.23 MRI images of the phantom with 12mm targets . . . 147
5.24 MRI images of the phantom with 6mm targets . . . 148
5.25 Virtual placement error of 51 needle placements . . . 149
5.26 AR-guided needle placement procedure on an anesthetized pig . . . 150
5.27 AR views during needle placements on a pig . . . 151
5.28 MRI images of a pig undergoing an AR-guided needle placement . . . 152
5.29 Setup for AR visualization of real-time ultrasound images . . . 153
5.30 Ultrasound augmentation of test and a breast phantoms . . . 155
5.31 AR visualization for ultrasound guided biopsies in breast phantoms . . . 156
5.32 Ultrasound 3D reconstructions after AR guided needle placements . . . 158
1.1 A generalized view at the two main groups performing image guided interventions. 2 4.1 Attributes of the studied marker clusters. . . 107
Introduction
In the realm of scientific research, chance is rarely acknowledged as a contributing factor in fundamental findings—with a few exceptions. Owing to the accidental discovery of x-rays and their properties in 1895, R¨ontgen’s research in physics rapidly advanced the field of medicine into the completely new era of radiology, while providing the basis for some of the most important diagnostic tools and treatment procedures developed throughout the 20th century. After all, accidental discoveries have always been made by bright scientists, or as Louis Pasteur1 coined, “In the field of observation, chance favors only the prepared mind.” Prof. R¨ontgen was awarded a honorary Doctor of Medicine degree from the University of W¨urzburg and the first Nobel Prize in Physics in 1901.
Today’s medical imaging technologies, such as radiography and fluoroscopy, CT and MRI scanning, ultrasonography, nuclear medicine imaging, and endoscope-type devices, provide a facet of anatomical and functional patient information to perform a reliable diagnosis and to facilitate proper treatment options. As such, medical images are not only utilized for diagnostic purposes but also for interventional guidance. The structural and functional information gained from the images and their precise mapping into the space of the patient during an intervention provides effective guidance and critical support to the performing physician during the procedure. For instance, during a brain tumor resection the neurologist’s ability to completely extract all tumor tissue, while avoiding critical vessels and harming as little healthy tissue as possible, depends on proper registration between the patient’s MRI data and his head as well as on an effective way to guide the neurologist toward the target structure.
1Louis Pasteur (1822-1895), French microbiologist, chemist, pioneer of the “Germ theory of disease”, and
inventor of the process of Pasteurization. http://en.wikiquote.org/wiki/Louis Pasteur
Tools Imaging Navigation interventional needle, online: x-ray fluoroscopy, through real-time
radiologist catheter ultrasound, (rarely MRI & CT) imaging (low quality) systems for mapping medical
surgeon scalpel offline: MRI, CT, (ultrasound)
images to patient (neurosurgeon)
Table 1.1: A generalized view at the two main groups performing image guided interventions.
1.1
Interventional Image Guidance
For a wide variety of interventions and diseases the surgical approach has been fundamentally altered owing to the availability of patient specific imaging information in the operating room. An intervention can be categorized with respect to its invasiveness:
• invasive: such as open surgery or chemotherapy,
• minimally invasive: such as a needle biopsy or laparoscopy,
• non-invasive: such as virtual endoscopy or radiotherapy.
The integration of medical images into the workflow of an intervention provides the physician with information on anatomical structures and pathology of the patient that he can expect to encounter, enabling him to perform an efficient treatment and to possibly follow a minimally invasive approach. Image-guided procedures are mainly performed by surgeons and interven-tional radiologists. Due to the different applications their methodologies vary fundamentally and can be roughly classified as shown in Table 1.1. On the one hand, medical imaging actually permits a radiologist to perform minimally invasive interventions, such as needle biopsies and catheter-based interventions, guided by real-time imaging modalities, such as x-ray fluoroscopy or ultrasound imaging. On the other hand, medical imaging permits a surgeon to perform a surgery more targeted and effectively and therefore also enabling highly complicated inter-ventions, possibly minimally invasive. Nevertheless, interventional radiologists are limited to navigational guidance by real-time imaging, which provides limited image quality compared to offline imaging devices, such as CT and MRI. Contrary, surgeons are limited to (high-quality) pre-operative images, mostly CT or MRI, without much navigational guidance and no imaging updates during the surgery.
In the 1980s imaging modalities were beginning to be combined with stereotactic neurosur-gery techniques for the resection of brain tumors [Kel82]. Stereotactic surneurosur-gery or stereotaxy utilizes a 3D coordinate system to locate small targets inside the patient and to guide a minimally invasive intervention for lesion biopsies and tumor ablations (i.e., removal), and other tasks, such
Figure 1.1: Frame-based stereotactic neurosurgery. Left: The medical images reveal the target structure and the stereotactic frame in the same coordinate system. Right: The stereotactic frame is attached to the patient’s head and the surgical apparatus, which is fixed to the frame and can be moved along the circular frame, is adjusted to approach the target coordinates within the brain. as injection, stimulation, implantation, and radiosurgery of a specific location within the patient’s body. However, its applications have been mostly limited to brain surgery due to the necessity of a reliable frame of reference, such as bones with a fixed spatial relation to the soft tissue. (Nevertheless, applications for stereotactic biopsy of the female breast to sample and remove malignant tissue can be found as well.) The concept of stereotactic brain surgery is based on medical images of the patient’s brain which guide the surgeon. To navigate towards the target location one of two fundamentally different techniques is utilized to create a reliable coordinate system throughout the procedure:
• frame-based: An external frame is attached to the patient’s head that provides mechanical
guidance and alignments for minimally invasive instruments.
• frameless: Imaging markers are attached to the patient’s head and a real-time tracking
device is utilized to relate instruments and pointers to this coordinate system.
In frame-based neuro-navigation a light-weight frame is attached to the patient’s head under local anesthesia. Figure 1.1 shows this stereotactic frame attached to the patient’s skull. Subse-quently the head is imaged by CT, MRI, or x-ray angiography methods. Target locations within the images can now be extracted in spatial relationship to reference points on the frame, which
Figure 1.2: Frameless navigation system for neurosurgery. Left: The patient’s head is fixed to the head clamp of the neurosurgical table and the pre-operatively acquired MRI images are registered to a stationary coordinate system utilizing markers that were attached to the patient’s skull prior to imaging. The two-camera tracking system to localize the handheld instruments is standing behind the doorway. Right: The neurosurgeon can observe tracked instruments on a screen in relationship to the MRI images.
also appears in the medical images. The surgical apparatus, which is attached to the head frame, can be adjusted to the target coordinates (while being restricted to the degrees of freedom that the frame provides). Utilizing this surgical apparatus, the surgeon can now accurately approach the target within the brain. A typical example is the minimally invasive stereotactic biopsy of deep lying brain tumors. An open surgery of deep tumors within the brain poses a big challenge and would be very risky. The surgeon utilizes a stereotactic biopsy apparatus which is fixed to the head frame and adjusted along this circular head frame to target the coordinates of the tumor. Then the biopsy needle is passed from the frame through a small hole in the skull to sample tissue for diagnosis. The same technique is used to place electrodes into the brain for the treatment of movement disorders, such as Parkinson’s disease.
Contrary to frame-based navigation, frameless stereotactic surgery utilizes some form of fiducial markers, which can for instance be taped to the patient’s scalp prior to the CT or MRI scan. These fiducials are used later on in the operating room to register the brain images (which also contain these fiducial markers) to a stationary coordinate system on the operating table. A separate tracking system is needed to track the position and orientation of medical instruments or pointers during the surgery relative to this stationary frame. Typically a monitor screen then continuously shows a graphical representation of the tracked instruments in relation to the med-ical images. Figure 1.2 provides an example of a frameless navigation system. The patient’s
skull is rigidly attached to the head clamp of the neurosurgical table which provides a base for the coordinate system of the tracked instruments. Tracking of instruments and pointers typically works optically by means of several infrared LEDs that are attached to the instrument and which are localized in 3D space through triangulation by two or three cameras. Other tracking methods are based on passive retroreflective markers that are illuminated by a stationary infrared light source in combination with a setup of two or three cameras. Frameless neuro-navigation is an important tool for the precise approach and removal of large brain tumors due to the access and freedom it provides compared to a frame-based approach.
Commonly an image-guided intervention is defined as a patient encounter where medical images are obtained (during or before the procedure) and used for guidance, navigation, and orientation in a minimally invasive procedure to reach a specific target under operator control [Hal02]. The common requirements for image-guided interventions are a source of images and a real-time interactive display linked to the intervention, which also provides a means of defining the target in the context of the real 3D space (as distinguished from the abstract image space). Advantages of image-guided interventions are manifold: They are less invasive and more efficient (in time and cost), they result in fewer complications and reduce the need for rework, and additionally they tend to be the preferred approach by the public, resulting in a rapid clinical acceptance. Disadvantages are that complexity and costs may be increased for procedures that can be accomplished without medical images or images might not be updated during the proce-dure, opening the possibility to miss-guidance.
Image-guided interventions are often the only alternative for patients with no obvious signs of disease but positive screening results for cancer and other diseases. A reliable diagnosis for cancer, for example, can only be made and treatment started when histopathological results are available from tissue sampling. A dedicated image-guided biopsy procedure may also be combined with an administration of therapy. In the past these diagnoses had to be (and for many applications currently still have to be) performed during open surgery. Image-guidance can provide new treatment options that may not exist today. Based on the research and the proven benefits of image-guidance for breast biopsies and prostate radiotherapy many patients would prefer such an approach if it were available. Therefore there is a strong motivation to develop, refine, adapt, and extent image-guidance systems to new applications, especially to common interventions where image-guidance for a minimally invasive approach is currently not an option. Potential applications include patients with positive cancer screening tests, neurosur-gery, orthopedics, vascular surneurosur-gery, and general surgery.
1.2
Contribution of this Thesis
The aim of this thesis is to design, develop, and study a new approach to interventional image guidance based on augmented reality visualization—the merging of real and virtual images. Even though frameless stereotactic navigation systems, which are commercially available, currently support image-guided interventions, surgeons and interventional radiologists are restricted to looking at a monitor screen away from the actual patient, considerably complicating hand–eye coordination. A fundamentally novel augmented reality approach requires a unique combination of dedicated contributions to an array of engineering disciplines, namely systems engineering, computer vision, data visualization, and human-computer interface design. Furthermore, signif-icant contributions to the medical sciences community have to be made based on pre-clinical studies and evaluations of the new approach. Important results here feed directly back to further advancements in the engineering of the augmented reality guidance system.
Contributions to the field of systems engineering. The complexity of an augmented
reality system cannot be equated with the sum of its parts. This work, therefore, broadly reviews and categorizes all preliminary augmented reality prototype systems for interventional image guidance and serves as a first comprehensive reference in this field. A novel augmented reality setup is introduced and engineered for interventional guidance tasks, integrating pre-operative imaging, namely CT and MRI, as well as real-time ultrasound imaging. Built on a single PC platform with four independent frame-grabber boards and genlocked cameras, this system uniquely combines head-mounted stereoscopic video capture and visualization with optical head and instrument tracking in a very efficient, but yet modular, closed-loop approach. Because of its unique architecture it provides unmatched real-time performance and accuracy of high resolution augmented reality, enabling most complicated guidance tasks.
Contributions to the field of computer vision. This work advances methods for
multi-camera calibration and real-time tracking. A novel head-mounted multi-camera-triplet is described, where two cameras capture the stereoscopic view of the scene while a third, near-infrared camera with a wide-angle lens and a synchronously pulsing infrared flash is used for real-time pose estimation tasks, tracking retroreflective markers in the scene. A specialized calibration tech-nique for the calibration of all intrinsic and relative extrinsic parameters of the camera-triplet with a dedicated calibration object is developed, taking into account the very different optical properties of the three cameras. This technique builds on established photogrammetric methods for the calibration of a single camera by means of 2D–3D point correspondences. In respect to real-time optical tracking, a unified approach to pose estimation is developed that includes an optimized cluster design of retroreflective markers, a strategy for marker identification in the
tracker camera images, and a method for extrinsic camera parameter estimation based on an initial 3-Point algorithm and non-linear parameter optimizations utilizing all available 2D–3D point correspondences. This unified approach provides precise pose estimates for the camera-triplet in respect to stationary marker frames and marker clusters that are attached to hand-held tools in less than 10ms. The robustness of the tracking results is evaluated in Monte-Carlo simulations and in actual experiments.
Contributions to the field of data visualization and human-computer interfaces. The
introduced augmented reality system provides a novel way to access three-dimensional datasets intuitively in direct relation to real objects and interactions. The unique combination of high-speed stereoscopic rendering of volumetric datasets (such as CT scans or ultrasound scans), head-mounted visualization, and head tracking enable the user to move around and study the seemingly stationary dataset from a variety of viewpoints. In comparison to typical screen-based visualization methods, the stereoscopic and kinetic depth cues of the proposed head-mounted approach provide a much higher degree of immersion and, thus, understanding of the data. Fur-thermore, the system provides the stereoscopic view of the real scene (such as the patient’s body) in direct relation to the virtual data, effectively rendering real objects transparent if the virtual dataset represents otherwise invisible internal details. Interactions with the datasets, which in a screen-based solution need to be resolved through mouse movements and clicks, is given in a way that resembles interactions with real objects by means of tracked instruments. For instance, a tracked hand-held pointer provides all the means to generate arbitrary cross-sections through the 3D dataset—as simple as moving a transparency sheet through the dataset.
Contributions to applications of augmented reality. This work makes strong
contri-butions to potential applications of augmented reality in the interventional arena. Studies are performed that show that three-dimensional graphics presented within the actual patient with stereoscopic and kinetic depth cues provide a very compelling and direct access to anatomi-cal information for the planning and guidance of an efficient intervention. Surgeons benefit from this direct overlay of medical images onto the actual patient especially during minimally invasive surgeries. Additional navigational support is given by means of tracked instruments, in particular biopsy and ablation needles, which are visualized as virtual objects within the patient’s actual body. Results of pre-clinical phantom and animal studies are presented, utilizing the introduced augmented reality system for needle placement tasks, that evaluate the benefits of the availability of pre-operatively acquired imaging information (e.g., CT or MRI) to interventional radiologists during an intervention. Increased biopsy precision, operating time, and the absence of continuous x-ray exposure through fluoroscopy are major contributions here.
1.3
Outline
This thesis is structure in the following way. Chapter 2 defines the field of augmented reality and its specific challenges when put into the realm of interventional image guidance. Its enabling technologies—medical imaging, visualization, registration, and tracking—are described in detail thereafter followed by a survey of current research on augmented reality prototype systems in the medical arena.
A novel augmented reality system, engineered for interventional image guidance, is detailed in Chapter 3. Emphasis is put on the novelty of its design and its unconventional tracking approach. High-quality stereoscopic head-mounted video see-through augmented reality puts particularly high demands on hardware and software architectures of a single PC based system. Its specific application-driven engineering and implementation is explained before the tracking methodology with a single head-mounted camera and retroreflective markers is described.
A technical evaluation of the introduced system is given in Chapter 4. The performance of the head-based tracking system as well as an optimization of marker set parameters is studied followed by an evaluation of the navigational aspects of the system by means of user studies with a tracked needle setup, also comparing the system performance with traditional screen based navigation systems.
Chapter 5 puts the AR system engineered in Chapter 3 and optimized in Chapter 4 into the context of image-guided applications, targeting surgery planning, MRI-guided neurosurgery, CT- and MRI-guided interventional radiology, as well as real-time ultrasound procedures. Each application is described based upon an adaptation of the AR system to the particular clinical setup. Extensive pre-clinical phantom and animal studies are evaluated to study the potential of the given guidance approach for future clinical use.
After providing directions for future research with the proposed augmented reality approach in Chapter 6 the thesis concludes with a summary in Chapter 7.
Augmented Reality for Image Guidance
Image guidance systems help the physician to establish a mapping between a patient’s medical images and the physical body. In conventional systems, a pointer or an instrument is tracked and the location visualized in the medical images on a screen separate from the patient. A new approach for image guidance is based on a visualization method that combines medical imaging information with the real view of the patient; it visually augments reality to guide the physician. The physician can see beyond the surface, the patient’s body becomes transparent for him. This method has the potential to be the most direct and intuitive way of presenting the medical imaging information.
After defining the field of augmented reality, this chapter details the challenges that this technology faces especially in the arena of medical image guidance. An explanation of the different technologies to generate medical images is followed by the theoretical fundamentals of visualizing those in an augmented reality framework. Besides visualization, this framework builds upon two more enabling technologies, registration and tracking, which are described in detail thereafter. This chapter concludes with a comprehensive investigation and classification of existing approaches for augmented reality image guidance.
2.1
Definition
Although the term Augmented Reality (AR) has been widely used in publications throughout the last twenty years, a unique and unconditionally accepted textbook definition has not been settled yet. This is mainly due to the different technical approaches that have emerged during this time to realize an augmentation of the real world in manifold types of potential applications. There are no indications that the term Augmented Reality has been discussed before the advent or
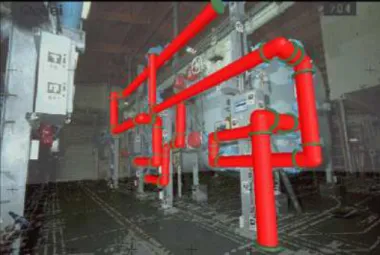
Figure 2.1: Example for combination of virtual and real objects in a real environment as gener-ated by an AR system. The industrial environment is augmented by a planned addition of pipes and a technical drawing from beneath the floor. (Picture courtesy of Nassir Navab)
outside the realm of these technical approaches. As such, Augmented Reality, in a broad sense, is understood as an alteration of the perception of the real environment by technical means. More specifically, it is a new form of interaction between humans and technology in which the user is given supplementary information about his environment, for example, computer-generated visual information via head-mounted displays. This supplementary information is context dependent— drawn from and fitted to the real object being viewed.
Rather than defining generally what Augmented Reality is, many research groups have ac-cepted a terminology, such as in [Azu01], to define an Augmented Reality system as a system with the following properties. It
• combines real and virtual objects in a real environment,
• runs interactively, and in real-time, and
• registers real and virtual objects with each other.
The definition makes use of the attributes real and virtual to specify the two types of objects that are being combined. There, “real objects” denotes objects that physically exist in the envi-ronment of the user’s attention. Whereas, “virtual objects” describes objects that physically do not exist but are generated in some form by the Augmented Reality system to be perceived as objects by at least one of the user’s senses. Specific for an Augmented Reality system is that the combination of real and virtual objects happens in a real existing environment that the user could interact with. As such, it is intrinsic that an Augmented Reality system has to preserve this
Real Environment Augmented Reality Augmented Virtuality Virtual Environment Reality-Virtuality Continuum
Figure 2.2: MILGRAM’S definition of Mixed Reality as a continuum between real and purely virtual environments. (Adapted from [Mil99].)
interactivity between user and real environment. To achieve this, it has to run in real-time, i.e., without a noticeable delay or perturbance of the user’s perception of the environment comprising real and virtual objects. Additionally, the physical relation between the real and virtual objects has to be known to the system at any time. Therefore, it has to be able to register the virtual and the real objects with each other and keep track of the user’s interactions.
Noteworthy is that this definition does not restrict itself to the sense of sight only. As such, a technologically advanced Augmented Reality system could potentially apply to all senses, such as hearing, sight, touch, and smell. Studies for multi-sensory AR and interactions, such as auditory or tangible augmentations of the real environment, can be found for instance in [Loo99, Pai05]. However, mostly all research for AR technologies has been done in the area of visualization by means of computer graphics, where computer generated objects are super-imposed onto the view of the real environment.
Figure 2.1 shows an example for a seamless visual combination of real and virtual objects in a real environment as described in [Nav99b]. The view of an industrial environment is augmented with a planned addition of pipes. The user of the AR system is able to investigate if the 3D computer model of pipes fits into the existing construction and avoids possible interferences with existing parts by looking at the fused scene from different viewpoints.
In [Mil94, Mil99] a taxonomy has been introduced to describe the merging between real and virtual environments within a global framework. Computer-generated purely virtual envi-ronments, also referred to as Virtual Reality, on the one hand, and real envienvi-ronments, on the other hand, can be understood as poles at the opposite ends of a Reality-Virtuality Continuum as symbolized in Figure 2.2. Any world that comprises real and virtual elements can be located along this continuum. Mixed Reality is defined as the term to address the whole spectrum in between both poles. As such, Augmented Reality covers one part of the spectrum whereas
en-vironment is real in the first and virtual in the second case.
Creating a so-called semi-immersive environment by means of an Augmented Reality sys-tem is such a fundamentally new way of presenting information to the user, that a multitude of applications for this new technology is currently being explored and investigated. Research in the field of AR tries to overcome its general as well as application specific challenges and pushes the boundaries of its enabling technologies.
2.2
Challenges
Various technologies from a facet of engineering disciplines are fundamental to tackling the challenges of an augmentation of the real world by technical means. Although an augmentation of the real world could refer to any of the user’s senses, all applications so far evolve around a visual augmentation with computer graphics. Current research and prototype development of augmented reality systems draws from advances in at least three enabling technologies— visualization, registration, and tracking.
• Visualization: The visualization component of an AR system is responsible for the
ren-dering of the virtual objects and the seamlessly combined presentation of virtual and real world to the user.
• Registration: The registration component establishes a spatial relationship between objects
in the real scene, virtual objects, and the user, usually by means of parameterized models, where a subset of those parameters can change over time.
• Tracking: Tracking denotes the process of keeping track of the parameters over time that
relate real and virtual world to each other from the user’s point of view while using the Augmented Reality system.
Different applications require different approaches for these three building blocks of an AR sys-tem. Current research on AR systems concentrates on medical, manufacturing, infotainment, and military applications. Nevertheless, the fundamental challenges for building an AR system for any application are mostly the same and evolve around the three afore mentioned building blocks. The characteristics by which an AR system is evaluated are:
• Real-Time: An AR system needs to operate in real-time. This means that the view of the
augmented world should be updated several times per second. In the movie industry it is commonly accepted that an update rate of 24-30 Hz is the minimum rate to give the viewer
a feeling of continuity rather than a feeling of viewing a sequence of single images. The same applies to an AR system. Achieving a high update rate is one of the major challenges when building an AR system. Furthermore, besides the update rate for the visual cue, the real-time aspect of an AR system also comprises its system responses to user interactions. The user should have the feeling that action and reaction are in direct relation to each other.
• Display: The display is the central part of current AR system prototypes since it is the
primary interface between the user and the AR system. The challenge is to design a dis-play that can visualize an augmented real world to the user in a way that—while adding virtual objects to the user’s view—does not deteriorate the perception of the real world. In practice a compromise has to be found that weighs the amount of alteration of the real world perception against the importance of other aspects of the AR system, such as the precision of the overlaid virtual objects and the impression of a fused augmented world. Technical means have to be found to combine the real world view with the rendered virtual world. A wide variety of display technologies are being currently evaluated for this pur-pose, which include head-mounted and stationary displays, stereoscopic and monoscopic devices, and optical and video techniques to blend graphics into the real environment.
• Accuracy: To achieve a precise visual merging of real and virtual objects in 3D space many
aspects of the AR system have to be described by accurate mathematical and geometrical models. As such, the method of the display system for passing through a view of the real world to the user and its approach of overlaying virtual objects in form of 3D computer graphics have to be modeled. Registration methods have to be developed that can correlate the model of the AR display with the real world and the model of the virtual world, as well as with a tracking device which is responsible for reporting changes in the registra-tion parameters over time. The accuracy of an AR system depends on precise models and good estimates of its model and registration parameters. Errors can be grouped into static and dynamic errors. Static errors are caused by mechanical misalignments, incorrect models and registration parameters, and errors in the tracking system, which results in ill-fitting graphics overlays even when everything, including the user, remains completely still. Dynamic errors are caused by instabilities of the tracking system or noisy estimates of its time-changing parameters, which causes jitter or visible jumps in the graphics overlay. Another form of dynamic error is introduced by latency in the AR system.
• Latency: Since an Augmented Reality system needs time to estimate current tracking
view, an AR system always introduces some latency between movements in the real scene (including user actions) and its augmented visualization. This system latency translates to a perception of lagging, which is independent of the afore-mentioned update rate of the real-time aspect of an AR system. Currently, well designed AR systems might be able to cut system latency down to 60ms–180ms. The main difference between AR systems is the approach of how they deal with this system lag. If it is technically not possible to delay the visualization of the real part of the scene, then the augmenting computer graphics will lag behind during scene or user motions. This can be perceived as “swimming” of the graphics on the background of the real scene, which introduces, sometimes strong, visible dynamic errors to the system. A system which can delay the view of the real world, for instance by using video cameras, might be able to synchronize real and virtual world in a way that both match in space and time. In this case the lag is felt by the user for the completely fused scene, as if the whole (augmented) world were lagging behind by a split of a second. The challenge is to design a system that minimizes system latency, without compromising tracking accuracy and quality of the augmented images, and which handles the introduced lag in a way that is acceptable for the chosen application.
• Range: Every AR system is limited by a working range. The boundaries are defined by
its construction and its tracking technology. On one side of the spectrum, mobile systems might be able to be used in many places, but a sophisticated tracking technology has to be provided to achieve satisfying accuracy. For instance a GPS (Global Positioning System) device can provide position data in the outdoors around the globe, but only with limited accuracy. This might be enough for virtual annotation tasks of the real environment in the area of infotainment, but will lead to strong misregistration errors when combining complex virtual objects with the real world view. On the other hand, stationary systems with a confined workspace can be designed around a specific application and adapted with a dedicated tracking device to provide optimal tracking results for a predefined set of tasks.
• Acceptance: As with every new technology, AR technology has to prove its reason for
existence—which usually is very different to iterative improvements of already existing and accepted technologies. The development of a prototype, which can be studied in the planned environment of the system, especially by the users who will ultimately benefit from this new technology, is an important aspect during the research of a proper sys-tem design. Since an AR syssys-tem does not automate existing tasks, nor does it control anything, but it is meant to augment a user’s vision for an application dependent purpose,
the human-factor is a central part during the evaluation of such a new technology. Do the benefits of the AR system outweigh its drawbacks? Is the perception of the augmented scene strenuous to the eyes and the user? Does it help to ease or speed up tasks? Does the AR system enable handling of tasks that were unapproachable before? Are the costs appropriate? Studies that answer these and other user-related questions ultimately decide if the system is a success and research and development can continue or if the system and with it its approach fails.
Various AR projects are being pursued as the interest in AR technology is growing. Faster computers and better displays are making AR more practical and affordable. In the medical arena, under the paradigm of computer aided surgery, augmented reality systems are being researched and developed to support image guided interventions by mapping medical data di-rectly onto the patient’s body. The term in-situ visualization describes this scenario well: an-atomical structures are being displayed at the location where they actually are. The physician can see beyond the surface, the patient’s body becomes transparent for him. This is the most direct and intuitive way of presenting the medical image information. One of the most important requirements for an AR guidance system in the medical field is a very high precision for the augmenting graphics at all times. But then, compared to other AR fields, the environment is controllable, local, and confined. Besides technical challenges, acceptance factors include the possibility for sterilization of the device, the ease of use for the surgeon or interventionalist under time pressure, patient safety, and the reliability of the system.
Besides the three fundamental AR technologies of visualization, registration, and tracking,
medical imaging is the forth enabling technology for an Augmented Reality guidance system in
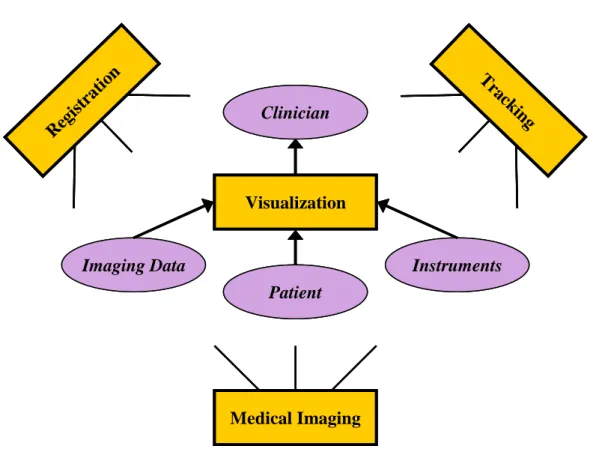
the medical field. To build a system that can guide a physician during an interventional procedure, the exact internal location of the patient’s anatomy has to be known to the system. Medical images, such as from computed tomography, diagnostic ultrasound, and other modalities are the source for the virtual graphics that a medical AR system will use to augment the real patient and to guide the physician. Figure 2.3 illustrates those technology modules. It is the powerful combination of these four enabling technologies that will make AR a valuable tool in the future of interventional image guidance.
2.3
Medical Imaging
The twentieth century brought a multitude of inventions and discoveries that revolutionized clinical medicine. Until then the only investigative tools that were available were the microscope,
Visualization Medical Imaging Clinician Imaging Data Patient Instruments Reg istr atio n T rack ing Visualization Medical Imaging Clinician Imaging Data Patient Instruments Reg istr atio n Reg istr atio n T rack ing T rack ing
Figure 2.3: Schematic illustration of the four enabling technologies for the development of an interventional augmented reality guidance system.
the thermometer, the knife, and the stethoscope. Basically no means existed to examine and study the hidden interna of the living human body. All knowledge had been gained from centuries of careful anatomical studies of the dead and functional deficits of the injured and diseased. It was on November 8, in 1895, when Prof. Wilhelm Conrad R¨ontgen’s discovery of the x-ray at his laboratory in W¨urzburg, Germany, started a revolution in medical imaging and with that a process that reunified medical science with the sciences of physics, chemistry, and engineering [Guy00]. The development of medical imaging technologies is exemplified in Figure 2.4, which shows R¨ontgen’s first radiograph next to a volume-rendered three-dimensional view of a modern CT scan of a hand. Some basic knowledge of the technology and application of existing medical im-aging devices is necessary to understand their capabilities as well as limitations and shortcomings if utilized for interventional image guidance on their own, but also to grasp their potential as an enabling technology for AR research. The following sections will give background information on state-of-the-art medical imaging technologies, which are an essential asset in developing an AR interventional guidance device.
Figure 2.4: Development of medical imaging technologies. Left: First radiograph taken by R¨ontgen of his wife’s hand in 1895. Right: Modern CT scan of a hand taken with a Siemens SOMATOM Sensation 64 scanner.
2.3.1
X-Ray Imaging and Fluoroscopy
X-ray imaging is based on the physical property of biological tissue of being partially translucent with respect to x-ray photons. The notion of the existence of photons goes back to work by Planck (1889) and then Einstein (1905), whose ideas built the fundamentals for a theoretical framework presented by Heisenberg and Schr¨odinger in 1926, which came to know as Quantum Mechanics. This name stems from the fact that the exchange of energy between atoms and light can only take place in discrete lumps. It is well known now that with the photoelectric effect, when monochromatic light is used to eject internal electrons from isolated simple atoms, the kinetic energy of the ejected electrons is constant, independent of the intensity of the light source. Those fundamental complex interactions could be explained based on individual encounters between particles and their exchange of energy.
The relative number of photons, emitted from an x-ray tube, that traverse a patient’s body undeviated by interactions with atoms of the body is the measure that is used for medical imaging with x-rays. A well-defined beam of photons is attenuated by an amount characterized by two numbers, the Mass Attenuation coefficient for the tissue concerned and the path length of the beam within the patient. Different types of tissues, such as bone, muscle, and fat, differ in their Mass Attenuation coefficient, which eventually leads to a very specific overall attenuation of the x-ray beam when it exits the body. The x-ray photon absorption within the body is dominated by the photoelectric effect. The tissue atoms absorb energy from the x-ray photon, which leads to a disruption of the atomic structure, and charged electrons get ejected into the surrounding
Figure 2.5: Left: A state-of-the-art x-ray imaging device of the C-arm type with flat-panel detector (Siemens AXIOM Artis dMP)—used for fluoroscopy, angiography, and interventional procedures. Right: Two-dimensional projection radiograph of the wrist.
space. Those lose their energy to the nearby tissue by creating more ions and free radicals in a cascade. It is obvious that this ionizing radiation itself poses a health risk in the long-run if applied in uncontrolled doses. But it is known that the advantages of well defined and protocolled diagnostic x-ray imaging to assess and analyze a patient’s conditions outweigh those risks significantly.
A modern x-ray tube of a medical imaging device uses the same basic principle that R¨ontgen employed in 1895: Electrons that are accelerated in a cathode ray tube hit the target anode with a kinetic energy of 30–150keV, which is converted into heat and a broad spectrum of electromagnetic radiation that includes x-rays. In projection radiography, or simply x-ray
im-aging, the x-rays, which traverse the body and get attenuated depending on the different types
of tissue and bone, are captured on photographic film or some kind of receptor on the opposite side of the patient. This two-dimensional projection image has a big diagnostic value. For the diagnosis of hard tissue, such as bones, a high energy photon source is used. Soft tissue organs, such as the lungs, are captured with a less-penetrating x-ray beam.
Real-time x-ray images of a patient’s anatomy are obtained by fluoroscopy. The name stems from the first devices for that purpose, where the patient was placed in between an x-ray tube and a fluorescent screen. The room had to be darkened since the quality of those images was much inferior to that of x-ray film, especially also since the overall radiation dose to the patient has to be kept low. The development of x-ray image intensifiers in the 1950s made the use of fluo-roscopy feasible for use under normal lighting conditions and to record the fluofluo-roscopy images on camera. Modern devices for fluoroscopy employ x-ray image intensifiers and CCD cameras
Figure 2.6: Left: Computed Tomography (CT) scanner (Siemens SOMATOM Definition). Right: Reconstructed 2D cross-sections of the head: coronal, sagittal, and two axial MPRs.
to display the real-time images on a separate monitor screen. Latest developments include the replacement of the intensifier-camera combination with flat panel detectors that are sensitive to x-rays. Figure 2.5 shows a modern x-ray imaging device, which is mounted on a C-arm and can easily be placed around the operating table during interventional and fluoroscopic procedures. Devices of this kind are especially employed for angiographic interventional procedures to visu-alize veins, arteries or heart chambers with x-ray imaging, where a radiocontrast agent (which absorbs x-rays) is injected into the patient’s vessels. A fluoroscope is a very valuable tool during interventional procedures and guides the interventionalist with real-time updates of the patient’s internal anatomy. The drawback is the exposure to radiation to the patient and the physician throughout the procedure.
2.3.2
Computed Tomography
In 1972, Godfrey N. Hounsfield invented and engineered a new medical device, a Computed
Tomography (CT) system, which drew from the known properties of x-rays and the availability
of fast computers (1979 Nobel Prize in medicine). Since then the development of CT systems has continuously progressed and computed tomography has become one of the most important tools in medical imaging. Today it is the gold standard in the diagnosis of a multitude of diseases. The main principle behind current CT systems is an x-ray tube that rotates around the patient with a detector array on the opposite side on the circle. Projections from around the circle are recorded and used to calculate cross-sectional images through the patient’s body by a method
Figure 2.7: Different types of visualization of CT data. Left: Curved multi-planar reformatting of a coronary artery with life-threating calcification. Center: 3D visualization and maximum-intensity projection image of an injured carotid artery. Right: 3D volume rendering of abdomen.
called tomographic reconstruction. Whole body CT scanners (such as the one in Figure 2.6) employ a scanner table on which the patient is gradually moved through the scanner gantry to generate cross-sectional image stacks from the part of the body that needs to be diagnosed. Unlike conventional or fluoroscopic x-ray devices, CT scanners don’t record 2D projection im-ages. In its simplest form a CT scanner just contains a one-dimensional array of sensor elements along the periphery of the circle, capturing the x-rays that fan out from the tube and “slice” through the patient’s body. CT cross-sectional images can only be reconstructed from multiple x-ray projections along the circle. Several cross-sectional images from along the body can be stacked together to generate a 3D volume dataset of the patient’s imaged body part. Once the volume dataset is built, arbitrary two-dimensional slices through this 3D dataset in any angle can be generated by a technique called multi-planar reformatting (MPR). Figure 2.6 shows the most common cross-section types, here of a patient’s head: coronal, sagittal, and axial cuts. Compared to Fluoroscopy, CT does not provide real-time images since the CT images have to be reconstructed from the multiple x-ray projections first.
CT also has many advantages over conventional x-ray imaging. CT images are not projection images and as such eliminate the superimposition of structures outside the area of interest. Fur-thermore, the contrast resolution of CT images is much higher, which allows to distinguish tissue types that differ by less than 1% in physical density. The use of multi-planar reformatting and 3D rendering techniques allows viewing 2D images and 3D volumes from any arbitrary direction, once the complete body part has been scanned. Figure 2.7 shows examples of different types of visualization and rendering techniques of volume data, which was acquired by CT.
CT research and development has mainly focused on scan speed, image resolution, and multi-slice scanning, where multiple multi-slices are acquired in a single rotation by means of a detector array with multiple parallel detector rows. Combined with a spiral scanning technique (with a continuously moving scanner table), which mostly replaced the former sequential acquisition method, CT scanners have become very fast, with a total scan time of a few seconds, and deliver high-resolution volumetric datasets with isotropic voxels in the sub-millimeter range. Latest developments include the introduction of a dual-source CT scanner (example shown in Figure 2.6), which comprises two x-ray tubes and two detector arrays on the same circle, with a 90 degree angle in between.
Due to the great contrast and detail of CT images, CT scanners are used for a multitude of diagnostic assessments, involving all body parts—cranial, chest, cardiac, abdominal, pelvic, and extremities—and body scans in emergency situations. To highlight body structures, such as blood vessels or tumor tissue, which would otherwise blend in with neighboring tissue, contrast material, e.g., intravenously injected iodinated contrast, is used for certain CT scans.
Although a CT scanner is mostly used for diagnostic purposes, it still serves as an interven-tional guidance tool for a few procedures, either inside the gantry (CT Fluoroscopy) or where a
stop-and-go approach can be utilized. An interventional radiologist would, for instance, place
a biopsy needle onto the patient’s body and—in an iterative way—progress the needle forward, move the patient into the scanner gantry, perform a CT scan, move the patient out of the gantry to further advance the needle in the proper direction and so forth.
2.3.3
Magnetic Resonance Imaging
The knowledge gained from the study of nuclear magnetic resonance has led to the devel-opment of a different type of scanner that works without the use of ionizing x-ray radiation. The relaxation properties of excited hydrogen nuclei in fat and water are the key elements for
Magnetic Resonance Imaging (MRI). The first whole body scanners were build in the late 1970s.
Following a sequence of developments and speed-ups, MRI found its way into clinical practice in the 1980s.
MRI is based on the interaction of static and gradient magnetic fields. The most visible part of an MRI scanner is usually its long bore hole which contains powerful magnets to create a strong uniform magnetic field in its center (see Figure 2.8). Sometimes other constructions can be found, usually with weaker magnetic fields, such as open magnets with easier access for interventional purposes. Common field strengths of MRI scanners lie between 0.3 and 3 Teslas. Stronger magnetic fields result in better image quality. The spins of the atomic nuclei of
Figure 2.8: Left: Magnetic Resonance Imaging scanner (Siemens MAGNETOM Avanto). Right: Sagittal cross-section of the head.
the tissue with non-integer spin numbers align either parallel or anti-parallel with the magnetic field. Due to the strong thermal energy of the tissue only one in a million nuclei follow this alignment, which is enough to detect a change in field, considering the vast amount of nuclei in a small volume. Exposing the tissue to pulses of electromagnetic energy (radio frequency pulses) in a plane perpendicular to the static magnetic field of the scanner causes some of the aligned hydrogen nuclei to temporarily move into a non-aligned high-energy state. After the RF excitation, those nuclei relax and realign while emitting energy. The emitted energy rate is recorded and provides information about the environment of the nuclei. The discrete Fourier transform is used to create images from the acquired data. Three different time constants during this relaxation process are of major interest, they are termed T1, T2, and T2∗
and describe the time it takes the spins to reach a certain state after an RF pulse. Weighting the signal by T1, T2 or T2∗
, and no relaxation time (proton-density images) leads to the image contrast suitable to distinguish different tissue structures. For certain applications, a paramagnetic contrast agent is administered to the patient (orally or intravenously) to highlight certain anatomical structures.
An obvious advantage of MRI over CT or x-ray imaging is its use of non-ionizing RF signals to acquire images and thus its lack of harmful x-ray radiation. MRI and CT scanners can both reconstruct three-dimensional datasets or multiple two-dimensional cross-sections of the imaged body part. But MRI has a wide set of properties that can be utilized to generate image contrast (T1, T2, etc.), whereas CT images solely rely on a single x-ray attenuation attribute. Specific to the application, MRI scanning parameters can be adjusted to enhance contrast in certain tissue types. Another, but these days less restricting, advantage of MRI is its ability to generate
cross-sectional images in any plane. CT images are acquired in an axial or near axial plane (by tilting the gantry). Nevertheless, the ability to acquire isotropic volume data with modern multi-slice CT scanners allows for reconstruction of 2D cross-sectional images in any plane with maximum image quality by means of multi-planar reformating. The advantages of CT are its fast scan speed (a few seconds compared to several minutes for MRI), its cheaper price (and thus its availability), in general its spatial resolution (down to 0.3mm isotropic voxel size versus 1mm with MRI) and its comfort (patients feel often claustrophobic when lying inside the MRI bore hole for several minutes or even up to an hour, depending on the exam).
Applications for MRI revolve around soft tissue exams. The superior contrast resolution of MRI compared to CT allows to distinguish pathologic tissue, e.g., a brain tumor, from the surrounding normal tissue. CT is the better tool for dense tissue exams (e.g., bone), contrast agent enhanced coronary artery imaging (due to its high spatial resolution and sensitivity to calcifications), and similar applications. Different MRI applications are targeted with specifically adjusted pulse sequences. They include Diffusion MRI, which is particularly good for the diagno-sis of diseases like Multiple Sclerodiagno-sis and in stroke patients, Magnetic Resonance Angiography for the detection of stenosis and aneurysms in arteries, Functional MRI to measure fast signal changes in the brain due to changing neural activity, and other techniques.
Because of the lack of x-ray radiation, MRI is well suited to guide interventional procedures. MRI images can be used to guide a minimally invasive procedure intraoperatively or interactively without harming the patient or the operator. To give the operator access to the patient, usually an open bore scanner must be utilized, which has a weaker magnetic field (in the 0.2–0.3 Tesla range). Due to their inferior image quality these types of MRI scanners are not wide-spread. Furthermore, it is important that all tools that will be used within the fringe field of the magnet are MRI compatible, i.e., non-magnetic.
2.3.4
Ultrasonography
Diagnostic ultrasound imaging, also called ultrasonography or just sonography, is a medical im-aging technique that utilizes the properties of ultrasound waves to generate images of internal structures of a patient’s body. This diagnostic use of ultrasound is different to the therapeutic use of ultrasound to treat patients. The latter involves different ultrasound frequencies and higher energy levels. The first use of ultrasound on humans has been reported at the Naval Medical Research Institute in Maryland in the late 1940s. First ultrasound measurements of heart activity were reported at Lund University in Sweden in 1953/54. Research at the Glasgow Royal Maternity Hospital in Scotland in the 1950s led to the first use of diagnostic ultrasound
Figure 2.9: Left: Ultrasound machine (Siemens ACUSON Antares) in use, with the transducer probe placed on a womb of a pregnant woman. Right: Ultrasound image of a liver cyst.
for abdominal studies and laid the foundation for modern ultrasonography, which in the 1960s became the definitive method to study fetal growth and has since been integrated into every other area of medicine.
Ultrasonography is based on pulses of ultrasound with frequencies between 1 and 13 MHz that are generally produced by a phase array of acoustic transducers in a hand-held device, called
probe (see left of Figure 2.9). Parts of the sound wave get reflected when it hits the interface
between different tissue types (acoustic impedance). The reflection is registered by the probe as an echo. The travel time and the strength of the echo are measured to calculate the depth of the tissue interface from the probe and the difference between the two acoustic impedances. Gases or solids within the tissue reflect most of the sound pulse, which makes it difficult to see beyond those structures. Different types of transducer probes are available. A 1D phased array can be used to generate 2D images, such as in Figure 2.9 on the right. To generate 3D volume datasets, probes have been developed recently, that can either “wobble” a 1D phased array back and forth or use a more complicated 2D phased array of transducers.
Ultrasonography can effectively be used to image soft tissue and—due to its affordability—is used in many medical imaging tasks (obstetrics, cardiology, gynecology, urology, intravascular, etc.). Higher ultrasound frequencies (7–15 MHz) provide higher resolution but less penetration and are used for superficial structures (breast, tendons, muscles, ...). Internal organs (liver, kidney, ...) are imaged at lower frequencies (1–6 MHz), which provide greater penetration. A special mode is Doppler ultrasound, which is used to measure the speed and direction of the flow of internal fluids, especially blood, by exploiting variations of the Doppler effect.
disadvantages. Besides being affordable, widely available, and very flexible (can be brought to the patient’s bed), it has no long-term side effects and does not create discomfort. It also generates images in real-time, which allows easy adjustments of imaging parameters with direct feedback. The shortcomings of ultrasound imaging evolve around its inferior image quality and spatial resolution, as well as its difficulties in the presence of bone and gases. Ultrasound images exhibit an inherent noise pattern, known as speckle noise, which is caused by random interference between coherent backscattered waves. Obese patients are usually difficult to image due to the restricted range of penetration of the ultrasound pulses and their absorption by body fat.
Despite its cons, the real-time update of medical information and the lack of x-ray radiation make ultrasound imaging such an interesting and valuable tool for interventional guidance. The update rate of ultrasound images can be very fast; 20 images a second is not an unusual number. Even volume acquisitions with one of the latest 3D probes are fast enough to see a beating hart in three dimensions, hence referred to as 4D ultrasound imaging (3D + time). Nevertheless, the image quality of ultrasonography and the overall lack of spatial information (with a freely moving imaging probe) require a significant amount of training and expertise if used to guide interventional procedures.
2.3.5
Endoscopy
A very valuable tool for the diagnosis of certain illnesses and the guidance of minimally invasive procedures has been the endos