Implementation of Adaptive
"E-School" System
S. Tosheva
1, N. Stojkovikj
2, A. Stojanova
2, B.Zlatanovska
2, C. Martinovski Bande
21
SOU “Jane Sandanski”, Strumica, R. Macedonia 2
Faculty of Computer Science – University “Goce Delcev”, Krste Misirkov bb, Shtip, R.Macedonia
Abstract – In this paper adaptive learning system
"E-school" is reviewed. The system "E-"E-school" is implemented and tested in the education system in secondary school on the students of first and second year for the subject Informatics. We evaluate average grade on the students in 9 classes before and after using on the system "E-school". The results obtained from the overall testing before and after using the system "E-school" are processed with statistical data analysis. From this analysis we can conclude that the mean success in subject Informatics for students is better after using of E-school system.
Keywords – Educational hypermedia, adaptive
hypermedia, e-learning, Paired Sample T – test, Adaptive and Intelligent Education System.
1. Introduction
Web-based education currently is actual area of research and development. The benefits of web-based education are: independence of classroom, independence of the platform and maximum objectivity. Web courses are installed and supported in one place. These courses can be used by thousands students who are connected on Internet from the whole world.
During the last 20 years , numerous research teams have implemented various types of adaptive and intelligent systems for remote web-based education. One area from the Adaptive and Intelligent Education
DOI: 10.18421/TEM62-21
https://dx.doi.org/10.18421/TEM62-21 Corresponding author: Natasha Stojkovikj,
Faculty of Computer Science – University “Goce Delcev”, Shtip, R.Macedonia
Email: [email protected]
© 2017 S. Tosheva et al; published by UIKTEN. This work is licensed under the Creative Commons Attribution-NonCommercial-NoDerivs 3.0 License.
The article is published with Open Access at www.temjournal.com
System (AIOS) which is of interest for research and development are the Intelligent Tutoring systems [2]. The purpose of these systems is to use the knowledge in a certain domain, knowledge of the students and teaching strategies for flexible individualized learning. Brusilovsky [2] identified three main cores of technology which use intelligent tutors: sequencing of learning curriculum, intelligent analysis of the students' decisions and support of interactive solving of the problem. The first web-based learning systems with intelligent tutors were published in 1995 - 1996 [3-6].
The goal of sequencing of the learning curriculum (also known as technology of teaching planning) is to provide the most acceptable individual series of lectures for the student and to determine the sequence of the learning tasks (examples, questions, problems, etc.).
A classic example is the system BIP [2-7]. Sequencing of the learning curriculum is currently the most popular technology in web-based Adaptive and Intelligent Education System. That sequencing of learning curriculum can be active and passive. Some of the better known active systems for sequencing of the learning curriculum are: ELM-АРТ-II, AST, ADI, ART-Web, ACE, KBS-Hyperbook, ILESA, Manic, Medtec, DCG, InterBook and KBS Hyperbook, SIETTE [9 – 11]. The following systems use passive sequencing: InterBook, PAT-InterBook, CALAT, VC Prolog Tutor and Remedial Multimedia System [7,8].
In this paper, an application that represents adaptive learning system is displayed. The results obtained from testing on the system in secondary education are analysed. The adaptive system "E-school" is implemented and tested on the students of first and second year for the subject Informatics in secondary school "Jane Sandanski" in Strumica. At the beginning of the paper, a brief introduction for adaptive hypermedia is given. After that, we describe the web application "E-school". The application contains adaptive characteristics, i.e. the student has possibility to adapt some features of the system, to follow the lecture and the other content set by teachers. We describe the architecture of the system and we give some of its main characteristics.
Our main goal is to see whether by using the system "E-school" by students, they will overcome the material from the subject Informatics and improve their average grades.
For this purpose, average grade on the students in 9 classes before and after using of the system "E-school" is evaluated. Based on the obtained results from statistical processing of data in the statistical package SPPS, using the parametric Paired Sample T - test was performed. With this test, by comparing the average grade of students before and after using the system "E-school", we can concluded that the average grade of the students after using the "E-school" is increased.
2. Adaptive hypermedia
By the term educational hypermedia, we understand different hypermedia systems that are designed for use in educational system and they have the ability to adapt on the needs of the users. These systems can adapt the displayed information and their presentation, and provide dynamic support for navigation through the material.
One area of particular interest in adaptive educational systems is the hypermedia. By this technique, learning systems are able to identify individual users’ needs and based on these needs to adapt the learning curriculum. Such systems are also able to adapt content, and this ability for adaptation to the needs of the individual user can significantly improve the teaching process, because it was shown that the best method of teaching is individualized tutoring [1].
Adaptive hypermedia systems have the following characteristics [10]:
• are based on the hypermedia;
• include domain model, which is composed of a set of basic parts of knowledge and their relationships in the information space;
• maintain explicit model of the user which records the characteristics for individual users;
• can adapt some visual or functional parts of the system according to the model of the user.
Figure 1. Adaptive system
In Figure 1. is given the adaptive system and the relation between domain knowledge and user knowledge.
Domain Model
One of the most important components of the adaptive system is the domain model. The domain knowledge is divided into small elements, concepts or lessons. Each element is a fragment from the basic knowledge for the given domain. These elements can be named differently in different system: concepts, knowledge items, topics, knowledge elements, learning objectives, learning outcomes. However, in all cases they denote elementary fragments of domain knowledge or information. Depending on the domain, the application area and the choice of the designer, concepts can represent larger or smaller pieces of domain knowledge [14].
Depending on the area, the area of application, as well as the choice of the designer, the elements of knowledge can represent larger or smaller pieces of domain knowledge. The set of these elements forms a model of the domain. The simplest model of the domain is when the elements (concepts) are independent from each other. This model is called set model or vector model, since the set of concepts has no internal structure. In one more advanced form of domain model, the concepts are connected to each other thus forming a semantic network. This network represents the structure of the domain covered by a hypermedia system. This kind of model is known as a network model (Figure 2.).
Figure 2. Network model
Two concepts of the domain are connected, when we need to know the first concept to understand the other concept. Hence, the user can start with learning the second concept only when the learning of the first concept is finished.
The most popular kind of links in adaptive system are prerequisite links between the concepts. A prerequisite link represents the fact that one of the related concepts has to be learned before another.
Prerequisite links are relatively easy to understand by authors of educational systems and can support several adaptation and user modelling techniques. In many adaptive systems, prerequisite links are the only kind of links between concepts. Other types of links which are popular in many systems are the classic semantic links, "is-a" and "part-of" [15].
All concepts of the domain are named and with their relations form ordered acyclic graph, that is used for modelling the domain. Figure 3. illustrates such a graph, and we call this graph, concepts graph of the domain.
Figure 3. Concepts graph of the domain A. User Model
One of the most important functions of the domain model is to provide a framework for representation of the user’s domain knowledge. The user model describes the characteristics of the users. In this model, specific information for each user is collected [5]. Using the user model, the system can make difference between users and can make adaptation to the needs of the individual users [12]. Because we review educational system, the essential information that is stored in the model of the user is knowledge of the user for the educational domain. This information is continuously collected in the learning process through user interaction with the system. To present the model on the user, the model of the teaching domain is used. Therefore, the model of the user is based on the model of the domain and the same presentation can be used for both models.
The model of the user keeps the value for each domain concept, which expresses the knowledge of the user for that concept.
B. Representation of domain knowledge
In the previous section, we saw that there are two kinds of relations between the concepts of the domain. It is possible an essential relation for prerequisite to exist between two concepts to a certain extent, so we describe it as an undetermined relation [13]. Relation for supported prerequisite is always defined and we describe this relation as a
clear determined relation. Since the essential relations with prerequisite is defined as undetermined therefore the graph of concepts for the domain is also undetermined structure.
Graph of concepts for the domain that is given in Figure 3. represents that kind of undetermined structure, where the dotted lines represent undetermined relations.
C. Representation of user knowledge
Because user knowledge is a subset of the domain knowledge, for describing the user knowledge, domain knowledge is used. Overlapping over the domain model is used, so the model of the users can be considered as a subgraph of concept graph of the domain. For every concept in subgraph some additional properties were added and these properties explain the knowledge of the user for this concept: there are three functions for three sets - unknown, known and learned concepts. As a result, the undetermined graph with undetermined relations and undetermined nodes are the basis for presenting the knowledge of the user [13].
In Figure 3., a user model that is overlay model from domain model is given. The user model is a subgraph of concept graph of the domain. Undetermined nodes / concepts in the graph are represented by dotted (grey) circles.
3. Adaptive E-learning system in secondary
education
E-school (Figure 4.) is a web application, which includes adaptable characteristics, i.e. the student has the possibility to adapt some features of the system, to follow the lecture and the other content sets given by teachers. The students can monitor their progress and can improve their progress with greater engagement.
Figure 4. Adaptive system “E-school”
The teacher provides direction for using the system. Students have permanent contact with the teacher via communication tools, therefore the teacher has a
mentoring role for each student. The most important benefit from the system is that the student has complete insight into his progress, because he has the opportunity to test himself, to solve exercises and to work on projects. The teacher can follow the total time that the student spends in the system, the total achievements in learned lesson, tests, and projects. A. Architecture of the system "E-school
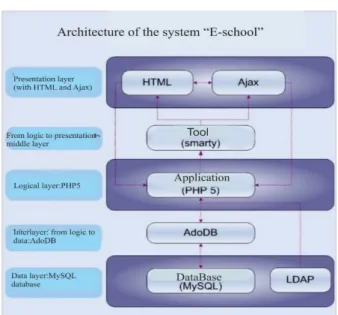
After that, the architecture of the system "E-school" is given (Figure 5.):
• The application is represented by HTML - the standard markup language for creating web pages and Ajax (Asynchronous JavaScript and XML) - methods for Web development, which are used on the client-side to create interactive Web applications. With Ajax, web applications can send data to and from the server asynchronously (in the background) without interfering with the display and behaviour of the existing page.
• Intermediate layer between logical and
presentation level using a tool template called Smarty (written in PHP), which allows the appearance of the Web page to change depending on special tags in the document. • The logical layer consists of the application
written in PHP5.
• Interlayer that is connected with the data at the lowest level used Ado DB (library for PHP and Python), based on the same concept as ActiveX Data Objects at Microsoft. It enables the user to develop applications that are very stable, independently of the manner of data storage.
• At the lowest level are the physical files - databases (in MySql), which are stored on the server. LDAP (Lightweight Directory Access Protocol) is used as standard format for data interchange that conveys directory content as a set of records (one record for each object or entry).
The application is implemented in PHP 5, and its structure is given in Figure 6. From Figure 6., we can see that the core of the application consist of different types of classes (users, courses, lectures, tests, projects...). At higher level are modules as Forum, Chat, social network and other program components, which are used to make the process of learning easier. At the lower level are the external libraries, which are used by the application.
We need to note that the system "E-school" uses current web technologies that provide greater
efficiency. The following technologies and standards are used: Smarty, AJAX, LDAP, Unicode, SCORM, n-tier architecture, MODULAR extensions, CSS and DTD.
Figure 5. Architecture of the system "E-school”
E-school works on the Linux, Windows and any other operating system that supports PHP and MySQL 5.1.
Figure 6. Structure of the application
B. Adaptability of a system
The E-school system continually follows the progress of each student and if necessary appropriate changes are done in the database.
When the student visits some lectures, he has the following options: if the student has already visited this lecture, then he will be redirected to his "tree of
lectures". If the student has never visited this lecture, then his role is initialized as student for this lecture.
Group of users can have common characteristics, for example: the students from the same class or the students who participate in competition, then some
lectures need to be available only for them and not for the others students. For this reason, the administrator can assign an access key available only for this group.
Figure 7. Parameters for setting on test
During the process of learning the material, the student has the possibility to mark the already passed material. There are markers for current user and current lecture that can help student to have better review of the passed lecture, in case the student wants to reopen the same material again.
When a student reopens the same material, i.e. returns to the marked position in the unit, he is able to continue learning the notion from the lecture. Also, there is possibility for the student to search the exact lecture according to given criteria, in this case the system verifies the user’s role to determine the privileges that it has.
C. Working with tests
The system gives a possibility to students to check their knowledge using tests. This is one of the most useful possibilities of the system to check students’ knowledge. The student can make the same test more than once and can see the results from the testing and also answers of all the questions. The teacher has a complete control of student’s work, the total time that the student spends for testing, statistical processing of data for the test and average grade of the test. Thus, the teacher can see weaknesses in students’ knowledge and correct these weaknesses.
One of the main problems is the choice of questions for the test. The question can be from several types: multiple choice (where more than one answer is correct), short-answer, true / false, fill-in-the-blank and matching questions. (Figure 7)
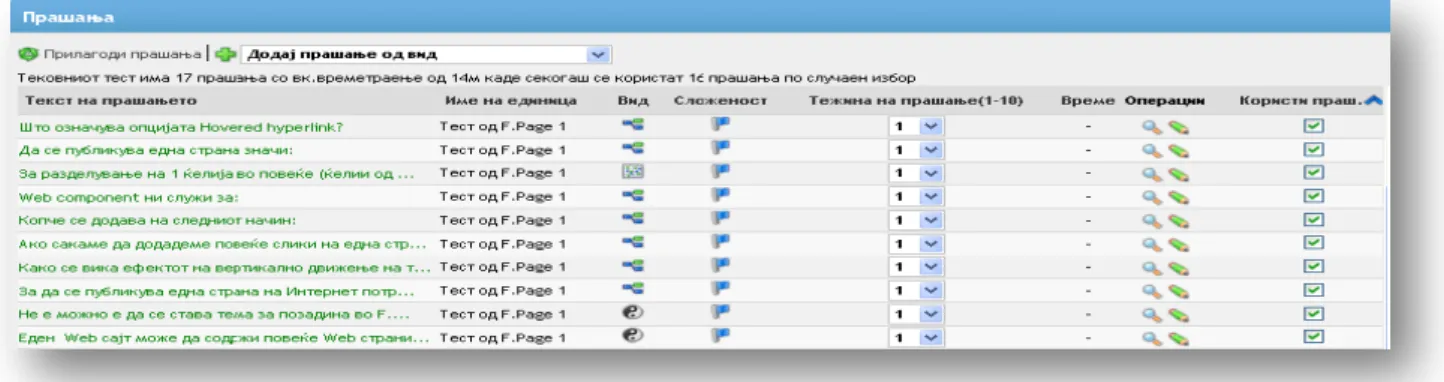
Also, there is an option for random choice of questions and each test will be consisted of different questions (Figure 8.). In this case, the user can answer different tests from the same content.
Figure 8. Choice of random test D. Users of the system
Users in the E-school system are: administrator, teacher and students. In the system can be created others types of users which are based on one of the three basic types and their characteristics are defined by the administrator.
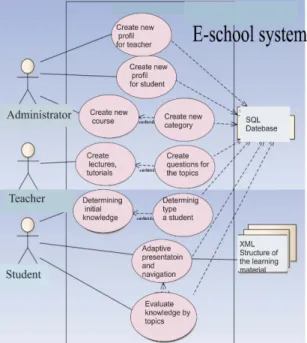
In Figure 9, UML diagram for the interaction of users with the system is given.
On the previous diagram, we can see the interaction of three basic types of users with the system. Administrator creates profiles, courses, classes and he sets the parameters for the whole system.
Figure 9. UML diagram for the interaction of users with system
Professor sets lectures, tutorials, assignments, questions that are stored in the SQL database.
Student with adaptive presentation and navigation can follow the lessons and solves given tests and assignments. Each parameter for his profile is stored in the folder for each student, Figure 9.
E. System’s interaction
E-school system allows interactive communication with the user, where his progress in learning is indicated in percentages. Firstly, when the user logs in for the first time on the course, the percentage of knowledge is 0. The student can solve the thematic test from the beginning if he has advanced foreknowledge. In case he passed the test, the teacher may provide new contents that would be recommended for the student about his individual progress, without depending on how the other students have advanced in the course. This is especially important, because in the classical classroom, talented students have to adapt to the environment and they don`t have conditions to develop their talent, except on the additional classes teaching. In such a manner, the teacher can identify those students who don`t want to be separated from the environment or they are too modest and still possess above-average abilities.
As for the other students, their interaction with the system is in accordance with their desires for learning and their advancement. Any progress can be observed by reading material divided into units, according to the curriculum. In the materials are found tutorials that visually and auditory attract the user's attention
and demonstrate concrete implementation of a specific tool. E-school system was applied to students of first and second year. During the last quarter (from March to June), students obtain tasks to visit adaptive system E-school every day, to adapt the system to their needs, to work interactively in order to successfully complete the obligations of the subject Informatics (in first year) and Information technology (in second year). In the survey, 135 students from the first year and 150 the second year are included.
Although the empirical results are taken by the end on the school year, the system continues to be used by the students of the new school year. Total 600 students had interaction with the system within 9 months and acquired the habit to use it.
4. Statistical analysis
In the next section we will provide statistical analysis of the results obtained for the average grade of students before and after using the E-school system. For statistical analysis and data processing we used the statistical package SPSS.
The E - school has been applied to 285 students from the High School "Jane Sandanski".
Statistical data analysis will be processed 1. First by Descriptive Statistics (with SPSS), 2. Second by Frequency Distribution (with SPSS)
and
3. Third by using independent Samples t-Test (with SPSS package).
The descriptive statistics for students before using of "E-school" system is given in the following Figure 10.:
Descriptive Statistics
N Min. Max. Mean Std.
Deviation
Before 285 1 5 4,14 ,890
Valid N 285
Figure 10. Descriptive statistics before using of "E-school" system
From Figure 10., we can see that the number of tested students is 285. Each student can get the minimum grade 1 and the maximum grade 5. The average grade of the students was 4.14 with a standard deviation 0.89 which is very low.
Descriptive Statistics
N Min. Max. Mean
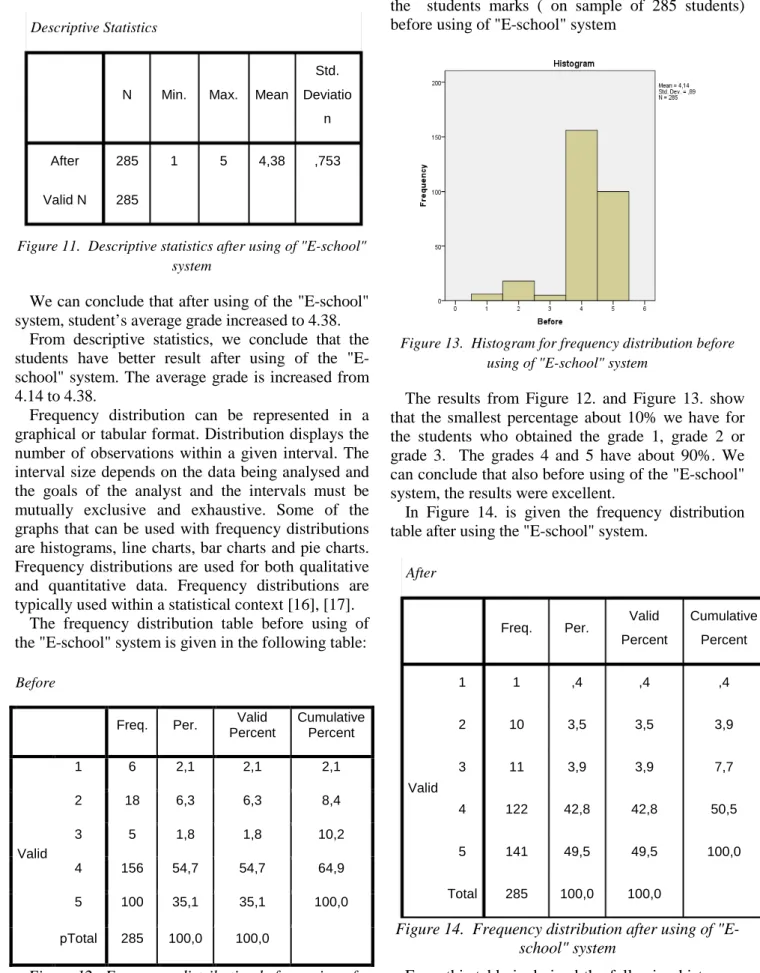
Std. Deviatio n After 285 1 5 4,38 ,753 Valid N 285 After
Freq. Per. Valid
Percent Cumulative Percent Valid 1 1 ,4 ,4 ,4 2 10 3,5 3,5 3,9 3 11 3,9 3,9 7,7 4 122 42,8 42,8 50,5 5 141 49,5 49,5 100,0 Total 285 100,0 100,0
In Figure 11. is shown the descriptive statistics of students after using of the "E-school" system.
Figure 11. Descriptive statistics after using of "E-school" system
We can conclude that after using of the "E-school" system, student’s average grade increased to 4.38.
From descriptive statistics, we conclude that the students have better result after using of the "E-school" system. The average grade is increased from 4.14 to 4.38.
Frequency distribution can be represented in a graphical or tabular format. Distribution displays the number of observations within a given interval. The interval size depends on the data being analysed and the goals of the analyst and the intervals must be mutually exclusive and exhaustive. Some of the graphs that can be used with frequency distributions are histograms, line charts, bar charts and pie charts. Frequency distributions are used for both qualitative and quantitative data. Frequency distributions are typically used within a statistical context [16], [17].
The frequency distribution table before using of the "E-school" system is given in the following table: Before
Freq. Per. Valid
Percent Cumulative Percent Valid 1 6 2,1 2,1 2,1 2 18 6,3 6,3 8,4 3 5 1,8 1,8 10,2 4 156 54,7 54,7 64,9 5 100 35,1 35,1 100,0 рTotal 285 100,0 100,0
Figure 12. Frequency distribution before using of "E-school" system
From this table is derived the histogram shown on Figure 13which presents the frequency distribution of the students marks ( on sample of 285 students) before using of "E-school" system
Figure 13. Histogram for frequency distribution before using of "E-school" system
The results from Figure 12. and Figure 13. show that the smallest percentage about 10% we have for the students who obtained the grade 1, grade 2 or grade 3. The grades 4 and 5 have about 90%. We can conclude that also before using of the "E-school" system, the results were excellent.
In Figure 14. is given the frequency distribution table after using the "E-school" system.
Figure 14. Frequency distribution after using of "E-school" system
From this table is derived the following histogram (Figure 15.) which presented the depending of the percentage from data for the number of students (in
Paired Samples Test Paired Differences Mean Std. Deviation Std. Error Mean 95% Confidence Interval of the Difference Lower Upper Pair 1 After - Before ,232 ,578 ,034 ,164 ,299
Paired Samples Test
t df Sig. (2-tailed)
Pair 1 After -
Before 6,770 284 ,000
our sample 285 students) after using the "E-school" system.
Figure 15. Histogram for frequency distribution after using of "E-school" system
The results from Figure 14. and Figure 15. show that the smallest percentage about 7% we have for the students who obtained the grade 1, grade 2 or grade 3. The grades 4 and 5 have about 90%. We can conclude that the results after using the "E-school" system are better than the results before using the "E-school".
Before using the system, 6 students had grade 1 and after using the system their number is decreased to only 1. Also, the grade 2 before using the system had 18 students and after using the system their number decreased to 3. Number of grades 3 increased from 5 to 11. Number of grades 4 decreased from 156 to 122 but we can conclude that number of 5 increased from 100 to 141.
The next test refers to the thesis whether there will be improvement of the average grade of the students before and after using the "E-school" system and for that purpose we set the following hypotheses:
H0: µ0 = µ1
• Null hypothesis, there is no difference between the average grade of students before and after using of the “E-school" system.
.
Hа: µ0 ≠ µ1
• Alternative hypothesis, there is a
difference between the average grade of students before and after using of the "E-school" system.
We examine the stated hypothesis with Paired Samples t-Test. The obtained results are:
The value t for students from the technical faculty 1 is t (111) = 2.795 with 95% confidence interval. The significance level for the t-test is 0.05 and a degree of freedom is 284. From the table for t-test we are reading its value or t (0.05; 300) = 1,97. Because t (t
(285) = 6.770> 1.97, we can conclude that we reject the null hypothesis. This means that there is a significant difference between the average grade of students before and after using of the "E-school" system (Figure 16.)
Figure 16. Results of Paired Samoles T- test
5. Conclusion
Web based education is currently popular as promising area for research and development. The advantages of web-based education are: classroom independence, independence of platform and maximum objectivity. Installed web courses can be used by thousands of students worldwide who only have Internet connection on their computers. From the statistical data we can conclude that the mean success in subject Informatics for students of I and II year is better after using of the E-school system. It is generally accepted that information and communication technologies help in the reorganizing the learning process. Instead of reproducing the facts students became active participants, analyst and problem solvers capable for self-learning.
References
[1] Haykin, R. S. Alpert, Singley, M. K., and P. G. Fairweather, “Deploying Intelligent Tutors on the Web: An Architecture and an Example”, International Journal of Artificial Intelligence in Education 10, pp. 183-197, 1999.
[2] P. Brusilovsky, P, “ Methods and techniques of adaptive hypermedia”, User Modeling and User- Adapted Interaction 6, 2-3, pp. 87-129, 1996.
[3] K. Anjaneyulu, “Concept Level Modelling on the WWW. ”, In Proceeding Of Workshop "Intelligent Educational Systems on the World Wide Web" at AI-ED'97, 8th World Conference on Artificial Intelligence in Education, Kobe, Japan, ISIR, Brusilovsky, P., Nakabayashi, K. and Ritter, S. (eds.) pp.26-29, 1997.
[4] P.Brusilovsky “,Intelligent tutoring systems for World-Wide Web”, In: Holzapfel, R. (ed.) Proc. of Third International WWW Conference (Posters), Darmstadt, Fraunhofer Institute for Computer Graphics pp. 42-45, 1995.
[5] P. Brusilovsky, and L. Pesin, L, “An intelligent learning environment for CDS/ISIS users”, In: Levonen, J. J. and Tukianinen, M. T. (eds.) Proc. of The interdisciplinary workshop on complex learning in computer environments (CLCE94), Joensuu, Finland, EIC , pp.29-33, 1994.
[6] P.Brusilovsky, P, S.Ritter and E. Schwarz,
“Distributed intelligent tutoring on the Web”, In: du Boulay, B. and Mizoguchi, R. (eds.) Artificial Intelligence in Education: Knowledge and Media in Learning Systems. IOS, Amsterdam, pp.482-489, 1997.
[7] E.André, T. Rist, T. and J. Müller, “WebPersona: A Life-Like Presentation Agent for Educational Applications on the World-Wide Web”, In: Brusilovsky, P., Nakabayashi, K. and Ritter, S. (eds.) Proc. of Workshop "Intelligent Educational Systems on the World Wide Web" at AI-ED'97, 8th World Conference on Artificial Intelligence in Education, Kobe, Japan, ISIR , pp.78-85, 1997.
[8] P. Brusilovsky, J. Eklund and E.Schwarz, “ Web-based education for all: A tool for developing adaptive courseware”, Computer Networks and ISDN Systems 30, 1-7, pp. 291-300, 1998.
[9] P.Brusilovsky, “Adaptive educational systems on the World Wide Web”, In: Ayala, G. (ed.) Proc. of Workshop "Current Trends and Applications of Artificial Intelligence in Education" at the 4th World Congress on Expert Systems, Mexico City, Mexico, ITESM , pp. 9-16, 1998
[10] P. Brusilovsky, “Methods and Techniques of Adaptive Hypermedia. Adaptive Hypertextand Hypermedia” Kluwer Academic Publishers, pp. 1 – 43, 1998.
[11] P.Brusilovsky, “Adaptive hypermedia: an attempt to analyze and generalize”, Multimedia,Hypermedia, and Virtual Reality, Springer–Verlag, Berlin., pp. 288 – 304,1996.
[12] H. L. Burns, and C. G. Capps, “Foundations of intelligent tutoring systems” , An introduction. In: Polson, M. C. and Richardson, J. J. (eds.): Foundations of intelligent tutoring systems. Lawrence Erlbaum Associates, Hillsdale, pp.1-19, 1988.
[13] R.Danielson, “Learning styles, media preferences, and adaptive education”, Proc. of Workshop "Adaptive Systems and User Modeling on the World Wide Web" at 6th International Conference on User Modeling, UM97, Chia Laguna, Sardinia, Italy, Carnegie Mellon Online, pp.31-35, 1997.
[14] P.Brusilovskyand E.Millán, “User Models
for, Adaptive Hypermedia and Adaptive
Educational” Springer-Verlag Berlin, Heidelberg. pp.3-53,2007.
[15] P.Brusilovsky, (2012), “Adaptive Hypermedia for Education and Training”, In: Adaptive Technologies for Training and Education. Cambridge University Press, Cambridge, UK, pp. 46-68,2012.
[16] “Frequency Distribution”, available online
at http://www.investopedia.com/terms/f/frequencydi stribution.asp
[17] “Frequency distribution” , available online
at https://en.wikipedia.org/wiki/Frequency_distributi on.