School of Economics and Management Department of Business and Administration FEKP90, Business Administration -
Degree Project Master of Science in Business and Economics Spring term 2011, Lund
The Performance of Private Equity-backed IPOs and the Effect of
M&A-activity – A European Study
Author:
Linus Johansson Tutor:
Title: The Performance of Private Equity-backed IPOs and the effect of M&A-activity – A European Study
Seminar date: 2011-05-24
Course: Master Thesis in Business Administration, 30 University Credit Points (30 ECTS).
Author: Linus Johansson
Tutor: Rikard Larsson
Five key words: BHAR, IPO, Performance, Private Equity, M&A
Purpose: The purpose of this paper is to investigate how private equity-backed IPOs perform once they go public. That is, to investigate whether or not these private equity firms have created highly competitive, high-performance portfolio companies and to see if the portfolio companies are able to retain those qualities even after going public. These results are then to be compared with previous research done on the general IPO and its short- and long-term performance. It also sets out to measure what effect M&A-activity during the fund holding period may have on the fund companies after being exited onto the public market.
Methodology: The performance of the private equity-backed IPOs has been measured as the abnormal return using two methods, cumulative abnormal returns and buy-and-hold abnormal returns. Two types of benchmarks have been used, S&P Europe 350 as well as an industry-specific version of that index.
Literature review: Theories used in this study are based partially on previous research on the private equity industry as well as general IPO-theory, such as long-term underperformance and the “hot issue” anomaly. Some theory has also been used to explain the effects of M&A-activity, with regards to e.g. indigestion.
Empirical foundation: This quantitative study is based on a raw sample of 318 private equity-backed IPOs in Europe during the period 1994-2007. These IPOs outperformed both its industry peers as well as the market with 18.02% and 14.75%, respectively, on a three-year basis.
Conclusions: Private equity-backed IPOs perform abnormal returns, both short- and long-term. This goes against previous research on the general IPO, which outperforms the market short-term and underperforms long-term. However, it is in line with previous research on reversed LBOs.
work than perhaps for master thesis authors in groups of two. I would like to take this opportunity to express a special thank you to lector Jens Forssbaeck, for his efforts in helping me work out the proper method for statistical calculations as well as guidance in the subsequent analysis of those results. His contribution to this study is especially remarkable, as he was not my assigned tutor and thus not obliged to offer any help at all.
Also, a great amount of gratitude is offered to my fellow students, Camilla Åstrand and Ylva Landgren. Without them letting me access the Dealogica database to discern private equity-backed IPOs from non-private equity-backed, this study would not have been possible. The same goes for my other peers, with whom I have spent hours in the LINC – Lund University Finance Society “bunker”. Your help and support whenever I encountered problems have been highly appreciated. Furthermore, a great thank you to LINC – Lund University Finance Society for providing with Datastream and the essential share price information for all the stocks. LINC has also offered the opportunity to visit Ratos AB, one of Sweden’s most prominent private equity firms, and receiving an inside view on the private equity industry.
Lastly, of course, I would like to extend my thanks to my tutor, professor Rikard Larsson, for aiding me throughout this process and for helping me with coming up with a good angle to this study.
1 Introduction
... 6
1.1 Background ... 6 1.2 Issue ... 6 1.3 Purpose ... 8 1.4 Demarcations ... 9 1.5 Audience ... 10 1.6 Disposition ... 102 Methodology
... 11
2.1 Research objectives ... 11 2.2 Research strategy ... 112.2 Quantitative and qualitative data ... 11
2.3 Scientific approach ... 12
2.4 Primary and secondary data ... 12
2.5 Credibility ... 12
2.6 Sample ... 13
2.6.1 Selection of countries and stock exchanges ... 13
2.6.2 Selection of time period ... 15
2.6.3 Selection of candidates and criteria ... 15
2.7 Stock performance and required return ... 16
2.8 The applied benchmarks ... 17
2.9 Measuring abnormal returns ... 18
2.9.1 Cumulative abnormal return ... 19
2.9.2 Buy-and-hold abnormal return ... 19
2.9.3 The skewness-adjusted test statistic ... 20
2.9.4 Multiple regression using dummy variables ... 21
3 The Private equity industry
... 22
3.1 Private equity ... 22
3.1.1 The Business model ... 22
3.1.2 The Fund and its investors ... 23
3.1.3 Acquisitions ... 24
3.1.4 Exit ... 24
3.2 The Swedish private equity industry ... 25
4 Literature review
... 27
4.1 Previous research ... 27
4.1.1 IPOs - How does the average IPO perform? ... 28
4.1.2 IPO activity vs. Private equity-backed IPO activity ... 29
4.2 Capital structure & Leverage ... 30
4.3 Debt-overhang ... 31
4.4 Information asymmetry ... 31
4.5 Jensen’s free cash flow hypothesis ... 32
4.6 Principal-agent theory and agency costs ... 32
4.7 Timing ... 33
4.8 Parenting advantage ... 34
4.9 Bookrunners ... 35
4.10 Market-to-book ... 35
4.11 Mergers and acquisitions ... 36
5 Hypotheses
... 37
5.1 Private equity-backed IPOs vs. S&P Europe 350 ... 37
5.2 Private equity-backed IPOs vs. its respective financial sector ... 37
5.3 Sector specific performance ... 38
5.4 Private equity-backed IPOs and M&A-activity ... 38
5.5 Boom vs. bust performance ... 39
5.6 Market-to-book ... 40
5.7 Bookrunner reputation and firm performance ... 40
5.8 Summary of hypotheses and dummy variables ... 41
6 Empirical foundation
... 42
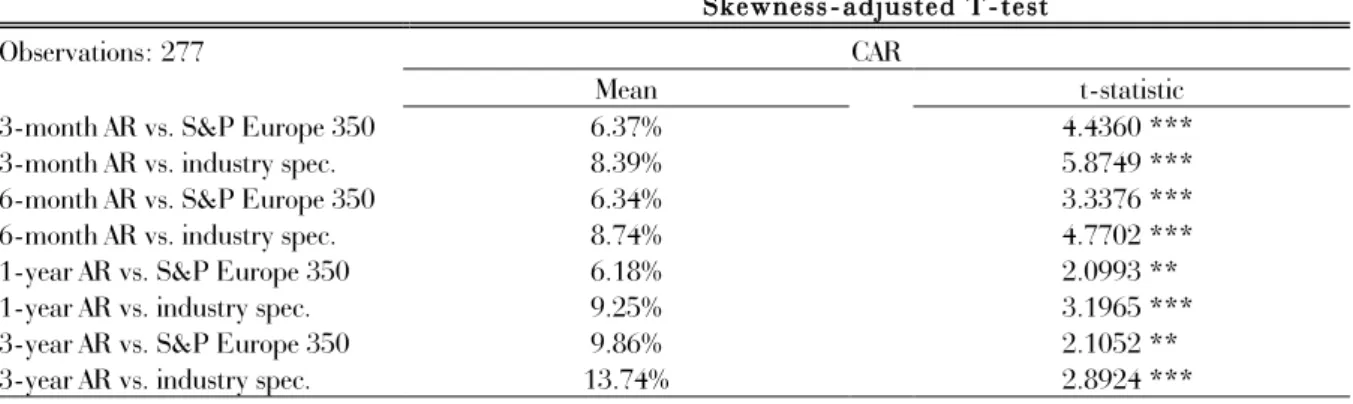
6.1 Skewness adjusted t-test ... 42
6.1.1 Cumulative abnormal returns (CAR) ... 42
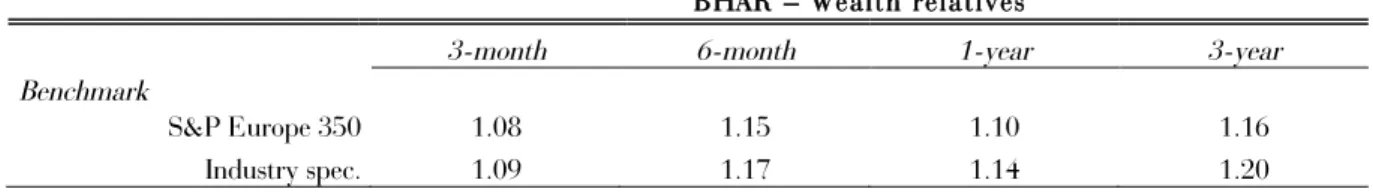
6.1.2 Buy-and-hold abnormal returns (BHAR) ... 42
6.2 Linear regression using dummy-variables ... 43
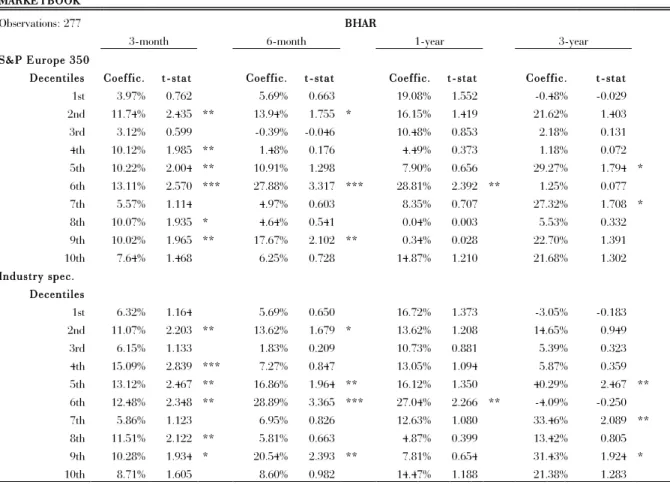
6.2.1 SECTOR ... 43 6.2.2 M&A-ACTIVE ... 45 6.2.3 M&AYEAR ... 46 6.2.4 BOOMBUST ... 48 6.2.5 MARKETBOOK ... 49 6.2.6 BOOKRUNNER ... 52
7 Analysis
... 56
7.1 Private equity-backed IPO performance ... 56
7.1.2 The Relative importance of the sectors ... 57
7.2 M&A-activity ... 58
7.3 Timing – Boom vs. Bust ... 59
7.4 Market-to-book effect ... 60
7.5 Bookrunner reputation ... 61
8 Conclusions
... 62
8.1 Major findings ... 62
8.2 Suggestions on future research ... 63
References
... 64
Appendices
... I
Appendix 1. Table of portfolio companies ... I Appendix 2. Year by year CARs ... VII Appendix 3. Year by year BHARs ... VIII Appendix 4. Companies in M&A regression ... IX Appendix 5. Bookrunners ... XII1 Introduction
Here, the reader will get an introduction to the topic and a statement to as why the subject is worth investigating. The reader will also be introduced to the purpose of this study as well as what it intends to measure and not.
1.1 Background
The private equity industry was initially instigated in the 1940’s but it was not until the 1980’s it really took off (Nyman, 2002). Jensen (1989) even stated that the capital structure of leveraged buyouts (LBOs), a vital part of the private equity business, was superior to any existing capital structure and argued that soon all companies would adopt such a structure. A lot has happened since the 1980’s, then, debt levels around 85 to 90% were not unusual and the slightest upward change in firm value generated a lot of return (Cao and Lerner, 2009). Private equity firms use leverage as a means of financing and today their debt levels are a bit more modest at around 70%, while the average listed company average around 30-50% debt (Unionen, 2009). They use the high leverage to make the most use out of the cheapest source of capital, debt, and the tax-shield that comes with it.
The European private equity industry has not been active for as long as the U.S. equivalent. However, it has today become a vital part of the financial mechanism, attracting foreign capital and enabling European companies with access to the capital market, thus making private equity funds function as a bridge between domestic companies and foreign investors. In fact, of the capital raised in private equity funds globally, more than 65% was invested in European companies during 2003 to 2007. Furthermore, the aggregated private equity industry has grown rapidly over the last few years, with raised funds close to USD 155.73 billion in 2006, up by more than 300% compared to 2004. In absolute terms, the U.K. market is the unquestionable leading market. However, relative to the GDP, Sweden and the Netherlands both raised significant funds (Raade and Dantas Machado, 2008). Criticism has been circling around the private equity industry ever since the first companies were becoming active, arguing that it is value destroying rather than creating and it has become synonymic with lay-offs and downsizing. Private equity companies have also been accused of having a far too short investment horizon, thus being beneficial for no one except the firm behind the acquisition. Moreover, the high leverage of the average private equity acquisition puts, in the eyes of critics, a dangerously high pressure on cash-flow and interest payments and leaves the company with unnecessary high dependence on market changes and default risk. However, private equity firms obviously disagree, stating that they always evaluate the default risk for the acquired firm and then leverage it accordingly. That statement finds comfort in the Swedish Financial Supervisory Authority and its analysis on the lending of Swedish banks to private equity, stating that: “the level of risk was reasonable.” In contrast to the general opinion, private equity firms are certain their restructuring is beneficial for the companies and increases their competitiveness even in the long run, since their intention is to increase the value of the company in order to sell it off with a profit (Unionen, 2009). Furthermore, private equity firms are not the ones with a short investment horizon according to practitioners, as Harald Mix, CEO of the Swedish private equity firm Altor expresses it: ”It is not the private equity firms with an investment horizon of five to seven years that are short-sighted, it is the public market” (Ekelund and Lundell, 2011b).
1.2 Issue
Investing in a private equity fund usually turns out to be a good investment, over time private equity funds have been outperforming the market index by 3-4% (SVCA, 2011). As mentioned earlier it is partly due to the fundamental in the private equity business, high leverage and the use of a large
tax-shield. Debt also increases monitoring through banks, thereby reducing agency and monitoring costs, followed by the added pressure on management and cash flow (Jensen 1986). Furthermore, as the company no longer is traded publically, information asymmetry is more or less non-existing between managers and the equity owners as they are often the same. No attention needs to be diverted to media and focus can instead be directed towards running the firm efficiently. The corporate governance structure of a fund portfolio firm generally differs from the average firm. Attempts of aligning the interests of management with those of stakeholders are more common in portfolio firms than others, having a further positive effect on minimising agency costs (Kaplan and Strömberg, 2008). The private equity firm and its fund managers are also in general specialised in the industry of the acquired firm and thus posses a lot of knowledge useful for optimising the firms strategy. The strategic part of the value creation process has become more and more important, as stated in Mattson and Mårild (2006), internal value creation is today the most important factor for private equity firms. The success or failure of a portfolio firm has increasingly become a matter of improving operational efficiency and less dependent on capital structure. It poses the question if these portfolio firms are better off from having been under private equity ownership and whether or not they are able to maintain these benefits in terms of e.g. knowledge and corporate governance structure in the long run, even after the issuance?
The performance of the general IPO has been studied numerous of times and researchers have discovered multiple anomalies associated with floatings, of which the two most common ones are the under-pricing phenomenon and thus short-run outperformance, and the subsequent long run underperformance. However, given the previously stated advantages with private equity ownership, the private equity-backed firm seems to differ from most companies in many positive respects. One may wonder if these differences are attributable also to the performance of IPOs. Are private equity-backed fund portfolio firms of higher quality than the average floated firm?
Furthermore, the financial strength of a private equity fund also enables for portfolio firms to acquire or merge two or more companies to be added as one to the fund, as the need or opportunity to acquire progresses. This is another example where portfolio firms can profit from private equity funds and its capital injections, offering companies the possibility to acquire e.g. a competitor or a partner in the production chain. The firm can then benefit from synergies and expand its reach to new markets or perhaps lower its costs and risk by having its production chain in-house. However, there are potential problems with merging companies, such as overestimating the synergy potential and problems of indigestion when acquiring too many companies too fast (Bower, 2001). One would wonder whether or not any of these benefits and advantages inherited by the fund firm is kept over the short-, medium- or long-term as well as how the mergers and acquisitions (M&A) activity affects the performance of the exited fund companies. Are firms with high M&A-activity left with problems of indigestion or have they inherited synergy effects they could not have on their own?
The overall problem of the study can be summarised in the following main research questions:
• Do private equity backed IPOs outperform the market over time? • How do M&A-activity within those companies affect the outcome?
• How do the results differ from the performance of the average IPO, studied in previous research?
1.3 Purpose
The way a fund of a private equity firm earns its return is quite straightforward and is achieved by, in some manner, selling one or more companies in its fund at a higher price than initially bought for, denoted as an exit. A company is acquired to the fund either from private owners or public owners. An acquisition from a public company is referred to as a buyout and since the majority of the financing is debt, it is denoted as a leveraged buyout. There are a number of ways for a private equity firm to exit one of its portfolio companies. It could do a trade sale, where the portfolio company is sold off to another company, usually in the same industry. It could also sell the company on to another fellow private equity firm, referred to as a secondary buyout, or it could turn to the public capital market through an IPO (Cao and Lerner, 2009).
Previous research has focused primarily on the average IPO and its performance, where strong evidence has been shown for short-term underperformance and long-term outperformance (Ritter, 1991). Focus has also been directed towards, and somewhat restricted to, leveraged buyouts and the subsequent re-floating, a secondary IPO, referred to as a reversed leveraged buyout (RLBO). Cao and Lerner (2009) and Mian and Rosenfeld (1993) could both show results indicating that reversed LBOs performed positive abnormal stock returns compared to the market. Cao and Lerner (2009) studied the U.S. market during the period 1981 to 2003 and Mian and Rosenfeld (1993) researched 85 RLBOs during 1983 to 1988. Degeorge and Zeckhauser (1993), similarly to Cao and Lerner (2009), studied the performance of RLBOs post IPO on the U.S. market, but with even more focus towards pre- and post-IPO operational performance. This study also intends to measure the short-term stock performance of private equity-backed IPOs, both Mian and Rosenfeld (1993) as well as Cao and Lerner (2009) concentrates on long-term performance. To my knowledge, there have only been a few studies made on the share price performance of the general private equity-backed IPOs and the ones I have found have been fairly limited. Henrysson and Petterson (2007) studied private equity-backed IPOs on the Stockholm Stock Exchange, however, they narrowed their research to focusing only on a few companies. Björcke and Menzel (2006) did a similar study, on a larger sample, but were also limited to the Swedish equity market and long-term performance. Levis (2008) studied the British private equity market, but also concentrated on buyouts similar to Cao and Lerner (2009), as well as venture capitalist-backed IPOs. Thus, there seems to be a gap in the previously conducted research in the field. Either there has been made distinctions on the type of acquisition by the private equity fund, e.g. leveraged buyout, or the studies have focused on other stock exchanges or time periods.
The purpose of this paper is to investigate how firms, previously owned by a private equity firm or syndicate, perform once they go public. That is, to investigate whether or not these private equity firms have created highly competitive, high-performance portfolio companies and to see if the portfolio companies are able to retain those qualities even after going public. In this study I make no distinction between the types of acquisition, only the type of exit, and the intention is to focus on the stock price performance, not the operational. These results are then to be compared to previous research done on the general IPO and its short- and long-term performance. It also sets out to measure what effect M&A-activity during the fund holding period may have on the fund companies after being exited by the private equity funds on to the public market. This paper may be unique in its focus towards M&A-activity during the holding period for the portfolio companies. Hopefully, the study can shed some light on this matter, which has seen little to none attention earlier, and thereby improving the awareness of the issue both for practitioners and academics. It may also be unique in its attempt to cover the larger part of the European Union and thus analysing the aggregated private equity market and private equity-backed IPOs on a European basis.
1.4 Demarcations
Similar to the studies performed by Ritter (1980, 1991), I intend to study both the short-term and long-term performance post-IPO. I will thus test if the previously mentioned anomaly associated with long-term underperformance could be attributed to private equity-backed IPOs as well, and if and how the under-pricing may affect the short-run performance. However I do not intend to investigate the initial day return or under-pricing phenomenon (Ritter, 1991) specifically, only use previous research on IPOs to explain the results in my analysis. There are already studies such as the ones by Ritter (1980, 1991) on the general IPO initial day performance, however, to put these results in context of the private equity-backed IPOs, average initial returns has actually been calculated in table 6. Neither do I have any intentions of measuring the performance of general IPOs during the investigated period. When comparing the results of private equity-backed IPOs to the general IPOs I will instead again turn to previous research for the same reasons. The purpose of this study is to add something new to the foundation of IPO research, by instead measuring the performance of private equity-backed IPOs on an aggregated European basis. However, it is not part of the purpose to measure the operational performance of these firms. Making a comparison of operational performance prior and post private equity ownership would have been interesting. Still, since a sizeable part of all private equity fund acquisitions are of private nature, retrieving information would have proven both difficult and time consuming.
The study does not attempt to investigate any variations in performance based on the characteristics of the private equity sponsor. An idea would have been to test if a sponsor with an international or pan-European reach could have had any effect on the firm’s performance. A sponsor with an international profile could possibly have a positive effect on a portfolio firm, in terms of both knowledge and possibility to enter new markets for the firm. However, the focus of the study needed to be limited somehow and since private equity firms tend to be focused to their own home market to a great extent, with the few exceptions of the largest ones such as 3i and KKR (Kohlberg Kravis Roberts & Co.). Adding to the problem is the small sample I would have been forced to base the variable on, since the sponsor information is dependant the firm existing in the Mergermarket database. With a small sample and skewed distribution of types sponsors, the results could possible have been misguided.
Neither do I intend to study the performance on an exchange specific basis, again chiefly due to the skewness of the distribution. Table 1 illustrates this problem with a heavy sample weight towards the U.K. market. Nor is the single or multiple bookrunner variable part of this study, see Hu and Ritter (2007). This would have been interesting to examine, even more so due to the fact that multiple bookrunner representation is used increasingly over single, especially for private equity-backed IPOs (VCCircle, 2011). However, this field is relatively unexplored so far, it was actually unheard of before the year of 1997 (Hu and Ritter, 2007. The studies I have found on the matter, such as the one by Hu and Ritter (2007), is not related towards stock performance, but rather offer price and firm negotiation power. Also, since part of the purpose of the study is related to the difference between general IPOs and private equity-backed, a focus towards a more thoroughly investigated bookrunner phenomenon, i.e. bookrunner or underwriter reputation (see Carter, Frederick and Singh, 1998) seems more feasible. No attention has been directed towards the relative importance of the deal value of the issuance either. The deal value of most leveraged buyouts, and reasonably public exits by private equity firms, tend to be larger than average (Cao and Lerner, 2009). The suitability for comparing the results to the ones of studies on general IPOs is thus questionable.
potential synergies of an investment of varying size (see e.g. Larsson and Finkelstein, 1999). However, the deal value of the M&As found in Mergermarket was not always specified and the sample for this variable would thus have been even smaller than the sample for the M&A-activity variable actually used in the study, displayed in terms of number of deals.
1.5 Audience
This study focuses on the private equity market and IPOs. The main audience then would have to be students and academics in finance, private equity practitioners or anyone with some interest in the equity capital market. Investors and traders might also find this paper interesting in terms of using the results as part of their trading strategy. Some statistical understanding would be beneficial for the reader when going through the method and results to fully grasp the significance of the results and how the study was performed. However, through providing the reader with background information about the industry, I believe to have broadened the scope of the potential audience, one must not be that conversant with the subject in order to appreciate the work.
1.6 Disposition
The study will continue on with section two, stating the approach of the thesis and describing the methods used and the particularities of those methods. It will also give the reader a good understanding of how the study was practically performed. In section three the novice reader is introduced to the subject and the Swedish private equity industry. The business model is described as well as what major players there are in the Swedish industry. Section four provides the reader with a theoretical frame of reference, explaining the most relevant theories for this subject, to be used in the analysis of the results. These theories are used in conjunction with the purpose to build hypotheses to be answered. The theories will also try to offer an explanation for the results displayed in section six, following the hypotheses. In section seven, the results will be followed by a thorough analysis. Section eight is the final section and summarizes the findings and conclusions that I have been able to draw, as well as poses suggestions for further research.
2 Methodology
This section explains what method was used and describes how data was gathered, what complications that were encountered and provides with reasons for any sample tapering. It also argues for how credibility was ensured.
2.1 Research objectives
The private equity industry has been subject to debate for a long time. Lately the discussion in Sweden has been focused towards taxation and how most private equity companies manage to escape company taxation as well as taxation on portfolio company exits (Ekelund and Lundell, 2011a). However, the dispute regarding whether or not these companies are value destroying and bad for the general public has been going on forever. Critics argue that the investment horizon is far too short and that private equity companies are only in it for the short run capital gain, with lay offs and downsizing as a result. With the recent crisis in the rear view mirror, private equity firms are also being accused of taking far too great risks with unhealthy leverages.
Nevertheless, advocates may argue that the competition on the private equity scene has toughened and that bargains are more or less impossible to find these days. As stated in Mattson and Mårild (2006), internal value creation is today the most important factor for private equity firms. Thus, private equity firms have to create actual value, through active ownership and highly skilled management. Also, in response to the general opinion of private equity funds practising too high leverage, Kaplan and Strömberg (2008) found in their study that the annual default rate among private equity fund portfolio companies is 1.2%, compared to the average default rate for U.S. corporate bond issuers at 1.6%, portfolio companies are thus actually less prone to default than average (Hamilton, Varma, Ou and Cantor, 2006). Many private equity practitioners argue, on the contrary, that most listed companies are instead quite low leveraged.
The study seeks to answer a few questions regarding exited private equity fund portfolio companies and their performance. The idea is to investigate how these companies perform after being floated compared to the general market, as well as how they differ from the average IPO, based on previous studies. That is, can any abnormal return be recognised and how do various aspects, such as timing, bookrunner reputation and M&A-activity among others, affect these potential abnormal returns? 2.2 Research strategy
The motives for investigating this matter further are not hard to find. The main objective of this study is to answer the question of whether or not private equity firms create value in their portfolio companies, preserved even after the exit. The particular characteristics of the study make an event study the optimal form of research. An event study is performed whenever one seeks to investigate a specific event or transformation phase as well as the circumstances surrounding it (Bryman and Bell, 2003). The objective of this thesis is to be answered through quantitative analysis, by comparing the return of the sample with a general index as well as industry specific indices. This will be achieved through gathering enough data, used as the foundation of a number of statistical calculations, which in turn then will be the basis for the analysis.
2.2 Quantitative and qualitative data
There are basically two major ways to go about a study, quantitative or qualitative (Lekvall and Wahlbin, 2001). The quantitative method differentiates itself from the qualitative in a few distinct ways. It measures the performance of a greater sample population upon which the researcher can
are drawn (Eriksson and Wiedersheim-Paul, 2006). This study will take on a quantitative approach, as is consensus when performing this type of stock performance based research. Cao and Lerner (2009), who performed a similar study on reversed LBOs on the U.S. market, and Levis (2008), who studied the British private equity market, are merely two examples of similar studies with a quantitative method. The research will be based on a sample of, initially, 318 companies, representing all firms in Europe exited by private equity funds between 1994 and 2007.
2.3 Scientific approach
When making a scientific study, one can approach the subject in one of two ways, inductively or deductively, or a combination of both. When using existing theory to build one’s analysis on, one is said to be using a deductive approach. Conversely, a researcher with an inductive approach uses no preconceived views or thoughts, i.e. theories and instead tries to create new theories based on the empirical results. However, no man can really be said to have no biases, even if one tried to set these aside, subconsciously one would still be affected by these (Jacobsen, 2002).
Furthermore, since this is an event study which has been done before, a deductive approach seems reasonable when drawing conclusions, and thus basing them on existing theory and comparing the results in this study with results from earlier ones. At the same time, very few studies are pure deductive or inductive ones (Lundahl and Skärvad, 1999). I will try to back any conclusions made with existing theory, however, no clear distinction has been made towards using one approach over the other and an element of induction and general conclusions may prove necessary if any result ends up impossible to be supported by existing theory (Bryman and Bell, 2003).
2.4 Primary and secondary data
There are two ways to gather data for analysis in which the data is referred to as either primary or secondary data. Primary data is data that is collected actively by the researcher himself while secondary data is data that has been collected by a third party (Lekvall and Wahlbin, 2001). I will be using secondary data for this entire study, as the time needed to spend on looking this data up myself would be extremely inefficiently spent. The databases used are all databases recognised by practitioners and used by many in their daily work (Dealogic, 2011: Mergermarket, 2011; Thomson Reuters, 2011). Thus, I see them as more than reliable enough.
The record of the particular companies subject for scrutiny, the exited fund portfolio companies, was retrieved from a database provided by Dealogic. I found the stock price information about those companies in Thomson Reuters Datastream, which is a tool provided by the university and actively used by financial industry practitioners all around the world. Datastream was also the tool used when retrieving index performance for both S&P Europe 350 and the industry-specific benchmarks. Finally, the M&A-activity data was collected from the Mergermarket database, also a tool used by professionals in the industry for gathering information about M&A statistics.
2.5 Credibility
The veracity of a scientific study is crucial and expresses itself in three major ways: reliability, validity and objectivity.
Reliability is really all about ensuring that the findings of the paper are consistent, regardless of who is making the study. That is, that anyone should be able to follow the procedures described in the paper and come up with the same results. But it is also about making sure that the results are not affected by temporary or random differences (Bryman and Bell, 2003). A time span ranging all the way from 1994 to 2007 should, hopefully, erase any such temporality or irregularity. Also, data
gathered from software such as Datastream and databases such as Mergermarket and Dealogic, would have to be seen as reliable as practitioners in the financial industry use them on a daily basis. The fact that share price data, deal specific information and M&A-activity related material, all has been collected from only one source per type of information, guarantees that there should be no differences in measurement or way of displaying results between any two companies (Björklund and Paulsson, 2003; Lundahl and Skärvad, 1999).
The validity of a study tells you how well the author has measured what he or she intended (Bryman and Bell, 2003). Many authors separate internal validity from external, meaning that there is a difference between the validity one as a researcher is able to ensure and the validity of the actual sample, something the researcher is less able to guarantee. That is, making sure that one measures what was intended is one thing, whereas making sure that the data sample really reflects reality is another. When it comes to internal validity, I have used proven methods, used in similar previous studies and am thus certain that I have measured what was intended. The external validity is ensured through reliable sources and methods that should best reflect reality. The BHAR method is used for measuring abnormal returns and is used due to its realistic features. As it compounds the abnormal returns instead of summarising them, as done with CARs, it reflects the effect on an investor’s portfolio more accurately. However, CAR is used as well as a controlling variable. To make sure that the right-skewness of the BHARs is diminished as much as possible, the skewness-adjusted t-test has been used. However, the small sample used for measuring the effect of M&A-activity may pose problems of validity, as it perhaps cannot be seen as representative (Björklund and Paulsson, 2003; Lundahl and Skärvad, 1999).
Lastly objectivity, which is defined somewhat differently in various method literature, is basically related to the preconceived ideas and biases of the author. A researcher should always try to be as impartial and unbiased as possible to avoid letting anything compromise the results or the way the study is performed. It is always difficult to set aside preconceived opinions and even if one is successful in that attempt, they inevitably affect one unconsciously. I have tried to be aware of my biases to the greatest extent possible in order to be able to neutralise them, but I am still aware of the fact that perfect objectivity is almost impossible to attain and would like to inform the reader of the same. With that being said, I do not feel that this type of study is the one most affected by any biasness when actually working with retrieving and performing statistical calculations on data. Qualitative studies, performing e.g. interviews are much more affected by this type of problem when e.g. creating questions, as well as risking posing leading and slanted questions. The data retrieved does not change depending on any biases, however, it is still an important aspect for studies such as this one when it comes to interpreting the results. To come to terms with this problem, I have been extra attentive when interpreting the results, discussing my reasoning with my peers. Still, the fact that I am performing this study on my own could affect the objectivity negatively (Björklund and Paulsson, 2003; Lundahl and Skärvad, 1999).
2.6 Sample
2.6.1 Selection of countries and stock exchanges
This study limits its research to only measure the performance on private equity-backed IPOs and will thus not investigate the performance of the general IPO. Studies on general IPOs has already been performed numerous times, on multiple markets and during several time horizons, with examples such as Alvarez and Gonzalez (2005), Carter et al. (1998), Khurshed, Mudambi and Goergen (1999) and Ritter (1980, 1991), making yet another study seem redundant. My study is
reversed leveraged buyouts backed by private equity firms, see Cao and Lerner (2009). By broadening the sample, a general picture of the performance and quality of the IPOs backed by the private equity industry is achieved. However, the study has no intentions of incorporating venture capital-backed IPOs, done in Levis (2008) or Hege, Palomino and Schwienbacher (2003), since these firms are deemed as neither comparable to the general IPOs nor to the general market, due to their start-up like characteristics (SVCA, 2011).
The countries included are displayed in Table 1, as well as their relative contribution to the sample. The exchange used for each country is the major exchange in the respective countries. These exchanges have been chosen since most leveraged buyouts, and reasonably public exits by private equity firms, are issued on the major markets due to the size of these firms usually being larger than average (Cao and Lerner, 2009). The particular countries have been chosen since it would be interesting to investigate the performance on an aggregated European basis, instead of on a country specific, see Björcke and Menzel (2006) and Henrysson and Petterson (2007). A lot of studies have also already been made on the U.S. market, such as Cao and Lerner (2009) and Mian and Rosenfeld (1993). By instead focusing on the aggregated European market, I hope to add to the research foundation of private equity-backed IPOs.
Table 1
Countries included in the sample and their relative contribution to the sample
United Kingdom 37.9% Germany 11.6% France 10.8% Italy 7.6% Sweden 5.8% Switzerland 4.7% Poland 4.0% Norway 3.2% Spain 2.5% Austria 2.2% Belgium 2.2% Netherlands 2.2% Ireland 1.1% Czech Republic 0.7% Finland 0.7% Luxembourg 0.7% Russian Federation 0.7% Denmark 0.4% Faroe Islands 0.4% Greece 0.4% Portugal 0.4%
This table shows that the largest equity market in Europe, United Kingdom, also seems to be the largest private equity market. It is also notable that the Swedish market seems to be the fifth largest contributor, remarkable given its size.
Looking at table 1, it is notable that the Swedish private equity market represents a large contribution relative its size, the largest one in Europe relative to its GDP, together with the U.K. market (SVCA, 2011). The Swedish private equity industry has also been subject to serious debate lately. The discussions have pertained to the lenient taxation of portfolio company exits and the obvious gaps in taxation policy for private equity firms, among other things (Ekelund, and Lundell, 2011a). Thus, due to the relative importance, the industry description in section three will have a certain degree of special focus towards Sweden. However, private equity as a business idea is international, making the specifics for the Swedish industry relatively universal.
2.6.2 Selection of time period
As I intend to build as large a database as possible, I have tried to find data reaching back as early as the database would let me. The earliest recorded data in Dealogica was from 1994 and in order to make certain a large enough time span of three years to study post-IPO, 2007 was clearly the most recent year I could use and analyse. Also, there seems to be a certain gap in the previous studies conducted, with Björcke and Menzel (2006) and Cao and Lerner (2009) displaying the most current results, ending in 2005 and 2003 respectively. The study will be conducted using four time horizons. Short-term will be defined as three months, short medium-term as six months, long medium-term as 12 months and long-term as 36 months. The time period of the thesis will reach from 1994 to 2007.
2.6.3 Selection of candidates and criteria
The study has identified 318 private equity-backed IPOs during the research period from 1994 to 2007 on all of the covered markets combined. The sample should follow two main criteria, primarily, obviously, that it was in fact an IPO, and secondly that the IPO was backed by a private equity firm or a syndicate of private equity firms.
However, some complications were encountered along the way. First of all, not all firms were covered in Datastream, which could be due to name changes not registered or acquisitions (see Appendix 1). Without any stock performance information about these companies they were excluded from the study all together. The lack of share price information reduced the sample from 318 to 277. Appendix 1 displays the companies included, as well as the country of origin, floating date (i.e. first day of trading) and industry the company operates in. Secondly, a large part of the sample was excluded when investigating the M&A-activity during the holding period. This was due to the fact that the date of acquisition and the portfolio firms’ acquisitions were hard to find. Only 111 out of the original 277 firms were registered in the Mergermarket database and thus eligible for M&A-activity analysis (see, Appendix 1). Since there were firms registered in the database with no acquisitions, deeming the ones not found as having done no acquisitions seems erroneous. Furthermore, since Mergermarket was founded in 2000, there is limited information about deals being made previous to that year (Mergermarket, 2010). Thusly, including firms not in Mergermarket can distort the results, seeing as a relatively large part of the sample is actually from before 2000, see graph 4. Table 2 displays the selected sample given certain criteria more clearly.
Table 2
Sample Selection Criteria
Total number of firms in the raw data sample 318
Less: Observations not found in Datastream 41
Regression and t-test on total sample and variables (excl. M&A-activity related) 277
Less: Observations not found in Mergermarket 166
Regression on M&A-activity related variables 111
The 277 observations found in Datastream were used in the skewness-adjusted t-test as well as the multiple regression using dummy variables, explained further in the method section. The M&A-activity related variables are calculated using the dummy variables, however, on 111 observations.
2.7 Stock performance and required return
When calculating the performance of a stock, one needs to put it in relation to some sort of benchmark in order to be able to evaluate whether or not the stock has outperformed or underperformed. A stock’s performance displayed in per cent on its own does not tell an investor much about how good of an investment it actually was. Even if the stock has risen by 15%, the investor could still have been better off by merely investing in the market portfolio if the market return was higher. However, it is also a matter of the risk-return trade off, the owner of an asset with higher risk also demands a higher return. The raw performance of a stock measured in per cent for time t is calculated by formula 1, displayed below.
!"#$%&! = !"#$%!
!"#$%!!!−1 × 100
(1) Thus, when determining if a stock has outperformed or underperformed, it is compared to the required return. The required return pertains to the expected, risk-adjusted return. That is, for a higher level of risk, a higher return is required. This relationship is explained by the CAPM-model or the Fama-French three factor model (Fama and French, 2004). If !!,! is the return of a time series of a portfolio of companies floated at time t, the forthcoming proposed tests can be seen as testing for ! in a time series model.
!!,! = !+(!!,!)! + !
!
(2) Where, (!!,!)! is the expected, or required, return and !!, the zero mean error term, at time t. As
mentioned previously, (!!,!)! can in turn be viewed from the CAPM or Fama-French three factor model perspective. Formula 3 illustrates the CAPM view.
(!!,!)! = !
!,!+ !(!!,!− !!,!)
(3) Where, !!,! is the risk-free rate at time t, and !!,! is the return of a specific benchmark. These benchmarks are discussed further in the subsequent section. With the restriction of != 1 and the usage of CAPM, proposed by Lyon, Barber and Tsai (1999) and followed by Gregory, Guermat and Al-Shawawreh (2010), a better specification is achieved (Lyon et al., 1999; cited in Gregory et al.,
2010 p. 620). Through simplifying the model with the above mentioned assumptions, we end up with the following formula for the required return (Gregory et al., 2010):
(!!,!)! = !
!,!
(4) Formula 4 thus states that the required return equals the benchmark. The proposed procedure was also implemented by Gregory et al. (2010), in their study about IPOs in the UK.
2.8 The applied benchmarks
In order to measure and compare company performance across industries, one would have to eliminate any industry related outperformance for each firm. This is accomplished through adjusting the performance of an individual firm for the performance of the entire industry. However, to be able to see the outperformance or underperformance over the general market, a benchmark reflecting the market portfolio is needed. Thus, two benchmarks will be used to properly examine the performance, S&P Europe 350 and an industry benchmark reflecting the performance for each IPO respectively. The S&P Europe 350 intends to cover at least 70% of the equity in Europe and serves as a general market portfolio comparison. This index represents 350 listed companies, leading their industry, in their home market, in 17 European countries. These companies then have to follow a list of criteria regarding e.g. liquidity and market capitalization. The countries included are Austria, Belgium, Denmark, Finland, France, Germany, Greece, Ireland, Italy, Luxembourg, Netherlands, Norway, Portugal, Spain, Sweden, Switzerland and the United Kingdom. The relative size of each market is then represented accordingly in the index (S&P, 2010).
Moreover, 10 economic sectors, Consumer Discretionary, Consumer Staples, Energy, Financials, Health Care, Industrials, Materials, Technology, Telecommunication Services, and Utilities in turn make up The S&P Europe 350. These benchmarks will be used to represent the industry-specific return for each industry included in the sample (S&P, 2010). Table 3 illustrates the distribution of economic sectors in the sample. Each company was already assigned to a specific industry when retrieved from Dealogic, however, due to the fact that so few companies were regarded to be working in consumer staples, the two consumer-related industries were combined into one. The few utility companies identified were of energy-related kind and were thus included in the energy sector.
Table 3
Distribution of economic sectors in the sample
Consumer Discretionary & Staples 21,3%
Energy 4,7% Financial 6,9% Health care 15,2% Industrials 13,7% Materials 5,8% Technology 26,4% Telecom Svc 6,1%
The graph displays how many companies in the sample were active in respective economic sector. The majority was found to be working in the technology and consumer industry, whereas the minority was found in the energy and materials sector, two very capital-intensive industries.
2.9 Measuring abnormal returns
There are some implications and factors to be aware of when choosing the proper method to perform this type of study, measuring stock performance. The buy-and-hold abnormal return method is frequently used in studies such as this, the most relevant being Cao and Lerner (2009). There are other ways of measurement, however none other replicates the effect on an investor’s portfolio as accurately, chiefly due to its compounding effect. The downside with BHARs is the fact that they tend to be right-skewed over time, with high kurtosis and inability to accurately measure short-term returns (Fama, 1998). Still, using average abnormal returns or cumulative abnormal returns would not reflect an investor’s return realistically (Buchheim, Grinstead, Janssen, Juan and Sahni, 2011). Due to these complications and to ensure consistency and validity in my results I have chosen to use both CARs as well as BHARs when assessing the abnormal returns for the companies in this study. Even though CARs do not measure the effect on an investors portfolio as realistically, it could prove more accurate when measuring short-term returns, where the BHAR-method experiences problems. As mentioned earlier, four time-horizons will be used in this study. Short-term, represented by three months, short medium-term, six months, long medium term, twelve months and long-term 36 months. Measuring long-term abnormal returns is exceptionally hard and treacherous as Lyon et al. (1999) expressed it, and which Fama (1998) concurs on. They recommend to measure e.g. across both different time periods as well as financial markets, both of which have been done in this study. Time periods of three years from 1994 to 2007 have been used, as well as more than 20 financial markets. Long-term studies continuously suffer from a bad-model problem, where the results become somewhat misleading. For example, CARs grow linearly over time whereas its standard error only grows with the square root. This problem becomes even greater when using BHARs, as it grows exponentially instead of linearly. In the short-run, the effect is negligible, but in the long-run it can have substantial influence on the results. Additionally, due to its compounding characteristic, BHARs are also subject to severe skewness in the long-run (Drobetz, Kammermann, Wälchli, 2003).
Nevertheless, the BHAR-method is still the one to be preferred since it is the only on that truly reflects the effect on an investor’s portfolio and it is thus the most frequently used one in empirical studies on long-run performance (Drobetz et al., 2003). Now, Lyon et al. (1999) actually developed a skewness-adjusted t-test in 1999, which adjusts for the skewness experienced when using BHARs. When computing test statistics for the null hypothesis of zero abnormal returns for the entire sample, their procedure is used.
When comparing different variables however, I use a different approach referred to as multiple regression with categorical variables, or “dummy coding.” This linear regression is a useful method when one wishes to compare multiple variables and how their mean differs from both each other as well as the overall sample mean. It is most often used in time series analysis, such as this study, or qualitative survey analysis. When comparing e.g. exited fund portfolio companies across countries, economic sectors or based on their bookrunner, one needs to assign each company to a specific group. Dummy variables solve this issue easily by assigning respective company with a one or a zero. Dummy variables are also valuable when there are infinite possible independent variables, such as the market-to-book ratio for a company. With dummy variables, one can divide sets of groups with different ranges of ratios instead of evaluating each particular ratio separately. (Barreto and Howland, 2005; Garavaglia and Sharma, 1998).
2.9.1 Cumulative abnormal return
Even though the buy-and-hold abnormal return method is the one preferred in this study, as it most accurately replicates the effect on an investor’s portfolio, all calculations have been duplicated with the CAR-method. Furthermore, CARs are subject to skewness to a much lesser extent, which makes it a good controlling variable (Lyon et al., 1999). !"#!" is the sum of the t-period abnormal return for firm i, and is calculated as (Khotari and Warner, 2006):
!"!,! =!!,!− !(!!,!)
(5) where !(!!,!) is the expected return for firm i, which is the benchmark and,
!"#!" = !"!,!
!
!!!
(6) 2.9.2 Buy-and-hold abnormal return
The buy-and-hold abnormal return formula measures the compounded capital gain for a given period of time. Even though it suffers from both problems of skewness and short-term accuracy in performance measurement, it is still the only method which takes into account the compounding effect of actually owning a stock, i.e. that a 50% negative return is not perfectly corrected by a subsequent 50% positive return. However, the skewness of the method is adjusted for in a test statistic explained next and the short-term results are also compared to their respective CAR results. Buy-and-hold abnormal returns are computed as follows:
!"#$= !1 1+!!" ! !!! − 1+!!" ! !!! ! !!! (7) where rit is the return of IPO i and rbt is the return of benchmark b at the month t. N represents the number of firms.
2.9.3 The skewness-adjusted test statistic
To deal with the problem of BHARs being skewed, I will follow the method of Lyon et al. (1999). The adjusted t-test stems from the work of Johnson (1978), originator of the skewness-adjusted t-statistic.
Johnsons (1978) skewness-adjusted t-statistic, in turn, branches from the conventional t-statistic:
! = !"! ! !"! /√!
(8) Where !"! and ! !"! is the sample mean and the standard deviation of abnormal returns for a firm, respectively. N represents the number of firms. Johnson (1978) then adjusted the original t-test to better fit asymmetrical populations and came up with the skewness-adjusted t-statistic formula, denoted here as !!": !!" = √! !+ 1 3!!! + 1 6!! (9) where != !"! ! !"! (10) and ! = !"!"− !"! ! ! !!! !"(!"!)! (11) Note that (10) is really nothing more than the conventional t-statistic equation (8). This formula adjusts the usual t-statistic by two terms through taking into consideration the skewness of the distribution of abnormal returns (Lyon et al., 1999).
To interpret the results of the returns, I will follow the methods of Ritter (1991) and calculate the wealth relative.
!"#$%ℎ !"#$%&'"=1+(!"#$!%# !"!#$ !"#$!% !"# !"−!"#$%& !"#$!) 1+(!"#$!%# !"#$!% !"# !"#$ℎ!"#$%!)
(12) The wealth relative indicates whether or not the private equity-backed IPOs underperform or outperform the benchmark during time t. A wealth relative of 0.8 suggests a 20% underperformance and 1.2 a 20% outperformance.
2.9.4 Multiple regression using dummy variables
When making comparisons within the sample a multiple regression with dummy variables is used. Dummy variables are most suitable when trying to conclude variations based on different aspects within a general sample population. When performing linear regression using dummy variables, all input variables take the values of either 1 or 0. The 1 represents all “true” values, that is, the input variables for which the independent variable statement is true are denoted with a 1, a 0 represents all others. For example, when comparing exited fund portfolio companies, all companies floated during the year of 2000 are assigned a 1 under the 2000 column and all the others get a 0. However, under the 2001 column, a 0 instead represents companies floated during 2000 and a 1 represents the ones listed during 2001, and so on.
When the dummies are created for each variable, they are then used in a Classic Linear Regression (CLR) model, yielding standard Ordinary Least Squares (OLS) results. The equation below explains how the dummy variables are used in such a regression analysis.
!=!!!! + !!!! + … +!
(13) When studying the variable i, its dummy variable !! takes on the value of one, whereas all the other variables are assigned with zeros. This renders in:
!= !! + !
(14) Which states that the return of any variable really is dependent on nothing more than its related dummy coefficient plus an error term. Note that no intercept is included in the equation, if it was, multicollinearity would occur and the regression would not be able to run. Without an intercept, the coefficient represents the expected return for each variable. When an intercept is used, one variable needs to be dropped from the equation and thus represents the intercept. Suppose one has three variables, a, b and c, when aiming to see how variables a and b differs from c, the latter is omitted from the regression, rendering in the following equation:
! = !!+ !!!!+!!!!+!
(15) Where !! is the intercept and !! and !! are the two variable coefficients. The coefficients of the other variables, now instead represent the mean difference from the omitted variable c, which in turn is represented by the intercept (Kennedy, 2003).
This method involves a total of five assumptions, which need to be mentioned. First of all, the dependent variables, i.e. the abnormal return, should be a linear function of the independent variables, i.e. country of exchange or M&A-activity. Secondly, for simplicity, the error term is said to be zero. Thirdly, the error terms are all uncorrelated and have the same variance. The fourth assumption regards the possibility to repeat the sample with the same independent variables. Finally, the fifth assumption states that the number of observations in the sample should be greater than the independent variables and no linear relationship should exist between these variables, that is, the linear multicollinearity should be low.
3 The Private equity industry
This section introduces the reader to the subject and its peculiarities, how the industry of private equity is set up and what characterises it. This is to make sure the reader understands the surrounding private equity environment, which hopefully improves the extent to which the reader may appreciate the study.
3.1 Private equity
Public equity is risk capital invested in firms listed on a public exchange, investing risk capital in firms not listed on an exchange is instead referred to as private equity. Firms devoted to this type of activity where the target companies are mature and the acquisitions are financed chiefly by debt are called buyout firms or private equity firms (Unionen, 2009).
3.1.1 The Business model
The business model of a private equity firm is to acquire firms at a lower value than what they are later sold for. Private equity firms acquire targets to a fund set up by the firm, that are deemed as having potential inefficiencies in either their capital structure or operating business or potential synergies with either existing fund portfolio companies or other competitors on the market. These inefficiencies are then evaluated and in due time hopefully diminished or completely erased and synergies are realized by the expertise held by the private equity firm. Through these actions private equity firms are able to increase growth in revenue and margins through organic growth and/or acquisitions as well as minimising weighted average cost of capital (WACC) and taxes paid through relatively high debt-to-equity ratios (Unionen, 2009). Private equity funds generally perform well (SVCA, 2011). For example, Ratos has an annual average IRR of 30%. Shown below is a Graph 1 displaying how that is accomplished (Ratos Annual Report, 2008).
Graph 1
Value creation in a fund portfolio company
The graph describes how value is created by a private equity firm in a portfolio company, from Ratos point of view. Most of the value is created in increasing revenue growth and by improving margins. The perhaps preconceived notion of private equity firms only focusing on capital efficiency is only second priority. As noted, a lot of the financial effects are actually a product of internal development, rendering in industrial development making up as much as 90% of the value creation in a fund portfolio company.
3.1.2 The Fund and its investors
A fund is set up and capital is raised, investors range from insurance companies to banks and pension funds to private investors through fund in funds and corporate investors. However, not all capital is raised at once, as potential targets are being identified and acquired, capital is raised accordingly. When the fund is completely covered, no more investments will be accepted and the investments already made in the fund is locked in for, more or less, the coming 10 years. The fund will most likely
have some sort of strategic focus, be it geographical, related to firm size, industry or development stage.
The Swedish national pension funds represent a large part of the investors in this type of funds, some has mandate to invest a full 100% of the managed capital in buyout funds. However, the majority, 75%, of investments come from outside of Sweden, primarily from other European countries and the U.S. (Unionen, 2009).
3.1.3 Acquisitions
When the fund has been set up and investors have committed to investing, the fund acquires companies fitting the prerequisites regarding strategic focus and future value increasing potential. Targets for acquisitions are more often than not family companies, conservatively operated and in some way inefficient. However, it is rare to see these funds investing in firms or industries demanding high capital investments with a long payback horizon. Also, private equity funds try to stay away from highly cyclical firms since its aggressive take on leverage demands a steady stream of positive cash flow from its portfolio companies. Acquisitions made by private equity funds are actually leveraged up to 70%, while the average listed firm usually is funded by merely 30-50% debt.
Through altering the capital structure and the way the company is managed, the acquiring private equity firm can increase the value of the firm and realise a profit and return to its investors. Obviously there is also the case where private firms acquire publicly traded firms and delists them. One particular LBO and delisting, which gained a lot of press in Sweden, was the buyout of Munters by Nordic Capital (Nordic Capital, 2010). In this case, the private equity firm was able to value the target higher, and offer a higher price as a result, partly due to its ability to handle a much higher leverage (Unionen, 2009).
3.1.4 Exit
Finally, the fund exits its positions in its portfolio companies and terminates the fund. The investment period is usually around three to six years, after which a suitable exit route is chosen based on the highest value of the portfolio firms can be derived. The most common exit has been, and continues to be, an industrial sale for the obvious reason that these firms tend to pay more. Another common route is a sale to another buyout firm, a so-called secondary buyout. Exits to the stock exchange are highly dependant on the current state of the market. During recessions, IPOs and obviously also private equity-backed IPOs are very rare. Conversely, we see the most and the largest IPOs being done during booms. Reasoning over the timing of IPOs and private equity-backed IPOs will be discussed in more detail in the coming parts of the paper. (Unionen, 2009)
As seen in table 4, during 2008, and actually in 2009 as well, a great majority of companies owned by risk capitalists, that is, venture capitalists and buyout firms, were sold to industrial buyers. It is also noticeable that exits to stock exchanges make out a negligible part of the exits in 2008, which is in line with for example Benninga, Helmantel and Sarig (2004) and their findings of the positive correlation between IPOs and high stock prices (SVCA, 2009). Looking at table 4, we can see the consequences of the recession that hit more or less stock exchanges all around the world and its impact on stock prices, as a result not a lot of exits to the equity capital market was done by risk capitalists. Table 4 is a table collected directly from a study made by Kaplan and Strömberg (2008) and displays the types of exits used over a longer period of time worldwide. These statistics more or less concur with the ones from a Swedish and current standpoint. Worth to mention is the bankruptcy frequency, given the capital structure of these firms one would think leveraged buyouts suffer from bankruptcy more frequently than other firms. However, Kaplan and Strömberg argues in
their study from 2008 that the average annual default rate for leveraged buyouts is merely 1.2%, assuming an average holding period of six years. Surprisingly, the average default rate for U.S. corporate bond issuers was found to be 1.6% in a study made by S&P from 1980–2002 (Hamilton et al., 2006). It is also notable that IPOs as an exit have been steadily declining over the years while a strategic sale has been the most common form of exit consistently throughout the period.
Table 4
Exit characteristics of leveraged buyouts across time 1970-
1984 1985-1989 1990-1994 1995-1999 2000-2002 2003-2005 2006-2007 Whole period Year of original LBO
Type of exit:
Bankruptcy 7% 6% 5% 8% 6% 3% 3% 6% IPO 28% 25% 23% 11% 9% 11% 1% 14% Sold to strategic buyer 31% 35% 38% 40% 37% 40% 35% 38% Sold to financial buyer 5% 13% 17% 23% 31% 31% 17% 24% Sold to LBO-backed firm 2% 3% 3% 5% 6% 7% 19% 5% Sold to management 1% 1% 1% 2% 2% 1% 1% 1% Other/unknown 26% 18% 12% 11% 10% 7% 24% 11% % of deals exited within:
24 months (2 years) 14% 12% 14% 13% 9% 13% 12% 60 months (5 years) 47% 40% 53% 41% 40% 42% 72 months (6 years) 53% 48% 63% 49% 49% 51% 84 months (7 years) 61% 58% 70% 56% 55% 58% 120 months (10 years) 70% 75% 82% 73% 76%
The table reports exit information for 17,171 worldwide leveraged buyout transactions that include every transaction with a financial sponsor in the CapitalIQ database announced between 1/1/1970 and 6/30/2007. The numbers are expressed as a percentage of transactions, on an equally weighted basis. Exit status is determined using various databases, including CapitalIQ, SDC, Worldscope, Amadeus, Cao and Lerner (2007), as well as company and LBO firm web sites. See Strömberg (2008) for a more detailed description of the methodology.
Source: Kaplan and Strömberg, 2008
3.2 The Swedish private equity industry
Since 1986 and the launch of the very first private equity fund in Sweden by Procuritas Partners, the private equity industry has progressed immensely, both domestically and internationally. Nowadays, the Swedish private equity market is, in relation to the country’s GDP, one of the largest in the world. In 2007 more than one per cent of GDP was invested in buyouts and when it comes to listed private equity companies, the total market cap ranks Sweden as fifth in the world only surpassed by the U.S. U.K., France and Switzerland (SVCA, 2011). However, the market is fairly concentrated and ten buyout companies make up 90% of the entire market (Unionen, 2009). Table 5 gives the reader an insight into the Swedish private equity market, its major players as well as their importance.
Table 5
Ten largest PE Companies in Sweden 2008
Managed Capital
(MSEK) Invested Capital (MSEK) Investments
EQT 100 000 50 000 30 IK Investment Partners 37 032 15 948 20 Nordic Capital 32 000 - 21 Altor 20 000 14 000 21 Ratos - 12 000 20 Hakon Invest 13 000 11 000 6
Accent Equity Partners 9 000 6 000 14
Segulah 8 500 2 500 8
East Capital Private Equity 5 200 4 300 14
Nordstjernan - - 11
The most influential private equity firms in Sweden are the ones in top in this table, EQT, IK, Nordic Capital, Altor and Ratos who together make up almost 50% of the Swedish market.
Source: Unionen, 2009
Most of the acquisitions being made by these firms to their fund portfolios are done in Sweden, in fact two-thirds of all investments are made in firms located in Sweden. The remaining third is more or less exclusively focused towards other Nordic countries. Thus, private equity firms in Sweden display a certain home-biasness (Shefrin, 2005) in their investment patterns. This is obviously highly dependant on their competitive edge and experience being limited to dealing with Swedish or Nordic companies. It is also easier and more cost-effective in terms of culture and legal issues, dealing with markets you are familiar with. The major Swedish players on the Swedish private equity market are EQT, IK, Nordic Capital, Altor and Ratos. Together they managed capital succeeding SEK 200 billion in 2008, resulting in a combined market share of 40-45% as the aggregated managed capital in the private equity industry was around SEK 465Bn during the same period (Ratos Annual Report, 2008; Unionen, 2009). However, there are some major foreign players on the Swedish market, coming from outside the Nordic region. The most influential being 3i Nordic, Apax Partners and Pamira Advisors, all of which are based in Great Britain. For example, 3i Nordic once had Gant in their portfolio, Apax Partners had both Capio Health Services and Pamira SBS Broadcasting, Kanal 5, Kanal 8 etc. (Unionen, 2009).