NBER WORKING PAPER SERIES
LEVERAGED BUYOUTS AND PRIVATE EQUITY
Steven N. Kaplan
Per Strömberg
Working Paper 14207
http://www.nber.org/papers/w14207
NATIONAL BUREAU OF ECONOMIC RESEARCH
1050 Massachusetts Avenue
Cambridge, MA 02138
July 2008
This research has been supported by the Kauffman Foundation, by the Lynde and Harry Bradley Foundation
and the Olin Foundation through grants to the Stigler Center for the Study of the Economy and the
State, and by the Center for Research in Security Prices. We thank Jim Hines, Antoinette Schoar,
Andrei Shleifer, Jeremy Stein, Tim Taylor, and Mike Wright for very helpful comments. The views
expressed herein are those of the author(s) and do not necessarily reflect the views of the National
Bureau of Economic Research.
NBER working papers are circulated for discussion and comment purposes. They have not been
peer-reviewed or been subject to the review by the NBER Board of Directors that accompanies official
NBER publications.
© 2008 by Steven N. Kaplan and Per Strömberg. All rights reserved. Short sections of text, not to
exceed two paragraphs, may be quoted without explicit permission provided that full credit, including
Leveraged Buyouts and Private Equity
Steven N. Kaplan and Per Strömberg
NBER Working Paper No. 14207
July 2008
JEL No. G3,G34
ABSTRACT
We describe and present time series evidence on the leveraged buyout / private equity industry, both
firms and transactions. We discuss the existing empirical evidence on the economics of the firms and
transactions. We consider similarities and differences between the recent private equity wave and
the wave of the 1980s. Finally, we speculate on what the evidence implies for the future of private
equity.
Steven N. Kaplan
Graduate School of Business
The University of Chicago
5807 South Woodlawn Avenue
Chicago, IL 60637
and NBER
[email protected]
Per Strömberg
Institute for Financial Research (SIFR)
Drottninggatan 89
SE-113 60 Stockholm
Sweden
and NBER
In a leveraged buyout, a company is acquired by a specialized investment firm using a relatively small portion of equity and a relatively large portion of outside debt financing. The leveraged buyout investment firms today refer to themselves (and are generally referred to) as private equity firms.1 In a typical leveraged buyout transaction, the private equity firm buys majority control of an existing or mature firm. This is distinct from venture capital (VC) firms that typically invest in young or emerging companies, and typically do not obtain majority control. In this paper, we focus specifically on private equity firms and the leveraged buyouts in which they invest.
Leveraged buyouts first emerged as an important phenomenon in the 1980s. As leveraged buyout activity increased in that decade, Jensen (1989) predicted that the leveraged buyout organizations would eventually become the dominant corporate organizational form. His argument was that the private equity firm itself combined concentrated ownership stakes in its portfolio companies, high-powered incentives for the private equity firm professionals, and a lean, efficient organization with minimal overhead costs. The private equity firm then applied performance-based managerial compensation, highly leveraged capital structures, and active governance to the companies in which it invested. According to Jensen, these structures were superior to those of the typical public corporation with dispersed shareholders, low leverage, and weak corporate governance.
A few years later, this prediction seemed to have been premature. The junk bond market crashed following the demise of the investment bank, Drexel Burnham Lambert; a large number of high-profile leveraged buyouts resulted in default and bankruptcy; and leveraged buyouts of public companies (so called public-to-private transactions) virtually disappeared by the early 1990’s.
But the leveraged buyout market had not died – it was only in hiding. While leveraged buyouts of public companies were relatively scarce during the 1990s and early 2000s, leveraged buyout firms continued to purchase private companies and divisions. In the mid-2000’s, public-to-private transactions
1
reappeared. Fewer than twenty years after the previous crash, the U.S. economy (and the rest of the world) experienced a second leveraged buyout boom.
In 2006 and 2007, a record amount of capital was committed to private equity, both in nominal terms and as a fraction of the overall stock market. The extent of private equity commitments and activity rivaled, if not overtook the activity of the first wave in the late 1980s that reached its peak with the buyout of RJR Nabisco. Hence, Michael Jensen’s prediction seemed more relevant than ever. However, in 2008, with the turmoil in the debt markets, private equity appears to have declined again.
We start the paper by describing how the private equity industry works. We describe private equity organizations such as Blackstone, Carlyle, and KKR, and the components of a typical leveraged buyout transaction, such as the buyout of RJR Nabisco or SunGard Data Systems. We present evidence on how private equity fundraising, activity and transaction characteristics have varied over time.
The article then considers the effects of private equity. We look at evidence concerning how private equity affects capital structure, management incentives, and corporate governance. This evidence suggests that private equity activity creates economic value on average. At the same time, there is also evidence consistent with private equity investors taking advantage of market timing (and market mispricing) between debt and equity markets particularly in the public-to-private transactions of the last fifteen years.
We also review the empirical evidence on the economics and returns to private equity at the fund level. Private equity activity appears to experience recurring boom and bust cycles that are related to past returns and to the level of interest rates relative to earnings. Given that the unprecedented boom of 2005 to 2007 has just ended, it seems likely that there will be a decline in private equity investment and
fundraising in the next several years. While the recent market boom may eventually lead to some defaults and investor losses, the magnitude is likely to be less severe than after the 1980s boom because capital structures are less fragile and private equity firms are more sophisticated. Accordingly, we expect that a significant part of the growth in private equity activity and institutions is permanent.
Private Equity Firms, Funds, and Transactions
Private Equity Firms
The typical private equity firm is organized as a partnership or limited liability corporation. Blackstone, Carlyle, and KKR are three of the most prominent private equity firms. In the late 1980s, Jensen (1989) described these organizations as lean, decentralized organizations with relatively few investment professionals and employees. In his survey of seven large leveraged buyout partnerships, Jensen found an average of 13 investment professionals, who tended to come from an investment banking background. Today, the large private equity firms are substantially larger, although they are still small relative to the firms in which they invest. KKR’s S-1 (a form filed with the Securities and Exchange Commission in preparation for KKR’s initial public offering) reports 139 investment professionals in 2007. At least four other large private firms appear to have more than 100 investment professionals as well. In addition, private equity firms now appear to employ professionals with a wider variety of skills and experience than was true 20 years ago.
Private Equity Funds
The private equity firm raises equity capital through a private equity fund. Most private equity funds are “closed-end” vehicles in which investors commit to provide a certain amount of money to pay for investments in companies as well as management fees to the private equity firm.2 From a legal standpoint, the private equity funds are organized as limited partnerships in which the general partners manage the fund and the limited partners provide most of the capital. Thelimited partners typically include institutional investors, such as corporate and public pension funds, endowments, and insurance companies, as well as wealthy individuals. The private equity firm serves as the fund’s general partner. It is customary for the general partner to provide 1 percent of the total capital, although some invest more.
2
In a “closed-end” investment fund, investors cannot withdraw their funds until the fund is terminated. This is in contrast to mutual funds, for example, where investors can withdraw their funds whenever they like. See Stein (2005) for an economic analysis of closed vs. open-end funds.
The fund typically has a fixed life, usually ten years, but can be extended for up to three
additional years. The private equity firm typically has up to five years to invest the capital committed to the fund into companies, and then has an additional five to eight years to return the capital to its investors. After committing their capital, the limited partners have little say in how the general partner deploys the investment funds, as long as the basic covenants of the fund agreement are followed. Common covenants include restrictions on how much fund capital can be invested in a single company, the types of securities a fund can invest in, and restrictions on debt at the fund level (as opposed to borrowing at the portfolio company level, which is unrestricted). Sahlman (1990), Gompers and Lerner (1996), and Axelson, Strömberg, and Weisbach (forthcoming) discuss the economic rationale for these fund structures.
The private equity firm or general partner is compensated in three ways. First, the general partner earns an annual management fee, which is a percentage of capital committed, and, then, as investments are realized, a percentage of capital employed. Second, the general partner earns a share of the profits of the fund, referred to as “carried interest,” that almost always equals 20 percent. Finally, some general partners charge deal fees and monitoring fees to the companies in which they invest. Metrick and Yasuda (2007) describe the structure of fees in great detail and provide empirical evidence on those fees.
For example, assume that a private equity firm, ABC partners, raises a private equity fund, ABC I, with $2 billion of capital commitments from limited partners. At a 2 percent management fee, ABC partners would receive $40 million per year for the five-year investment period. This amount would decline over the following five years as ABC exited or sold some of its investments. The management fees typically end after ten years, although the fund can be extended thereafter. ABC would invest the difference between the $2 billion and the cumulative management fees into companies.
If the investments of ABC’s fund turned out to be successful and ABC was able to realize $6 billion from its investments – a profit of $4 billion – ABC would be entitled to a carried interest or profit share of $800 million (or 20 percent of the $4 billion profit). Added to management fees of $300 to $400 million, ABC partners would have received a total of almost $1.2 billion over the life of the fund.
In addition, general partners sometimes charge deal and monitoring fees that are paid by the portfolio companies. The extent to which these fees are shared with the limited partners is a somewhat contentious issue in private equity fundraising negotiations. A common arrangement is that these fees end up being split 50-50 between general and limited partners.
The Private Equity Analyst (2008) lists 33 global private equity firms (22 U.S.-based) with more than $10 billion of assets under management at the end of 2007. The same publication lists the top 25 investors in private equity. Those investors are dominated by public pension funds with CalPERS (California Public Employees' Retirement System), CasSTERS (California State Teachers' Retirement System), PSERS (Public School Employees' Retirement System), and the Washington State Investment Board occupying the top four slots.
Private Equity Transactions
In a typical private equity transaction, the private equity firm agrees to buy a company. If company is public, the private equity firm typically pays a premium of 15 to 50 percent over the current stock price.3 (See Kaplan (1989a) and Bargeron et al. (2007).) The buyout is typically financed with anywhere from 60 to 90 percent debt – hence the term, leveraged buyout. The debt almost always
includes a loan portion that is senior and secured, and is arranged by a bank or an investment bank. In the 1980s and 1990s, banks were also the primary investors in these loans. In the last several years, however, institutional investors purchased a large fraction of the senior and secured loans. Those investors include hedge fund investors and “collateralized loan obligation” managers, who combine a number of term loans into a pool and then carve the pool into different pieces (with different seniority) to sell to institutional investors. The debt in leveraged buyouts also often includes a junior, unsecured portion that is financed
3
It is well documented that bidders have to pay a substantial takeover premia to target shareholders when acquiring public firms. The original explanation for this is Grossman and Hart (1980), who argue that target shareholders will not sell unless they share in the future takeover gains that will result from the acquisition.
by either high yield bonds or “mezzanine debt” (that is, debt which is subordinated to the senior debt). See Demiroglu and James (2007) and Standard and Poor’s (2008) for more detailed descriptions.
The private equity firm invests funds from its investors as equity to cover the remaining 10 to 40 percent of the purchase price. The new management team of the purchased company (which may or may not be identical to the pre-buyout management team) typically also contributes to the new equity, but this amount is usually a small fraction of the equity dollars contributed.
Kaplan (2005) describes a large leveraged buyout – the 2005 buyout of SunGard Data Systems – in detail. The SunGard buyout was an $11.9 billion transaction financed with $8 billion of debt ($5 billion of senior secured debt and $3 billion of subordinated debt), $0.3 billion of existing cash, and $3.6 billion of equity. Seven private equity firms contributed $3.5 billion while management contributed $0.1 billion of the equity. Axelson et al. (2008) provide a detailed description of capital structures in these kinds of leveraged buyouts.
Commitments to Private Equity Funds
Private equity funds first emerged in the early 1980s. Nominal dollars committed each year to U.S. private equity funds have increased exponentially since then, from $0.2 billion in 1980 to over $200 billion in 2007. Given the large increase in equity and firm market values over this period, it is more appropriate to measure committed capital as a percentage of the total value of the U.S. stock market. This provides a measure of the real buying power of private equity funds. The deflated series, presented in Figure 1, suggests that private equity commitments are cyclical. They increase in the 1980s, peak in 1988, decline in the early 1990s, increase through the late 1990s, peak in 1998, decline again in the early 2000s, and then begin climbing in 2003. By 2006 and 2007, private equity commitments appear
extremely high by historical standards, exceeding one percent of the value of the U.S. stock market. One caveat to this observation is that many of the large U.S. private equity firms have only recently become global in scope, and a meaningful fraction of the recent commitments will be invested outside the U.S.
Such foreign investments by U.S. private equity firms were much smaller 20 years ago, so the comparisons are not exactly apples to apples.
Although we do not have comparable information on capital commitments to non-U.S. funds, it is clear that they have also grown substantially. The Private Equity Analyst lists three non-U.S. private equity firms in 2007 among the top twelve largest in the world in assets under management.
Private Equity Transactions
Figure 2 shows the number and combined transaction value of worldwide leveraged buyout transactions backed by a private equity fund sponsor based on data from CapitalIQ. In total, 17,171 private equity-sponsored buyout transactions occurred from January 1, 1970, to June 30, 2007.
(Transactions that had been announced but not completed by November 1, 2007, are excluded.) The value of transactions is measured as the combined enterprise value (i.e. market value of equity plus book value of debt minus cash) of the acquired firms, converted into 2007 U.S. dollars. When transaction values are not recorded (generally smaller, private-to-private deals), we impute values as a function of various deal and sponsor characteristics. Figure 1 also uses the CapitalIQ data to report the combined transaction value of U.S. leveraged buyouts backed by a private equity fund sponsor as a fraction of the total U.S. stock market value. See Strömberg (2008) for a description of the sampling methodology and a discussion on potential biases. The most important qualification is that it is likely that CapitalIQ underreports private equity transactions before the mid-1990s, particularly smaller transactions.
The patterns documented in private equity fundraising are mirrored in overall buyout transaction activity. There is a similar cyclicality in fundraising and transactions. The value of transactions peaked in 1988; dropped during the early 1990s, rose and peaked in the later 1990s, dropped in the early 2000s; and increased dramatically from 2004 to 2006. A huge fraction of historic buyout activity has taken place within the last few years. From 2005 through June 2007, CapitalIQ recorded a total of 5,188 buyout transactions at a combined estimated enterprise value of over $1.6 trillion (in 2007 dollars), with those 2
years accounting for 30 percent of the transactions from 1984 to 2007 and 43 percent of the total real value of these transactions, respectively.
Although Figure 2 only includes deals announced through December 2006 (and closed by November 2007), the number of announced leveraged buyouts continued to increase until June 2007 when a record number of 322 deals were announced. Since then, deal activity has decreased substantially in the wake of the turmoil in credit markets. In January 2008, only 133 new buyouts were announced.
As the private equity market has grown, the characteristics of the transactions undertaken have evolved, as summarized in Table 1 (see Strömberg (2008) for a more detailed analysis). The first buyout wave during the late 1980s was primarily a U.S., Canadian, and to a smaller extent a U.K., phenomenon. From 1985-89, these three countries accounted for 89 percent of the worldwide leveraged buyout
transactions and 93 percent of the worldwide value of these transactions. At this time, the leveraged buyout business was dominated by acquisitions of relatively large companies, in mature industries (such as manufacturing and retail), and public-to-private deals accounted for almost half of the value of private equity transactions. As the early private equity research studied the deals of the first buyout wave, these transactions helped form the perception of private equity for years to come: leverage buyouts equal going private transactions of large firms in mature industries.
Following the fall of the junk bond market in the late 1980s, public-to-private activity declined significantly dropping to less than 10 percent of transaction value while the average enterprise value of the companies acquired dropped from $401 million to $132 million (both in 2007 dollars). Instead, “middle-market” buyouts of non-publicly traded firms – either independent companies or divisions of larger corporations – grew significantly and accounted for the bulk of private equity activity at this time. Manufacturing and retail firms became less dominant as buyout targets, as buyout activity spread to new industries such as information technology/ media/telecommunications, financial services, and health care. Although the aggregate value of transactions fell, there were twice as many deals undertaken in 1990-94 compared to the 1985-1989 period.
As private equity activity experienced steady growth over the following period from 1995-2004 (with the exception of the dip in 2000-2001), the market continued to evolve. Buyouts of public companies increased, although buyouts of private companies still accounted for more than 80 percent of the value and more than 90 percent of the transactions during this time. An increasing share of buyout deal-flow came from other private equity funds exiting their old investments. By the early 2000-2004 period, these so-called secondary buyouts made up over 20 percent of total transaction value. The largest source of deals in this period, however, was large corporations selling off divisions.
The buyout phenomenon also spread rapidly to continental Europe. In the 2000-2004 period, the western European private equity market (including the United Kingdom) had 48.9 percent of the total value of worldwide leveraged buyout transactions, compared with 43.7 percent in the United States. The scope of the industry also continued to broaden during this time, with the companies in the services and infrastructure becoming increasingly popular buyout targets.
The private equity boom from the start of 2005 to mid-2007 magnified many of these trends. Public-to-private deals and secondary buyouts grew rapidly both in numbers and size, together accounting for more than 60 percent of the $1.6 trillion in total leveraged buyout transaction value over this time. Buyouts in non-manufacturing industries continued to grow in relative importance, and private equity activity spread to new parts of the world, particularly Asia (although levels were still modest compared to Western Europe and North America). As large public-to-private transactions returned, average (deflated) deal sizes almost tripled between 2001 and 2006.
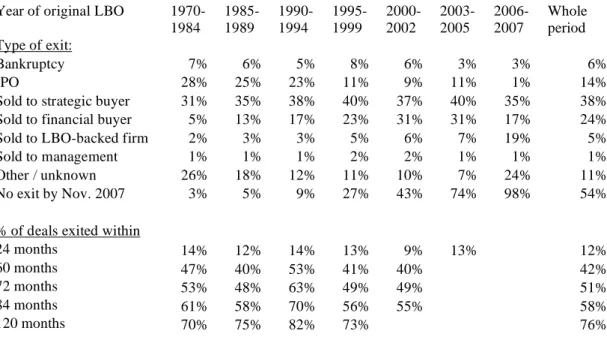
Manner and Timing of Exit
Since most private equity funds have a limited contractual lifetime, exiting the investments is an important aspect of the private equity process. Table 2 presents statistics on the exit behavior of private equity funds using the sample of buyouts from CapitalIQ. The top panel of the table shows the frequency of various exit types. Given that so many leveraged buyout deals occurred in recent years, it is not surprising that 54 percent of the 17,171 transactions in the total sample (going back to 1970) had not yet
been exited by November 2007. This observation raises two important issues. First, any conclusions about the long-run economic impact of leveraged buyouts are bound to be premature. Second, empirical analyses of the performance of leveraged buyouts will very likely suffer from selection bias to the extent they only look at realized investments.
Conditional on having exited, the most common route is the sale of the company to a strategic (i.e. non-financial) buyer; this occurs in 38% of all exits. The second most common exit route is a sale to another private equity fund in a so-called “secondary leveraged buyout” (24%); this exit route has increased considerably over time. Initial public offerings, where the company is listed on a public stock exchange (and the private equity firm can subsequently sell its shares in the public market), account for 14% of exits; this exit route has decreased significantly in relative importance over time.
The low fraction of IPOs does not imply that the growth of private equity has been at the expense of public stock markets, however. Strömberg (2008) shows that for private equity transactions from 1970-2002 period, the fraction of firms eventually going public was 11%, while only 6% of these firms were public before the buyout, implying a positive net flow from private to public equity markets.
Given the high debt levels involved in these transactions, one might expect a non-trivial fraction of LBOs to end up in bankruptcy. For the total sample, 6% of deals have ended in bankruptcy or reorganization. Excluding LBOs occurring after 2002, which may not have had enough time to enter financial distress, the incidence increases to 7%. Assuming an average holding period of six years, this works out to an annual default rate of 1.2% per year. Perhaps surprisingly, this is lower than the average default rate of 1.6% that Moody’s reports for all U.S. corporate bond issuers from 1980-2002 (Hamilton et al 2006). One caveat is that not all cases of distress may be recorded in publicly available data sources; some of these cases may be “hidden” in the relatively large fraction of “unknown” exits (11%). Perhaps consistent with this, Andrade and Kaplan (1998) find that 23% of the larger public-to-private transactions of the 1980s default at some point.
The bottom panel of Table 2 shows the average holding periods for individual LBO transactions. The analysis is done on a cohort basis, to avoid the bias resulting from older deals being more likely to
have been exited. Over the whole sample, the median holding period is around six years, but it seems to have varied over time. In particular, median holding periods were less than five years for deals
undertaken in the early 1990’s, presumably affected by the “hot” IPO markets of the late 1990’s. Recently, private equity funds have been accused of becoming more short-term oriented, preferring to quickly “flip” their investments rather than keeping their ownership of companies to fully realize their value potential. In our analysis, we see no evidence of “quick flips” (i.e. exits within 24 months of investment by private equity fund) becoming more common. On the contrary, holding periods of private equity funds over the 12-, 24-, and 60-month horizons have increased since the 1990s. Overall, only 12% of deals are exited within 24 months of the LBO acquisition date.
Finally, because of the high fraction of secondary buyouts in recent years, the individual holding periods underestimate the total time period in which LBO firms are held by private equity funds.
Accounting for secondary buyouts, Strömberg (2008) shows that the median LBO is still in private equity ownership nine years after the original buyout transaction. In comparison, Kaplan (1991) found the median leveraged-buyout target remained in private ownership for 6.82 years, which is consistent with privately-owned holding periods having increased since the 1980s.
Is Private Equity a Superior Organizational Form?
Proponents and critics of private equity have differing views concerning what private equity investors actually do. Proponents, like Jensen (1989), argue that private equity firms apply financial, governance, and operational engineering to their portfolio companies, and, in so doing, improve firm operations and create economic value.
Criticisms and skepticism come in two different forms. First, some argue that private equity firms take advantage of tax breaks and superior information, but do not create any operational value. Second, some argue that private equity activity is influenced by market timing (and market mispricing) between debt and equity markets. In this section, we consider the proponents’ views and the first set of
criticisms as well as the empirical evidence for them. In the next section, we consider market timing issues in more detail.
Financial, Governance and Operational Engineering
Private equity firms apply three sets of changes to the firms in which they invest, which we categorize as financial engineering, governance engineering, and operational engineering.
Jensen (1989) and Kaplan (1989a; b) describe the financial and governance engineering changes associated with private equity. First, private equity firms pay careful attention to management incentives in their portfolio companies. They typically give the management team a large equity upside through stock and options—a provision that was quite unusual among public firms in the early 1980s (Jensen and Murphy, 1990). Kaplan (1989a) finds that management ownership percentages increase by a factor of four in going from public to private ownership. Private equity firms also require management to make a meaningful investment in the company, so that management has not only a significant upside, but a significant downside as well. Moreover, because the companies are private, management’s equity is illiquid—that is, management cannot sell its equity or exercise its options until the value is proved by an exit transaction. This illiquidity reduces management’s incentive to manipulate short-term performance. It is still the case today that management teams obtain significant equity stakes in the portfolio companies. We collected information on 43 leveraged buyouts in the U.S. from 1996 to 2004 with a median transaction value of over $300 million. Of these, 23 were public-to-private transactions. We find that the CEO gets 5.4% of the equity upside (stock and options) while the management team as a whole gets 16%. Acharya and Kehoe (2008) find similar results in the United Kingdom for 59 large buyouts (with a median value of over $500 million) from 1997 to 2004. In their sample, the median CEO gets 3% of the equity; the median management team as a whole gets 15%. These are similar magnitudes to those in the 1980s public-to-private transactions studied by Kaplan (1989a). Even though stock- and option-based compensation have become more widely used in public firms since the 1980’s, management’s ownership percentages (and upside) are still greater in leveraged buyouts than in public companies.
The second key ingredient is leverage, i.e. the borrowing that is done in connection with the transaction. Leverage creates pressure on managers not to waste money, because they must make interest and principal payments. This pressure reduces the “free cash flow” problems described in Jensen (1986), in which management teams in mature industries with weak corporate governance had many ways in which they could dissipate these funds rather than returning them to investors.4 On the flip side, if leverage is too high, the inflexibility of the required payments (as contrasted with the flexibility of payments to equity) raises the chances of costly financial distress. In the U.S. and many other countries, leverage also potentially increases firm value through the tax deductibility of interest. The value of this tax shield, however, is difficult to calculate because it requires assumptions of the tax advantage of debt (net of personal taxes), the expected permanence of the debt, and the riskiness of the tax shield.
Third, governance engineering refers to the way that private equity investors control the boards of their portfolio companies and are more actively involved in governance than boards of public companies. Boards of private equity portfolio companies are smaller than comparable public companies and meet more frequently (Gertner and Kaplan, 1996; Acharya and Kehoe, 2008; Cornelli, 2008).5 Acharya and Kehoe (2008) report that portfolio companies have twelve formal meetings per year and many more informal contacts. In addition, private equity investors do not hesitate to replace poorly performing management. Acharya and Kehoe (2008) report that one-third of chief executive officers of these firms are replaced in the first 100 days and two-thirds are replaced at some point over a four-year period.
These methods of financial and governance engineering were common in the 1980s. Today, most large private equity firms have added another piece that we call “operational engineering,” which refers to industry and operating expertise that they can use to add value to their investments. Indeed, most top private equity firms are now organized around industries. In addition to hiring dealmakers with financial engineering skills, private equity firms now often hire professionals with operating backgrounds and an industry focus. For example, Lou Gerstner, the former chief executive officer of RJR and IBM is
4
Axelson et al. (2007) also argue that leverage provides discipline to the acquiring leveraged buyout fund, who has to be able to persuade third-party investors--the debt providers--to co-invest in the deal.
5
affiliated with Carlyle, while Jack Welch, the former chief executive officer of GE, is affiliated with Clayton Dubilier. Most top private equity firms also make use of internal or external consulting groups. Private equity firms use their industry and operating knowledge to identify attractive investments, to develop a value creation plan at the time of investment, and to implement the value creation plan. This plan might include elements of cost-cutting opportunities and productivity improvements, strategic changes or repositioning, acquisition opportunities, as well as management changes and upgrades (Acharya and Kehoe, 2008; Gadiesh and MacArthur, 2008).
As mentioned above, critics question whether the different types of engineering have the claimed effects. One alternative explanation is that private equity firms take advantage of asymmetric or
privileged information, usually with the help of incumbent management. Critics often ask why
companies, particularly public companies, need to be bought by a private equity firm and why they cannot implement the same changes on their own.
Operating performance
The empirical evidence on the operating performance of companies after they have been purchased through a leveraged buyout is largely positive. For U.S. public-to-private deals in the 1980s, Kaplan (1989a) finds that the ratio of operating income to sales increased by 10 to 20 percent (absolutely and relative to industry). The ratio of cash flow (operating income less capital expenditures) to sales increase by roughly 40 percent. The ratio of capital expenditures to sales declined. These changes are coincident with large increases in firm value (again, absolutely and relative to industry). Smith (1990) finds similar results. Lichtenberger and Siegel (1990) find that leveraged buyouts experience significant increases in total factor productivity after the buyout.
Most empirical work on private equity and leverage buyouts post-1980s has focused on buyouts in Europe, largely because of data availability. Consistent with the U.S. results in the 1980s, most of this work finds that leveraged buyouts are associated with significant operating and productivity
Bergström et al (2007) for Sweden. Cumming, Siegel, and Wright (2007) summarize much of this literature and conclude there “is a general consensus across different methodologies, measures, and time periods regarding a key stylized fact: LBOs [leveraged buyouts] and especially MBOs [management buyouts] enhance performance and have a salient effect on work practices.”
There has been one general exception to the largely uniform positive operating results – more recent public-to-private buyouts. Guo et al. (2008) study U.S. public-to-private transactions completed from 1990 to 2006. The 94 leveraged buyouts with available post-buyout data are concentrated in deals completed by 2000. The authors find modest increases in operating and cash flow margins that are much smaller than those found in U.S. data in the 1980s and for Europe in the 1990s. At the same time, they find high investor returns (adjusted for industry or the overall stock market) at the portfolio company level. Acharya and Kehoe (2008) and Weir et al. (2007) find similarly modest operating improvements for public-to-private deals in the U.K. over roughly the same period. Nevertheless, Acharya and Kehoe (2008) also find high investor returns. These results suggest that post-1980s public-to-private
transactions may differ from those of the 1980s and from leveraged buyouts overall.
While the empirical evidence is consistent overall with significant operating improvements for leverage buyouts, it has to be interpreted with some caution.
First, some studies, particularly those in the U.S., are potentially subject to a selection bias because performance data for private firms are not always available. For example, most U.S. studies of financial performance have studied leveraged buyouts that use public debt or subsequently go public, and leveraged buyouts of public companies. These may not be representative of the population. Still, studies undertaken in countries where accounting data is available on private firms, and therefore do not suffer reporting biases (e.g., Boucly et al. (2008) for France and Bergström et al. (2007) for Sweden) find significant operating improvements after leveraged buyouts.
Second, the decline in capital expenditures found in some studies raises the possibility that leveraged buyouts may increase current cash flows, but hurt future cash flows. This could occur if private equity funds forced their portfolio companies to boost short-term cash flows in order to service the
buyout debt at the expense of long-term performance. One test of this concern is to look at the
performance of leveraged buyout companies after they have gone through a initial public offering. In the most recent and comprehensive of these papers, Cao and Lerner (2007) find positive industry-adjusted stock performance after such initial public offerings. In another test of whether future prospects are sacrificed to current cash flow, Lerner et al. (2008) study post-buyout changes in innovation as measured by patenting. Although relatively few private equity portfolio companies engage in patenting, those that do patent do not experience any meaningful decline in post-buyout innovation or patenting. In addition, patents filed post-buyout appear more economically important (as measured by subsequent citations) than those filed pre-buyout, as firms focus their innovation activities in a few core areas.
Overall, we interpret the empirical evidence as largely consistent with the existence of operating and productivity improvements after leveraged buyouts, and as largely inconsistent with value destruction or short-termism. Most of these results are largely based on leveraged buyouts completed before the latest private equity wave. The performance of leveraged buyouts completed in the latest private equity wave is clearly a desirable topic for future research, particularly given the increased incidence of large public-to-private transactions.
Employment
Critics of leveraged buyouts by private equity firms often argue that these transactions benefit investors in private equity at the expense of employees who suffer job and wage cuts. While such reductions would be consistent (and arguably expected) with productivity and operating improvements, the political implications of economic gains achieved in this manner would be more negative (for example, see comments from the Service Employees International Union, 2007).
Kaplan (1989a) studies U.S. public-to-private buyouts in the 1980s and finds that employment increases post-buyout but by less than other firms in the industry. Lichtenberg and Siegel (1990) obtain a similar result. Davis et al. (2008) study a large sample of U.S. leveraged buyouts from 1980 to 2005 at the establishment level. They find that employment at leveraged buyout firms increases by less than at
other firms in the same industry after the buyout. This continues a pre-buyout trend, i.e., leveraged buyout firms had smaller employment growth before the buyout transaction. The relative employment declines are concentrated in retail businesses. They find no difference in employment in the
manufacturing sector. For a subset of their sample, Davis et al. (2008) are able to measure employment at new establishments as well as at existing ones. For this subsample the leveraged buyouts companies higher job growth in new establishments than similar non-buyout firms. Davis et al. (2008) are unable to determine the net effect of leveraged buyouts of the lower growth in existing establishments, but higher growth in new ones.
Outside the U.S., Amess and Wright (2006) study buyouts in the United Kingdom from 1999 to 2004 and find that firms which experienced leveraged buyouts have employment growth similar to other firms, but increase wages more slowly. The one exception to the findings in the U.S. and U.K. are those for France by Boucly et al. (2008). They find that leveraged buyouts companies experience greater job and wage growth than other similar companies.
Overall, then, the evidence suggests that employment grows at firms that experience leveraged buyouts, but at a slower rate than at other similar firms (except in France). These findings are not consistent with concerns over job destruction, but neither are they consistent with the diametrically opposite position that firms owned by private industry experience especially strong employment growth (except, perhaps, in France). We view the empirical evidence on employment as largely consistent with a view that private equity portfolio companies create economic value by operating more efficiently.
Taxes
The additional debt taken on in leveraged buyout transactions gives rise to interest tax deductions that are valuable, but difficult to value accurately. Kaplan (1989b) uses a range of assumptions and finds that, depending on the assumption, the reduced taxes from the higher interest deduction can explain from 4 percent to 40 percent of a firm’s value. The lower estimates assume that the leveraged buyout debt is repaid in eight years and that personal taxes offset the benefit of corporate tax deductions. The higher
estimates assume that the leveraged buyout debt is permanent and that personal taxes provide no offset. Assuming that the truth lies between these various extreme assumptions, a reasonable estimate of the value of lower taxes due to increased leverage for the 1980s might be 10 percent to 20 percent of firm value. These estimates would be lower for leveraged buyouts in the 1990s and 2000s, because both the corporate tax rate and the extent of leverage used in these deals have declined. It is safe to say, therefore, that greater leverage does create some value for private equity investors by reducing the taxes owed by the firm, but difficult to say exactly how much.
Asymmetric Information
The generally favorable results on operating improvements and value creation are also potentially consistent with private equity investors having superior information on future portfolio company
performance. Critics of private equity often claim that incumbent management is a plausible source of this inside information. To some extent, supporters of private equity deals agree that incumbent management has information on how to make a firm perform better. After all, one of the economic justifications for private equity deals is that when managers experience better incentives and closer monitoring, they will use their insider knowledge of the firm to deliver better results. However, a less-attractive claim is that incumbent managers root in favor of a private equity buyout, because they intend to keep their jobs under the new owners and receive a lucrative compensation deal. As a result,
incumbent managers may not be willing to fight for the highest price for existing shareholders—and thus the private equity buyer gets a better deal.
Several observations suggest that it is unlikely that operating improvements are simply a result of private equity firms taking advantage of private information. First, Kaplan (1989a) considers this
possibility by looking at the forecasts the private equity firms released publicly at the time of the
leveraged buyout. The asymmetric information story suggests that actual performance should exceed the forecasts. In fact, actual performance after the buyout lags the forecasts. Moreover, Ofek (1994) studies leveraged buyout attempts that failed because the offer was rejected by the board or by stockholders (even
though management supported it) and finds no excess stock returns or operating improvements for these firms. It would be useful to replicate these studies with more recent transactions.
Second, private equity firms frequently bring in new management. As mentioned earlier, Acharya and Kehoe (2008) report that one-third of chief executive officers of their sample firms are replaced in the first 100 days and two-thirds are replaced at some point over a four-year period. Thus, incumbent management cannot be sure that it will be in a position to receive high-powered incentives from the new private equity owners.
Third, it seems likely that at certain times in the boom-and-bust cycle, private equity firms have overpaid in their leveraged buyouts and experienced losses. For example, the late 1980s were one such time, and it seems likely that the tail end of the private equity boom in 2006 and into early 2007 will have lower returns than investors had expected as well. If incumbent management provided inside information, it clearly wasn’t enough to avoid periods of poor returns for private equity funds.
While these findings are inconsistent with operating improvements simply being the result of asymmetric information, there is some evidence that private equity funds are able to acquire firms more cheaply than other bidders. Guo et al. (2008) and Acharya and Kehoe (2008) find that post-1980s public-to-private transactions experience only modest increases in firm operating performance, but still generate large financial returns to private equity funds. This suggests that private equity firms are able to buy low and sell high. Similarly, Bargeron et al. (2007) find that private equity firms pay lower premiums than public company buyers in cash acquisitions. These findings are consistent with private equity firms successfully identifying companies or industries that turn out to be undervalued ex post. Alternatively, this could indicate that private equity firms are particularly good negotiators, and / or that target boards and management do not get the best possible price in these acquisitions.
Overall, then, the evidence is not supportive of an important role for superior firm specific information on the part of private equity investors and incumbent management. The results are potentially consistent with private equity investors bargaining well, target boards bargaining badly, or private equity investors taking advantage of market timing (and market mispricing) which we discuss below.
Private Equity Fund Returns
The empirical evidence at the company level suggests that leveraged buyouts by private equity firms create value (adjusted for industry and market). This finding does not necessarily imply, however, that private equity funds earn superior returns for their limited partner investors. First, because private equity firms often purchase firms in competitive auctions or by paying a premium to public shareholders, sellers likely capture a meaningful amount of value. For example, in KKR’s purchase of RJR Nabisco, KKR paid a premium to public shareholders on the order of $10 billion. After the buyout, KKR’s investors earned a low return, which means that in that deal, KKR paid out most, if not all of the value-added to RJR’s public shareholders. Second, the limited partner investors in private equity funds pay meaningful fees. Metrick and Yasuda (2008) estimate that fees equal $19 in present value per $100 of capital under management for the median private equity fund. This implies that the return to outside investors net of fees will be lower than the return on the private equity fund’s underlying investments.
Kaplan and Schoar (2005) study the returns to private equity and venture capital funds. They compare how much an investor (or limited partner) in a private equity fund actually earned net of fees to what the investor would have earned in an equivalent investment in the Standard and Poor’s 500 index. On average, they find that private equity fund investors earn slightly less than the Standard and Poor’s 500 index net of fees, ending with an average ratio of 93 percent to 97 percent. On average, therefore, they do not find the outperformance often given as a justification for investing in private equity funds. At the same time, however, these results imply that the private equity investors outperform the Standard and Poor’s 500 index gross of fees (i.e., when fees are added back). Those returns, therefore, are consistent with private equity investors adding value (over and above the premium paid to selling shareholders).
At least two caveats are in order. First, Kaplan and Schoar (2005) use data from Venture Economics which samples only roughly half of private equity funds, leaving an unknown and potentially important selection bias. Second, because of data availability issues. Kaplan and Schoar compare performance to the Standard and Poor’s 500 index without making any adjustments for risk.
Kaplan and Schoar (2005) also find strong evidence of persistence in performance — that is, performance by a private equity firm in one fund predicts performance by the firm in subsequent funds. The persistence result is unlikely to be affected by selection bias. In fact, their results likely understate persistence because the worst-performing funds are less likely to raise a subsequent fund. In contrast, mutual funds show little persistence and hedge funds show uncertain persistence. This persistence result explains why limited partners often strive to invest in private equity funds that have been in the top quartile of performers in the past (Swensen, 2000). Of course, only some limited partners can succeed in such a strategy. For example, Lerner, Schoar, and Wang (2007) find that endowments (particularly those of Ivy League Universities) have consistently earned higher returns on their private equity investments than other types of limited partners, such as pension funds, fund-of-funds, and other institutional investors.
Phalippou and Gottschalg (2007) use a slightly updated version of the Kaplan and Schoar (2005) data set. They obtain qualitatively identical results to Kaplan and Schoar (2005) for the average returns and persistence of private equity / buyout funds relevant to this article.
Boom and Bust Cycles in Private Equity
Portfolio Company Level
The pattern of private equity commitments and transactions over recent decades suggests that credit market conditions may affect this activity.
One hypothesis is that private equity investors take advantage of systematic mispricings in the debt and equity markets. That is, when the cost of debt is relatively low compared to the cost of equity, private equity can arbitrage or benefit from the difference. This argument relies on the existence of market frictions that enable debt and equity markets to become segmented. (See Baker and Wurgler (2000) and Baker et al (2003) for arguments that public companies take advantage of market mispricing.)
To see how debt mispricing might matter, assume that a public company is unleveraged and being run optimally. If a private equity firm can borrow at a rate that is too low given the risk, the private
equity firm will create value by borrowing. In the recent wave, interest rate spreads increased from roughly 250 basis points over LIBOR in 2006 to 500 basis points over LIBOR in 2008. (See Standard and Poor’s (2008)). Under the assumptions that debt funds 70% of the purchase price and has a maturity of eight years, debt mispricing of 250 basis points would justify roughly 10 percent of the purchase price or, equivalently, would allow a private equity fund investor to pay an additional 10 percent. (I.e., the present value of an eight year loan discounted at the higher interest rate is 60 rather than 70.)
This also raises the possibility that the private equity firm will find it worthwhile to encourage its portfolio companies to make operating changes that increase current cash flow, but reduce future cash flows, in order to borrow more of the mispriced debt. This would give a different interpretation of the evidence on operating improvements after leveraged buyouts. Still, the fact that Cao and Lerner (2007) and Lerner et al (2008) find no negative effect of buyouts on long-run performance and long-run investment suggests that this may not be a major concern.
Axelson et al (2007) propose a different (not mutually exclusive) hypothesis. They argue that private equity firms are constrained in the amount of fund capital they can invest in a given deal, and therefore have to use leverage to fund their investments. The theory builds on the premise that general partners in a private equity fund can have an incentive to undertake risky but unprofitable investments, because such investments generate fees if the investment is successful, while the downside risk is borne by the limited partner investors in the fund. To mitigate this problem, it is optimal to force general partners to use external leverage to finance the fund’s investments, because it will be harder to get bank loans for unprofitable deals that the general partner may otherwise have an incentive to undertake. As a result, more leveraged buyouts will be undertaken during times when external lenders perceive
investment opportunities to be particularly favorable. Still, because deals are easier to undertake in a favorable credit market environment, there will be some overinvestment in unprofitable deals during these times as well. This implies that the level of buyout activity will correlate positively with the credit market environment, and that the average deal undertaken in “hot” credit markets will underperform the average deal undertaken in “cold” credit markets.
Both of the mispricing and agency-based theories imply that relatively more deals will be undertaken when debt markets are unusually favorable. Kaplan and Stein (1993) present evidence that is consistent with a role for overly favorable terms from high yield bond investors in the 1980s buyout wave. The credit market turmoil in late 2007 and early 2008 suggests that overly favorable terms from debt investors may have helped fuel the buyout wave from 2005 through mid-2007.
To study the cyclicality of the buyout market, we make more detailed “apples-to-apples” comparisons of buyout characteristics over time by combining the results in Kaplan and Stein (1993) for the 1980s buyout wave with the results in Guo et al. (2008) for the last ten years. Both papers study public-to-private transactions in the United States.
First, we look at valuations or prices relative to cash flow. To measure the price paid for these deals, we calculate enterprise value as the sum of the value of debt and equity at the time of the buyout. Firm cash flow is calculated using the standard measure of firm-level performance, EBITDA which stands for earnings before interest, taxes, depreciation, and amortization. Figure 3 reports the median ratio of enterprise value to cash flow for leveraged buyouts by year. The figure shows that prices paid for cash flow were generally higher at the end of the buyout waves than at the beginning. The more recent period, in particular, exhibits a great deal of cyclicality, first dipping substantially in the 2001 to 2003 period and then rising afterwards.
Figure 3 also shows that valuation multiples in the recent wave exceeded those in the 1980s wave, but this conclusion is open to some interpretation. In general, ratios of all corporate values to cash flow were higher in the last decade than in the 1980s. When the ratios in Figure 3 are deflated by the median ratio for non-financial companies in the Standard and Poor’s 500 index, the valuations of leveraged buyout deals relative to the Standard and Poor’s 500 are actually slightly lower in the recent wave. However, even after the calculation, the cyclicality of the recent wave remains.
Next, we look at changes in various aspects of leverage buyout firm capital structures. We compare the ratio of equity used to finance leveraged buyouts in each time period, and find that the share of equity used to finance leveraged buyouts was relatively constant in the first wave at 10 percent to 15
percent, and relatively constant in the second wave, but at roughly 30 percent. This striking increase in equity percentage from one era to the other is both a prediction of and consistent with the arguments in Kaplan and Stein (1993) that debt investors offered overly favorable terms, particularly too much leverage, in the buyout wave of the 1980s.
Valuations relative to EBITDA were higher in the recent wave, but debt levels were lower. Interest rates also changed. Figure 4 combines these factors by measuring the ratio of EBITDA to
forecast interest for the leveraged buyouts of the two eras. This interest coverage ratio is a measure of the fragility of a buyout transaction. When this ratio is lower, it implies that the buyout is more fragile, because the firm has less of a cushion from not being able to meet interest payments. Figure 4 has two interesting implications. First, interest coverage ratios are higher in the recent wave, suggesting the deals are less fragile. Second, the cyclical pattern of the second wave remains. Coverage ratios are higher in the 2001 to 2004 period than in the periods before and after.
Leveraged buyouts of the most recent wave also have been associated with more liberal repayment schedules and looser covenants. Consistent with this, we find patterns similar to (if not stronger than) those in Figure 4 when we factor in debt principal repayments. Demoriglu and James (2008) and Standard and Poor’s (2008) also confirm that loan covenants became less restrictive at the end of the recent wave.
Figure 5 considers this cyclicality in one additional way. It compares the median ratio of
EBITDA to enterprise value for the S&P 500 to the average interest rate on high yield bonds – the Merrill Lynch High Yield (cash pay bonds) – each year from 1984 to 2006. This measures the relation between the cash flow generated per dollar of market value by the median company in the S&P 500 to the interest rate on a highly leveraged financing. One can interpret this operating earnings yield net of interest rate as the excess (or deficit) from financing the purchase of an entire company with high yield bonds.
The pattern is suggestive. A necessary (but not sufficient) condition for a private equity boom to occur is for earnings yields to exceed high yield interest rates. This was true in the late 1980s boom and
in the boom of 2005 and 2006. When operating earnings yields are less than high yield interest rates, PE activity tends to be lower.
These patterns suggest that the debt used in a given leverage buyout may be more driven by credit market conditions than the relative benefits of leverage for the particular firm. Axelson et al. (2008) find evident consistent with this using a sample of large leveraged buyouts in U.S. and Europe completed between 1985 – 2007. They find that leverage is cross-sectionally unrelated to leverage in similar-size public firms in the same industry and is unrelated to firm-specific factors that explain leverage in public firms. Instead, leveraged buyout capital structures are most strongly related to prevailing debt market conditions at the time of the buyout. The extent of leverage in leveraged buyouts is decreasing as interest rates rise. The amount of debt financing available, in turn, seems to affect the amount that the leveraged buyout fund can pay to acquire the firm. Similarly, Ljungqvist et al. (2007) find that private equity funds accelerate their investment pace when interest rates are low. These results are consistent with the availability of debt financing impacting booms and busts in the private equity market.
These patterns raise the question as to why the public firms’ borrowings do not follow the same credit market cycles. One potential explanation is that public firms may not be willing to take on additional leverage to take advantage of debt mispricng, either because managers dislike debt or because public market investors worry about high debt levels.
A second explanation is that private equity funds have better access to credit markets because they are repeated borrowers in the market, which enables them to build reputation with lenders. Recent papers by Ivashina and Kovner (2008) and Demiroglu and James (2007) find that more prominent private equity funds seem to be able to obtain cheaper loans and looser covenants than other lenders.
A third explanation is that the compensation structures of private equity funds provide incentives to take on more debt than is optimal for the individual firm, as suggested by Axelson et al (2007).
The time series of commitments to private equity funds examined earlier appear to exhibit a boom and bust pattern. In this section, we look at this more closely by considering the relation between commitments and returns.
First, we consider the relation between fundraising and subsequent private equity fund returns. Table 3 presents illustrative regressions in which the dependent variable is the capital-weighted return to all private equity funds raised in a particular year. This is referred to as the “vintage year return.” We use the vintage year returns for U.S. private equity funds from Venture Economics as of September 2007 for vintage years 1984 to 2004. The return measures are noisy. As mentioned earlier, Venture Economics
does not have returns for all private equity funds. In addition, the funds that comprise the more recent vintage years are still active and will certainly change over time. This is probably not important, though, because we obtain similar results when we eliminate all vintages after 1999. As independent variables, we use capital committed to private equity funds in the vintage year and the previous vintage year relative to the total value of the U.S. stock market. Regressions 1 to 4 in table 3 indicate a strong negative relation between fundraising and subsequent vintage year returns. The inclusion of a time trend does not affect the results. While this simple regression finding can only be considered illustrative of broader patterns, it suggests that the inflow of capital into private equity funds in a given year can explain realized fund returns during the subsequent ten- to twelve year period when these funds are active. In particular, it strongly suggests that an influx of capital into private equity is associated with lower subsequent returns.
Next we consider the extent to which past returns affect capital commitments. In these regressions, the dependent variable is the annual capital commitment to U.S. private equity funds as a fraction of the U.S. stock market from 1987 to 2006. The independent variables are the each of the three previous year’s returns to private equity, again, as reported by Venture Economics. Note that the annual return to private equityis different from the vintage year return, which was the dependent variable in the previous regression. The vintage year return measures the annual return to all funds raised in a particular year over the life of the fund. So, the vintage year return is a geometric average of many years of returns. In contrast, the annual return to private equity is the return to all private equity funds of different vintages
in a given calendar year. Again, these regressions are meant to be suggestive. In regressions 5 and 6, we find that capital commitments are positively and significantly related to lagged private equity returns. I.e., investors seem to follow good returns. Second, the positive trend is consistent with significant secular growth in private equity fund commitments over time above any cyclical factors.
To summarize the regressions, private equity fund returns tend to decline when more capital is committed to this asset class. Capital commitments to private equity tend to decline when realized returns decline. In other words, the patterns are consistent with a boom and bust cycle in private equity.
Some Speculations
The empirical evidence is strong that private equity activity creates economic value on average. We suspect that the increased investment by private equity firms in operational engineering will ensure that this result continues to hold in the future. Because private equity creates economic value, we believe that private equity activity has a substantial permanent component.
However, the evidence also is strong that private equity activity is subject to boom and bust cycles, which are driven by recent returns as well as by the level of interest rates relative to earnings and stock market values. This seems particularly true for larger public-to-private transactions.
From the summer of 2007 into mid-2008, interest rates on buyout-related debt have increased substantially – if buyout debt can be raised at all. At the same time, corporate earnings may have
softened. In this setting, private equity activity, particularly large public-to-private buyout deals, is likely to be relatively low. Institutional investors are likely to continue to make commitments to private equity for a time, at least, because reported private returns have not declined, but are still robust. As of
September 2007, Venture Economics reports private equity returns over the previous three years of 15.3 percent versus Standard and Poor’s 500 stock market returns of 12.7 percent.
The likelihood that commitments by investors to private equity funds remain robust at the same time that debt markets remain unfavorable will create pressure for private firms to invest the capital committed. Given the fee structure of private equity funds, we do not expect that many private equity
firms will return the money. However, these patterns suggest that the structure of private equity deals will evolve.
First, we suspect that private equity firms will make investments with less leverage, at least initially. While this change may reduce the magnitude of expected returns (and compensation), as long as the private equity firms add value, it will not change risk-adjusted returns.
Second, we suspect that private equity firms will be more likely to take minority equity positions in public or private companies rather than buying the entire company. Private equity firms have
experience with minority equity investments, both in venture capital investments and in overseas investments, particularly in Asia. The relatively new operational engineering capabilities of private equity firms may put them in a better position to supply minority investments than in the past, because private equity firms can provide additional value without having full control. Moreover, top executives and boards of public companies may have an increased demand for minority equity investments as well. Shareholder and hedge fund activism and hostility have increased substantially in recent years (Brav et al., forthcoming). In the face of that hostility, private equity firms are likely to be perceived as partners or “white knights” by some chief executive officers and boards.
Finally, what will happen to funds and transactions completed in the recent private equity boom of 2005 to mid-2007? It seems plausible that the ultimate returns to private equity funds raised during these years will prove disappointing because firms are unlikely to be able to exit the deals from this time period at valuations as high as the private equity firms paid to buy the firms. It is also plausible that some of the transactions undertaken during the boom were less driven by the potential of operating and
governance improvements, and more driven by the availability of debt financing, which also implies that the returns on these deals will be disappointing.
If and when private equity returns decline, commitments to private equity also will decline. Lower returns to recent private equity funds are likely to coincide with some failed transactions, including debt defaults and bankruptcies. The relative magnitude of defaults and failed transactions, however is likely to be lower than after the previous boom in the early 1990s. While private equity returns for this
time period may disappoint, the transactions of the recent wave had higher coverage ratios and looser covenants on their debt than those of the 1980s, which reduces the chances of default. Also, there are reasons to believe that the overall economic costs of the defaults that do occur may not be all that large. Andrade and Kaplan (1998) study the transactions from the 1980s leveraged buyout wave that became financially distressed. They estimate costs of distress not larger than 20 percent of firm value. They also estimate that even the financially distressed buyouts were no less, or even more valuable after the
resolution of financial distress than they were before the leveraged buyout. This implies that the net value impact of the leveraged buyout and distress for those distressed transactions is roughly zero, or even marginally positive. There is no reason to believe that the results for defaulting transactions in the current wave will be any worse.
Acknowledgements
This research has been supported by the Kauffman Foundation, by the Lynde and Harry Bradley Foundation and the Olin Foundation through grants to the Stigler Center for the Study of the Economy and the State, and by the Center for Research in Security Prices. We thank Jim Hines, Antoinette Schoar, Andrei Shleifer, Jeremy Stein, Tim Taylor, and Mike Wright for very helpful comments.
References
Acharya, V. and C. Kehoe, 2008, Corporate Governance and Value Creation Evidence from Private Equity, working paper, London Business School.
Acharya, V., J. Franks, and H. Servaes, 2007, Private Equity – Boom or Bust, Journal of Applied Corporate Finance.
Amess, K. and M. Wright, 2006, The Wage and Employment Effects of Leveraged Buyouts in the UK, working paper, Nottingham.
Amess, K. and M. Wright, 2007, Barbarians at the Gate? Leveraged Buyouts, Private Equity and Jobs, Andrade, G., and S.N. Kaplan,1998. How costly is financial (not economic distress)? Evidenced from Highly Leveraged Transactions that became distressed, Journal of Finance, 53, 1443-1494.
Asquith, P., and T. Wizman, 1990. Event risk, covenants, and bondholder returns in leveraged buyouts. Journal Financial Economics 27, 195–213.
Axelson, U., T. Jenkinson, P. Stromberg, and M. Weisbach, 2008, Leverage and Pricing in Buyouts: An Empirical Analysis, working paper, Swedish Institute for Financial Research.
Axelson, Ulf, Per Stromberg, and Michael Weisbach, forthcoming, Why are buyouts leveraged? The financial structure of private equity funds, Journal of Finance.
Baker, G., 1992, Beatrice: A Study in the Creation and Destruction of Value, Journal of Finance, Baker, M., and J. Wurgler, 2000, The equity share in new issues and aggregate stock returns, Journal of Finance 55, 2219-2257.
Baker, M., R. Greenwood, and J. Wurgler, 2003, The maturity of debt issues and predictable variation in bond returns, Journal of Financial Economics 70, 261-291.
Bargeron L., F. Schlingemann, R. Stulz, C. Zutter, 2007, Why do private acquirers pay so little compared to public acquirers?
Bergström, C., M. Grubb, and S. Jonsson, 2007, The operating impact of buyouts in Sweden: A study of value creation, Journal of Private Equity, Winter 2007.
Bhagat, S., A. Shleifer, and R. Vishny, 1990, Hostile takeovers in the 1980’s: The return to corporate specialization, Brookings Papers on Economic Activity: Microeconomics, Vol. 1990, 1-84.
Boucly, Q., D. Sraer, and D. Thesmar, 2008, Do leveraged buyouts appropriate worker rents? Evidence from French data, working paper, HEC Paris.
Brav, A., W. Jiang, F. Partnoy and R. Thomas, forthcoming, The Returns to Hedge Fund Activism, Journal of Finance.
Cornelli, F., 2008, Private equity and corporate governance: Do LBOs have more effective boards? Working paper, London Business School.