2008 AP P LI E D AN DN ATURAL SCIENCE FO U N D A TIO N ANSF
JANS
Journal of Applied and Natural Science 7 (2) : 700 - 708 (2015)A framework for refining soil microbial indices as bioindicators during
decomposition of various organic residues in a sandy loam soil
Sandeep Sharma
*, Jatinder Kaur, H. S. Thind, Yadvinder Singh, Neha Sharma and
Kirandip
Department of Soil Science, Punjab Agricultural University, Ludhiana-141004 (Punjab), INDIA *Corresponding author. E-mail: [email protected]
Received: March 11, 2015; Revised received: July 12, 2015; Accepted: September 6, 2015
Abstract: Assessment of soil quality is an invaluable tool in determining the sustainability and environmental impact
of agricultural ecosystems. Soil microbial indices like microbial biomass and microbial activity are important criteria for the determination of soil quality. Laboratory incubation study was undertaken to examine the influence of eight crop residues widely varying in biochemical composition on the periodic changes in important soil microbial indices {(microbial (Cmic: Corg), metabolic (qCO2), carbon mineralization (qC) and microbial biomass change rate (qM)
quotients)} at 28 days and 63 days after incubation (DAI) in a sandy loam soil. A. sativa amended soil showed maximum soil respiration rate (14.23 mg CO2-C g-1 soil day-1) whereas T. aestivum amended soil showed maximum
microbial biomass C (790 µg/g). The metabolic quotient among different crop residues ranged from 11.1 to 19.8 μg CO2-C μg-biomass-C-1 h-1 at 63 DAI. The results indicate that incorporation of different crop residues has positive
effect on microbial flora and their activity. Microbial quotient (Cmic:Corg) was significantly positively correlated with microbial biomass carbon (MBC), qC and qM. The study suggests that the biochemical composition of different crop residues seems to be of better option for long term sustainable crop production with maintenance of soil quality in a sandy loam soil.
Keywords: Crop residues, Microbial biomass, Microbial indices, Soil quality
INTRODUCTION
Soil and crop management practices such as cultivation, crop residue production, residue management and fertilization exert a considerable influence on the level of organic matter over time (Campbell et al., 1992). The organic matter plays a key role in determining soil health, which is defined as the soil’s capacity to maintain environmental functions and biological productivity (Bini et al., 2013). It is directly related to different physical, chemical and biological soil properties ( Smith et al., 2000). To circumvent the loss of the organic matter, amendment using crop residue has been regularly being attempted (Bouajila and Sanaa, 2011). The soils amended with crop residues increase the supply of carbonaceous materials as an energy source for the living microorganisms and the dead microbial biomass provide the substrate (Mengel, 1996) leading to a series of biological transformations. The decomposition of crop residues in soil and their carbon and nitrogen mineralization depends on the composition of residues which transforms into CO2,
microbial material and relatively stable humus components (Heal et al., 1997). It has been established that more dynamic characteristics such as microbial biomass, soil respiration and soil enzyme activity respond more quickly to changes in crop management
ISSN : 0974-9411 (Print), 2231-5209 (Online) All Rights Reserved © Applied and Natural Science Foundation www.ansfoundation.org
practices or environmental conditions (Brookes, 1995). Soil microbial biomass (SMB) plays a key role in controlling the nutrient cycling and energy flow in soil ecosystems (Heal et al., 1997). It represents the living fraction of soil organic matter which is responsible for organic matter and residue decomposition (Sparling and Ross, 1993). Soil respiration rate, Cmic:Corg and qCO2 quotients directly reflects soil microbial activities,
and are affected by the eco-environmental changes (Alvarez et al., 1995). The Cmic:Corg and qCO2
quotients was calculated as ratio of microbial biomass carbon (MBC) to soil organic carbon (SOC) and rate of basal respiration per unit of MBC, respectively and these act as indicator of ecosystem disturbance and development (Anderson and Domsch, 1989). The qCO2 has valuable application as a relative measure of
how efficiently the soil microbial biomass is utilizing C resources and the degree of substrate limitation for soil microbes (Wardle and Ghani, 1995; Dilly and Munch, 1998) and expresses the metabolic effectiveness of soil microbial communities (Saviozzi et al., 2002). The qM expresses the fraction of total organic carbon mineralized during incubation peroid (Pinzari et al., 1999). The qC expresses the daily enrichment or loss of soil microbial C (Anderson and Domsch, 1990). During the last few decades, researchers have identified different crop residues with have variable biochemical
701 composition having functional significance in the
turnover of soil organic content (Lehtinen et al., 2014; Pandiaraj et al., 2015). So, knowledge on soil microbial indices and the mineralization of crop residues added to the soil is of utmost importance to address soil management practices to maintain soil quality. Therefore, soil microbial indices can be used as a measure to provide immediate and accurate information about changes occurring in soil during decomposition of different crop residues. The objective of the present research was to evaluate the dynamic changes in soil microbial indices that have been amended with different crop residues.
MATERIALS AND METHODS
Soil description: Laboratory incubation study was
conducted on a sandy loam soil (Typic Ustipsamment) collected from experimental farm of the Punjab Agricultural University, Ludhiana (30◦56’N, 75◦52’E,
247 m above mean sea level) in the Indo-Gangetic plains of north western India. Soil samples (0–0.15m depth) collected randomly from 8 locations within 0.4 ha field were thoroughly mixed to make a bulk sample of approximately 50 kg. The bulk soil sample was partially air dried, sieved through 2 mm sieve and then cleaned manually to remove the visible crop residues and pebbles. The soil was then brought to field capacity moisture condition (20% w/w) and stored in polythene bags at room temperature (19–20oC) for 10 days to
stabilize the biological activity of the soil. The initial soil characteristics of experimental soil were 8.1 pH (1:2 soil/water suspension), 0.38 dS m-1 electrical
conductivity, 4.10 g kg-1 organic carbon (Walkley and
Black, 1934), 9.72 mg kg-1 KMnO
4-oxidizable N
(Subbiah and Asija, 1956) , 3.13 mg kg-1 Olsen P
(Olsen et al., 1954) and 31 mg kg-1 NH
4OAc-K
(using Elico 368 Flame photometer).
Treatments and experimental procedure: The study
was conducted to measure the soil microbial indices at 28 and 63 days of incubation of soil with eight different plant residues viz., Lens culinaris, Avena sativa, Zea mays, Oryza sativa, Saccharum officinarum, Triticum
aestivum, Brassica juncea, Hordeum vulgarae differing
in C/N ratio and chemical composition. All the plant residues were dried at 60+2oC, finely ground (<1 mm)
and stored in plastic bags before their use in the study as well as for the chemical analysis. A known weight of soil (550 g, dry weight basis) was weighed and transferred to one liter size polypropylene pots (9 cm internal diameter and 10 cm long). The soil was then moistened using distilled water to bring it to field capacity. To these pots, 5.5 g (1% dry weight basis) each of the organic residue was added and the contents were uniformly mixed into soil. The base of the pot was tapped firmly to allow the contents to settle to a bulk density of 1.2 g cm-3. Soil sample without crop
residue was also included as a control treatment. The treatments had three replications and the pots were
arranged in a completely randomized block design. The treated pots were incubated at 30˚C for 63 days and moist air was continuously circulated in the incubator.
Plant analysis: The total C and total N of the plant
residues were determined from finely ground subsamples by dry combustion with Vario EL CHN elemental analyser (Heraeus Elementor EL, Hanau, Germany). The plasma atomic emission spectrometer (ICAP -AES) was used to carry out the micronutrients analysis of crop residues.
Biological analysis: Microbial biomass carbon (MBC)
was measured by the chloroform fumigation extraction method (Vance et al., 1987). Two portions of moist soil (20 g oven-dry soil) were weighed, the first one (non-fumigated) was immediately extracted with 80 ml of 0.5 M K2SO4 after orbital shaking for 30 minutes
and then filtering through Whatman no. 42. The second portion was fumigated for 24 hours with ethanol-free CHCl3 and then extracted as described
above. Extractable organic C in soil extracts was analyzed by dichromate digestion. Biomass C was estimated as: Biomass C = 2.64 Ec, where Ec is the difference of K2SO4 extractable C between fumigated
and unfumigated soils. Basal soil respiration (BSR) of the samples were determined by trapping the evolved CO2 in NaOH and the residual NaOH was then back
titrated with HCl (Alef, 1995). Twenty gram soil was accurately weighed and taken in each incubation flask. Ten ml of 0.1M NaOH was pipetted into a vial and the same was inserted into the flask. Thereafter the mouth of the flask was closed with airtight cork. Same procedure was followed for blank with no soil. The sample as well as the blank flask was incubated at 30˚C for 7 days. After incubation period, vial containing NaOH solution was taken out of the flask and the contents were quantitatively transferred to a 50 ml conical flask. Then two-three drops of phenolphthalein indicator solution were added to NaOH, which was then titrated with 0.1 M HCl. The CO2 production was
calculated with the formula provided by Anderson (1982). Soil respiration measurements are reported as: (1) respiration per unit of soil weight and time (basal respiration); (2) respiration per unit of biomass C and time (specific respiration or qCO2) (Badia and Marti,
2003). Specific respiration (Santruckova and Straskraba, 1991), called metabolic quotient of CO2 (qCO2),
represents the CO2 production per unit biomass and
unit time (μg CO2-C μg-biomass-C-1 h-1) (Anderson
and Domsch, 1990).
qM = μg C-CO2 cumulative μg total organic carbon-1
(TOC) (Pinzari et al., 1999);
qC = ((μg Cmict1 -μg Cmict2 ) / μg Cmict1 /(t2 - t1))
qC is calculated as reported by Anderson and Domsch (1990) for qD.
Statistical analysis: Analysis of variance (ANOVA)
was carried out using IRRISTAT version 5.0. Least significance difference (LSD) at a 0.05 level of
702
probability was used to test the significance of differences among treatment means.
RESULTS
The chemical compositions of the different crop residues studied are summarized in table 1. The C content ranged from 34.1% (L. Culinaris) to 42.0 % (A. sativa.
and T. aestivum), and the N contents ranged from 0.40
% (T. aestivum) to 1.71 % (L. culinaris.), resulting in
C/N ratios ranging from 19.9 (L. culinaris) to 105 (T.
aestivum).
Soil respiration: The effect of various crop residues
on microbial respiration after residue incorporation is shown in table 2. The respiration rate was lowest in unamended soil throughout the experiment. In treated soils, the respiration rate peaked on day 7 and then
decreased sharply until day 21 after which remained stable until day 63. The respiration rate on day 7 was highest in the soil with A. sativa residue with 14.23 mg CO2-C g-1 soil day-1 and lowest in the unamended soil
with 8.95 mg CO2-C g-1 soil day-1. Cumulative respiration
on day 7 was lowest in the unamended control soil, and ranged between 25.2 to 27.2 mg CO2-C g-1 soil
day-1 in the residue amended soils, being highest in soil
with A. sativa and lowest with B. juncea residues (Table 3). The patterns of CO2-C evolution against
days for the soil treated with various plant residues were similar. Results showed that, in general, the amount of CO2-C initially released rapidly during the
first 7 days followed by a more slow evolution during the rest of incubation period. The cumulative amount of CO2-C released was significantly higher in all the
plant residue treated soils compared to the control
Table 1. Micronutrients, total carbon, nitrogen and C/N ratio of different crop residues.
Micronutrient content (mg/ka) Content (%)
Crop residues Cu Fe Mn Zn C N C/N
Oat (A. sativa) 17.1 138.7 26.4 17.5 42.0 1.32 31.8
Maize (Z. mays) 24.2 136.4 31.4 25.5 38.2 0.62 61.6
Rice straw (O. sativa) 1.9 217.5 215.7 42.0 38.3 0.81 47.3
Wheat straw (T. aestivum) 16.9 194.7 27.8 15.0 42.0 0.40 105.0
Barley (H. vulgarae) 30.0 292.0 44.3 96.0 35.6 0.71 50.1
Lentil (L. culinaris) 4.7 543.5 64.6 23.2 34.1 1.71 19.9
Sugarcane trash (S. officinarum) 64.6 568.5 52.6 40.4 37.3 0.91 41.0
Mustard (B. juncea) 25.1 221.0 24.7 18.1 40.5 1.18 34.3 S.N. Treatments Days Days 3 7 14 21 28 42 63 1 Control 9.53 8.95 9.97 7.11 6.75 6.67 6.53 2 A. sativa 12.98 14.23 13.20 10.85 10.05 10.12 9.75 3 Z. mays 13.13 13.79 12.76 10.56 10.34 10.27 9.97 4 O. sativa 13.05 13.57 12.98 10.93 10.34 10.34 9.90 5 T. aestivum 12.39 13.57 12.69 10.41 10.12 10.05 10.05 6 H. vulgarae 11.81 13.64 12.69 10.34 10.34 10.34 10.05 7 S. officinarum 12.76 13.71 12.32 10.85 10.49 10.34 9.75 8 L. culinaris 12.91 13.93 13.20 10.41 10.41 10.63 9.97 9 B. juncea 11.37 13.86 13.49 10.93 10.41 10.27 9.97 LSD (0.05) 0.715 0.715 0.758 0.508 0.465 0.391 0.429 S.N. Treatments Days 7 14 21 28 42 63 1 Control 18.5 28.5 35.6 42.3 49.0 55.5 2 A. sativa 27.2 40.4 51.3 61.3 71.4 81.2 3 Z. mays 26.9 39.7 50.2 60.6 70.8 80.8 4 O. sativa 26.6 39.6 50.5 60.9 71.2 81.1 5 T. aestivum 26.0 38.6 49.1 59.2 69.2 79.3 6 H. vulgarae 25.4 38.1 48.5 58.8 69.2 79.2 7 S. officinarum 26.5 38.8 49.6 60.1 70.5 80.2 8 L. culinaris 26.8 40.0 50.5 60.9 71.5 81.5 9 B. juncea 25.2 38.7 49.6 60.1 70.3 80.3 LSD (0.05) 1.06 1.46 1.39 1.46 1.62 1.73
Table 2 . Effect of different crop residues on soil respiration (mg CO2-C g-1 soil day-1).
703
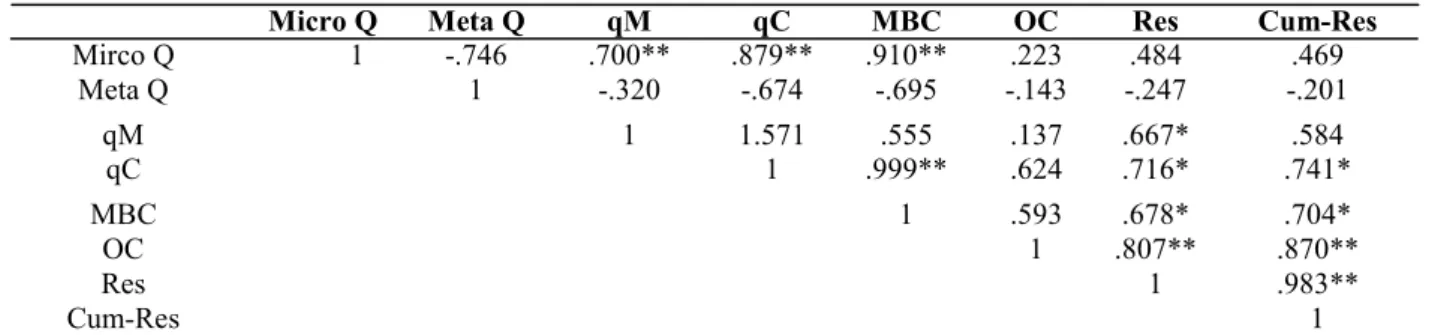
Table 4. Pearson correlation coefficients (r) between soil microbial quotients, microbial biomass carbon, organic carbon (OC) and soil respiration after 28 days.
Micro Q Meta Q qM qC MBC OC Res Cum-Res
Mirco Q 1 -.746 .700** .879** .910** .223 .484 .469 Meta Q 1 -.320 -.674 -.695 -.143 -.247 -.201 qM 1 1.571 .555 .137 .667* .584 qC 1 .999** .624 .716* .741* MBC 1 .593 .678* .704* OC 1 .807** .870** Res 1 .983** Cum-Res 1
Table 5. Pearson correlation coefficients (r) between soil microbial quotients, microbial biomass carbon, organic carbon (OC) and soil respiration after 63 days.
Micro Q Meta Q qM qC MBC OC Res Cum-Res
Micro Q 1 -.681* .731* .858** .891** -.320 .439 .432 Meta Q 1 -.197 -.431 -.536 .419 .162 .150 qM 1 .630 .567 -.347 .711* .683* qC 1 .988** .201 .730* .743* MBC 1 .139 .617 .632 OC 1 .401 .433 Res 1 .986** Cum-Res 1
Micro Q- Microbial quotients; Meta Q – metabolic quotient; qM – carbon mineralization quotient; qC- Microbial biomass change rate quotient ;MBC- microbial biomass carbon; OC- Organic carbon; Res- Soil respiration; Cum-Res- Cumulative soil respiration
Fig.1. Organic carbon content (%) at 28 and 63 days of incubation with application of different crop residues. Treatments are significantly different at p<0.05.
Fig. 2. Microbial biomass C measured at 28 and 63 days of incubation with application of different crop residues. Treatments are significantly different at p<0.05.
704
treatment, regardless of the residue type, biochemical quality and composition.
Soil organic carbon: Different crop residues significantly
increased the soil organic carbon content at 28 days
and 63 days after incubation is given in fig. 1. Soil organic carbon content ranged from 0.643 to 0.937 % at 28 DAI and 0.519 to 0.644% at 63 DAI. The organic carbon content increased in both stages, but was higher
Fig. 3. Microbial quotient at 28 and 63 days of incubation with application of different crop residues. Treatments are significantly differentat p<0.05.
Fig. 4. Metabolic quotient at 28 and 63 days of incubation with application of different crop residues. Treatments are significantly differentat p<0.05.
Fig. 5. Carbon mineralization quotient at 28 and 63 days of incubation with application of different crop residues. Treatments are significantly differentat p<0.05.
Fig. 6. Microbial biomass change rate quotient (qC) ((µg Cmict1-µg C mic t2 )/µg Cmict1 /(t2 -t1)) X 10-3 in different crop residues and control plots after 35 days. Treatments are significantly different at p<0.05.
705 increase in O. sativa followed by Z. mays and minimum
in unamended plot.
Soil microbial biomass carbon: Effect of addition of
crop residue on soil microbial carbon was observed on day 28 and 63, of which maximum activity was observed on day 28 in the soil amended with T. aestivum
residue while the minimum was observed in the unamended soil (Fig. 2). Thereafter, the decreased value was observed on day 63. Soil microbial biomass C ranged from 417 to 790 µg/g. Microbial biomass significantly differed among different species of crop residues. On day 28, statistically significant difference was found between the amended and unamended soil. Similar trend was observed on day 63.
Soil microbial indices: Microbial quotient
(Cmic:Corg) differed significantly among the different species of plant residue (Fig. 3). The microbial quotient among different crop residues ranged from 5.62 to 9.69 and 3.35 to 5.64 at 28 and 63 DAI, respectively. Among different crop residues, B. juncea
showed significantly higher microbial quotient followed by T. aestivum. The metabolic quotient (qCO2) did not differ among the residues at 28 DAI,
whereas amended residues had high values as compared to unamended on day 63 (Fig. 4). The metabolic quotient among different crop residues ranged from 11.1 to 19.8 μg CO2-C μg-biomass-C-1 h-1
at 63 DAI, respectively, of which S. officinarum, H.
vulgarae and Z. mays showed highest activity.
The qM provides information on the fraction of total organic carbon mineralized throughout the incubation time. The qM differed significantly among different crop residues ranged from 0.570 to 0.753 and 1.05 to 1.55 μg C-CO2 cumulative μg TOC-1 at 28 and 63 DAI,
respectively (Fig. 5). Among different crop residues,
B. juncea showed significantly higher C mineralization
quotient followed by L. culinaris in comparison to other residues. The qC was measured in unamended and amended soil with different crop residues (Fig. 6). Microbial loss thus increased significantly under T.
aestivum followed by A. sativa crop residue incorporation
and minimum in unamended plot.
Relationship between organic carbon, soil microbial
indices and microbial biomass C: Correlation
between different microbial quotients, microbial biomass carbon and organic carbon are shown in tables 4 and 5 at 28 and 63 DAI, respectively. Microbial quotient was significantly and positively correlated with qC, qM and MBC. The values of correlation coefficient (r) for microbial quotients ranged from 0.700** to 0.910**. Organic carbon content after 28 days was significantly related with cumulative respiration only. Metabolic quotients were negative correlation with all microbial indices.
DISCUSSION
Soil respiration: The C mineralization was strongly
dependent on the initial chemical composition, which
confirmed the findings of numerous studies on annual crops and perennial crops from natural ecosystems (Jensen et al., 2005). Soil respiration (Cmic) is the production of CO2 by metabolizing organisms within
the soil matrix. It estimates the overall biological activ-ity in the litter–soil layer and is known to be affected by availability of substrate, nutrients, moisture and temperature (Orchard and Cook, 1983; Alvarez et al.,
1995). The addition of amendment in the present study resulted in an increase in soil respiration throughout the experiment in amended soil with maximum activity shown by A. sativa on 7th day (14.23 mg CO
2-C g-1 soil
day-1). As the amount of crop residues was same, thus
the rate of decomposition and availability of substrate could be the reason for the observed differences in respiration rates. An interesting trend of flush of CO2
in the initial stages followed by decrease in soil respiration rate with increase in incubation period was in accordance with the observation of Sánchez -Monedero et al., (2008). The increase in soil respiration rate is expected as easily degradable substrates are added to the soil. Organic matter addition sustained microbial growth for 14 days. It further suggested that substrate use efficiency increased with proceeding decomposition (Atlas and Bartha, 1998). Decreasing respiration in soil under constant conditions may be attributed to nutrient depletion in organic fractions and increasing dominance of recalcitrant molecules (Neely
et al., 1991). Residue addition increased the respiration
compared to the control with greatest increases observed on addition of L. culinaris and A. sativa
which had lower carbon to nitrogen content. Higher C:N ratio as obtained in other crop residues, leads to slow decomposition rate and thus reduced CO2
emission (Henderson et al ., 2010). The cumulative soil CO2 efflux through soil respiration in amended
soil was also found to be higher than unamended soil. This pattern supports our hypothesis that the activity of various crop residues is due to different C/N ratio, showing different decomposition rates. These results can be attributed to the presence of higher cellulose and hemicellulose contents but also to low N content (total and soluble) combined with limited N availability in the soil effect C mineralization and plant residue decomposition (Abiven et al., 2005; Thippayarugs et al., 2008).
Soil microbial biomass carbon: Soil microbial
biomass is an important ecological indicator and acts as a source and sink of available nutrient for plant growth. Little change in soil microbial biomass affects directly on ecosystem stability and fertility of soil. Therefore microbiological status is considered as a suitable indicator of soil health during restoration process of degraded agroecosystems (Haripal and Sahoo, 2014). Our results showed that different crop residue decompose at different rates and, therefore, the nutrients present in them were released at different times. These differences in organic matter decomposition
706
rates are influenced by the chemical composition of the crop residues. The activity of MBC is stimulated by an increase in available carbon (De Nobili et al., 2001) either from residues or root exudates from the plant roots and environmental conditions such as moisture and temperature (Lavelle and Spain, 2002). An overall increase in microbial biomass was observed on 28th
day. Eventually a decreasing trend was observed on 63rd day. . This could be explained by the depletion of
soluble carbohydrates and accumulation of recalcitrant compounds like polyphenols, which could inhibit microbial growth (Sall et al., 2003). Our studies showed that T. aestivum residues supported higher MBC (790 µg/g ) than other crop residues as they have high carbon content (42.0 %) but low nitrogen content (0.040 %). Several studies have shown that C: N ratio has a primary effect on the net N mineralization from residues (Iritani and Arnold, 1960; Frankenberger and Abdelmagid, 1985; Constantinides and Fownes, 1994). Organic residues having low C/N ratio show N mineralization more than those with wide C/N ratio, with the latter mostly causing N immobilization during decomposition (Mary et al., 1996; Alexander, 1977)
Soil microbial indices: Microorganisms are the active
component of soil organic matter and respond rapidly to the changes in the soil temperature, moisture content, crop residues (Rice et al., 1996). Different crop residues incorporation is an essential component with key multifunctional roles in soil quality and related to many physical and biological properties of soil (Smith et al., 2000). Some important parameters may also be derived from MBC, such as Cmic:Corg (Insam and Domsch, 1988), and qCO2 (Insam and
Haselwandter, 1989). Due to the quick response of microorganisms to the soil conditions, MBC could also be a good indicator of soil changes (Alvarez and Alvarez, 2000). The microbial quotient reflects the availability of C substrates for soil microorganisms (Anderson and Domsch, 1989). Llorente and Turrión (2010) used it as an indicator of environmental conditions adversity. The higher microbial quotient in
B. juncea (9.69 Cmic:Corg) followed by T. aestivum
(8.97 Cmic:Corg) than residues of other species indicates
larger substrate availability to the soil microorganisms and a positive trend for organic C accumulation. The decaying litter constitutes the site of an active microbial pool because of the availability of ecophysiological maintenance carbon that serves as their energy source (Anderson and Domsch, 1985). It is known that the energy flux through the microbial biomass is the driving force for decomposition of residues and detritus materials (Smith and Paul, 1990) which is in agreement with our findings that the addition of residues enhances the microbial activity. Powlson et al. (1987) and Wardle (1992) pointed out that the MBC and Cmic:Corg can provide an effective early warning of the deterioration of soil quality. The qCO2 has valuable application as a relative measure of
how efficiently the soil microbial biomass is utilizing
C resources and the degree of substrate limitation for soil microbes (Wardle and Ghani, 1995; Dilly and Munch, 1998). The qCO2 indicates the efficiency by
which soil microorganisms use C-resources in the soil, and it is expected that stressed soils will provide higher qCO2 values than less-stressed soils. Nutrients
acquisition activity is an energetically expensive process particularly when microbes are forced to degrade stable SOM to get new available substrates (Moscatelli et al., 2005). Organic matter additions are capable of either reducing or enhancing a soil’s qCO2,
depending on soil management (Van Antwerpen et al.,
2003). The qCO2 significantly increased in soils
amended with S. officinarum (19.8 μg CO2-C
μg-biomass-C-1 h-1), H. vulgarae (17.0 μg CO 2-C
μg-biomass-C-1 h-1) and Z. mays (16.9 μg CO 2-C
μg-biomass-C-1 h-1) on 63rd day of incubation suggesting
less efficient microbial utilization of C in these cases. Soil treated with T. aestivum showed the lowest qCO2
among the organic-amended soils. This fact suggested that not only the amount of TOC added to the soil but also the quality of organic matter affected the qCO2. A
possible explanation for the different response of the T.
aestivum treatment, as compared to other crop residues
could be the lower degradability of T. aestivum, and therefore the different pool of available C (De Nobili
et al., 1984). Lundquist et al. (1999) also reported
increase in qCO2 with organic matter additions. Our
findings are in close agreement with the increase in the ratio of metabolic quotient with the addition of residues.
Conclusion
Microbial indices proved to be sensitive to changes occurring in soil processes due to addition of different crop residues having different chemical composition. An overall increase in microbial biomass and their activity was observed in amended soil as compared to unamended control. In addition, results obtained under laboratory conditions suggest that the decomposition of crop residues having different chemical composition can be fairly predicted from the initial chemical components of the residues. Therefore, addition of organic matter to soil can maintain the ecological balance of microflora and may also help in enhancement of biological status of soil. The microbial (Cmic: Corg), metabolic (qCO2), carbon mineralization (qC)
and microbial biomass change rate (qM) quotients, all seem to be suitable diagnostic indicator of the quality of the soil.
REFERENCES
Abiven, S., Recous, S., Reyes, V. and Oliver, R. (2005). Mineralisation of C and N from root, stem and leaf residues in soil and role of their biochemical quality. Biology and Fertility of Soils, 42: 119-129.
Alef, K. (1995). Basal respiration. In: Method in Applied Soil Microbiology and Biochemistry. (Eds K Alef, P Nannipieri). Academic Press: Harcourt Brace and
707
Company. Londo) pp. 228-231.
Alexander, M. (1977). Introduction to Soil Microbiology. Second edition. USA, Canada, John Willey & Sons: 467.
Alvarez, C.R. and Alvarez, R. (2000). Short term effects of
tillage systems on active soil microbial biomass. Biology
and Fertility of Soils, 31: 157-161.
Alvarez, R., Santanotoglia, O.J. and Garcia, R. (1995). Effect of temperature on soil microbial biomass and its metabolic quotient in site under different tillage systems. Biology and Fertility of Soils, 19: 227–230. Anderson, J.P.E (1982) Soil respiration. In A.L. Page et at.
(ed.) Methods of soil analysis, Part 2. Chemical and Microbiological Properties (2nd eds). Amercian Society of Agronomy. Madison, Wisconsin USA pp. 831-871. Anderson, T.H. and Domsch, K.H. (1985). Determination of
ecophysiological maintenance carbon requirements of
soil microorganisms in a dormant state. Biology and
Fertility of Soils, 1: 81–89.
Anderson, T.H. and Domsch, K.H. (1989). Ratios of microbial
biomass carbon to total organic-C in arable soils. Soil
Biology and Biochemistry, 21: 471–479.
Anderson, T.H. and Domsch, K.H. (1990). Application of eco-physiological quotients (qCO2 and qD) on microbial biomasses from soils of different cropping histories. Soil Biology and Biochemistry, 22: 251-255.
Atlas, R.M. and Bartha, R. (1998). Microbial Ecology: Fundamentals and applications 4th Edition. Benjamin cummings publishing company Inc. Addison Wesley Longman Inc. pp. 300-350.
Badia, D. and Marti, C. (2003). Effect of simulated fire on organic matter and selected micro biological properties
of two contrasting soils. Arid Land Research and
Management, 17: 55 – 70.
Bini, D., Santos, C., Carmo, B., Kishino, N., Andrade,G., Waldemar, Z. and Nogueira, M. A. (2013). Effects of land use on soil organic carbon and microbial processes associated with soil health in southern Brazil. European Journal of Soil Biology 55: 117-123.
Bouajila, K. and Sanaa, M. (2011). Effects of organic amendments on soil physico-chemical and biological
properties Journal of Material and Environmental
Science, 2: 485-490
Brookes, P.C. (1995). The use of microbial parameters in
monitoring soil pollution by heavy metals. Biology and
Fertility of Soils, 19: 269-279.
Campbell, C.A. Moulin, A.P. Bowren, K.E. Janzen, H.H. Townly-Smith, L. and Biederbeck, V.O. (1992). Effect of crop rotation on microbial biomass, specific respiratory activity and mineralizable nitrogen in a Black Chernozemic soil. Canadian Journal of Soil Sci-ence, 72: 417–427.
Constantinides, M. and Fownes, J.H. (1994). Nitrogen mineralization from leaves and litter of tropical plants: relationships to nitrogen, lignin and soluble polyphenol concentrations. Soil Biology and Biochemistry, 26: 49-55. De Nobili, M., Cercignani, G., Leita, L. (1984). Evaluation
of type and contents of humic substances in sludges and composts. In: Williams JH, Guidi G, L’Hermite P (eds) Long-term effects of sewage sludge and farm slurry applications. Elsevier, London, pp 204–209.
De Nobili, M., Contin, M., Mondini, C. and Brookes, P.C. (2001). Soil microbial biomass is triggered into activity
by trace amounts of substrate. Soil Biology and
Biochemistry, 33: 1163–1170.
Dilly, O. and Munch, J.C. (1998). Ratios between estimates of microbial biomass content and microbial activity in soils. Biology and Fertility of Soils, 27: 374–379. Frankenberger, W.T. and Abdelmagid, H.M. (1985). Kinetic
parameters of nitrogen mineralisation rate of leguminous
crops incorporated into soil. Plant and Soil, 87: 257
-271.
Haripal, K. and Sahoo, S.(2014). Microbial biomass Carbon, Nitrogen, and Phosphorus dynamics along a chronose-quence of abandoned tropical agroecosystems. International Journal of Current Microbiology and Applied Sciences, 3: 956-970
Heal, O.W., Anderson, J.M. and Swift, M.J. (1997). Plant litter quality and decomposition: an historical overview. In: Cadisch G & Giller KE (Eds) Driven by Nature - Plant Litter Quality and Decomposition, CAB International, Wallingford pp 3–30.
Henderson, S.L., Dandie, C.E., Patten, C.L., Zebarth, B.J., Burton, D.L., Trevors, J.T. and Goyer, C. (2010). Changes in denitrifier abundance, denitrification gene mRNA levels, nitrous oxide emissions, and denitrification in anoxic soil microcosms amended with glucose and plant residues. Applied Environmental Microbiology, 76: 2155–2164.
Insam, H. and Domsch, K.H. (1988). Relationship between soil organic carbon and microbial biomass on
chronosequences of reclamation sites. Microbial
Ecology, 15: 177-188.
Insam, H. and Haselwandter, K. (1989). Metabolic quotient of the soil microflora in relation to plant succession. Oecologia, 79: 174-178.
Iritani, W.M. and Arnold, C.Y. (1960). Nitrogen release of vegetable crop residues during incubation as related to their chemical composition. Soil Science, 9: 74-82. Jensen, L.S, Salo, T., Palmason, F., Breland, T.A.,
Henriksen, T.M., Stenberg, B., Pedersen, A., Lundström, C. and Esala, M. (2005). Influence of biochemical quality on C and N mineralisation from a
broad variety of plant materials in soil. Plant and Soil,
273: 307-326.
Lavelle, P. and Spain, A.V. (2002). Soil Ecology. Kluwer Academic Publisher, The Netherlands.
Lehtinen, T., Schlatter, N., Baumgarten, A., Bechini, L., Krüger, J., Grignani, C., Zavattaro, L., Costamagna, C. and Spiegel, H. (2014). Effect of crop residue incorporation on soil organic carbon and greenhouse
gas emissions in European agricultural soils. Soil Use
and Management, 30: 524–538.
Llorente, M. and Turrión, M. (2010). Microbiological parameters as indicators of soil organic carbon dynamics in relation to different land use management. European Journal of Forest Research, 129: 73-81. Lundquist, E.J, Jackson, L.E., Scow, K.M. and Hsu, C.
(1999). Changes in microbial biomass and community composition, and soil carbon and nitrogen pools after incorporation of rye into three California agricultural soils. Soil Biology and Biochemistry, 31: 221–236. Mary, B., Recous, S., Darwis, D. and Robin, D. (1996). Inter
-actions between decomposition of plant residues and nitrogen cycling in soil. Plant and Soil, 181: 71–82. Mengel, K. (1996). Turnover in soil and its availability of
crops. Plant and Soil, 181: 83-93.
Moscatelli, M.C., Lagomarsino, A., Marinari, S., De Angelis, P., Grego, S. (2005). Soil microbial indices as bioindicators of environmental changes in a poplar
708
plantation. Ecological Indicator, 5: 171–179
Neely, C.L., Beare, M.H., Hargrove, W.L. and Coleman, D.C. (1991). Relationships between fungal and bacterial substrate-induced respiration, biomass, and plant resi-due decomposition. Soil Biology and Biochemistry, 23: 947-954.
Olsen, S.R., Cole, C.V., Watanabe, F.S. and Dean, I.A. (1954) Estimation of available phosphorus in soils by extraction with sodium bicarbonate, U.S. Department of Agriculture Cirle. 939: 1-19.
Orchard, V.A and Cook F.J. (1983). Relationship between
soil respiration and soil moisture. Soil Biology and
Biochemistry, 15: 447–453.
Pandiaraj, T., Selvaraj, S. and Ramu, N. (2015). Effects of Crop Residue Management and Nitrogen Fertilizer on Soil Nitrogen and Carbon Content and Productivity of Wheat (Triticum aestivum L.) in Two Cropping Systems. Journal of Agricultural Science and Technology, 17: 249-260.
Pinzari, F., Trinchera, A., Benedetti, A. and Sequi, P. (1999). Use of biochemical indices in the Mediterranean environment: comparison among soils under different
forest vegetation. Journal of Microbiololgy and
Methods, 36: 21–28.
Powlson, D.S., Brookes, P.C. and Jenkinson, D.S. (1987). Measurement of soil microbial biomass provides an early indication of changes in total soil organic matter due to straw incorporation. Soil Biology and Biochemistry, 19: 159–164.
Rice, C.W., Moorman B.T. and Beare M. (1996) Role of Microbial Biomass Carbon and Nitrogen in Soil Quality. V: Methods for Assessing Soil Quality. Doran W.J.in Jones A.L. (ur.) Madison, Wisconsion USA, Soil Science Society of America pp 144-173.
Sall, S.N., Masse D., Bernhard-Reversat F., Guisse A. and Chotte J.L. (2003). Microbial activities during the early stage of laboratory decomposition of tropical leaf litters: The effect of interactions between litter quality and
exogenous inorganic nitrogen. Biology and Fertility of
Soils, 39: 103–111.
Sánchez-Monedero, M.A., Mondini, C., Cayuela, M.L., Roig, A., Contin, M. and De Nobili, M. (2008). Fluorescein diacetate hydrolysis, respiration and
microbial biomass in freshly amended soils. Biology
and Fertility of Soils, 44:885–890.
Santruckova, H. and Straskraba, M. (1991). On the relationship between specific respiration activity and microbial biomass in soils. Soil Biology and Biochemistry, 23: 525-532.
Saviozzi, Y.A., Bufalino, P.. Levi-Minzi, R. and Riffald, R. (2002). Biochemical activities in a degraded soil restored by two amendments: a laboratory study. Biology and Fertility of Soils, 35 96-101.
Smith, J.L and Paul, E.A. (1990). The significance of soil biomass estimations. Soil Biochemistry 6 eds (Bolag JM and Stotzky G) Marcel Dekker, New York pp 357-396. Smith, K.A., Dobbie, K.E., Ball, B.C., Bakken, L.R., Sitaula,
B.K, Hansen, S.R., Brumme, R., Borken, W., Christensen,
S., Priemé, A., Fowler,D., Macdonald, J.A., Skiba, U.,
Klemedtsson, L., Kasimir-Klemedtsson, A., Degórska,
A. and Orlanski, P. (2000), Oxidation of atmospheric
methane in Northern European soils, comparison with other ecosystems, and uncertainties in the global terrestrial sink. Global Change Biology, 6: 791–803.
Sparling, G.P. and Ross, D.J. (1993). Biochemical methods to estimate soil microbial biomass: current developments and applications. In: Mulongy K, Merckx R (eds) Soil organic matter dynamics and sustainability of tropical agriculture. Wiley-Sayce Co-Publication, IITA/K.U, Leuven, The Netherlands, pp 21–37.
Subbiah, B.V. and Asija, G.L. (1956). A rapid procedure for
estimation of available nitrogen in soils. Current
Science, 25: 259–260.
Thippayarugs, S., Toomsan, B., Vityakon, P., Limpinuntana, V., Pananothai, A. and Cadish, G. (2008). Interactions in decomposition and mineralization between tropical
legume residue components. Agroforestry Systems, 72:
137-148.
Van Antwerpen, R., Haynes, R., Meyer, J.H. and Hlanze, D. (2003). Assessing organic amendments used by sugarcane growers for improving soil chemical and biological
properties. Proceeding of South Afercian Sugur
Technologists Association, 77: 293-299.
Vance, E.D., Brookes, P.C. and Jenkinson, D.S. (1987). An extraction method for measuring soil microbial biomass C. Soil Biology and Biochemistry, 19: 703–707. Walkley, A. and Black, I.A. (1934). An examination of the
degtjareff method for determining soil organic matter and a proposed modification of the chromic acid titration method. Soil Science, 37: 29-38.
Wardle, D.A. (1992). A comparative assessment of factors which influence microbial biomass carbon and nitrogen levels in soils. Biological Reviews, 67: 321– 358. Wardle, D.A. and Ghani, A. (1995). A critique of the microbial
metabolic quotient (qCO2) as a bioindicator of disturbance and ecosystem development. Soil Biology and Biochemistry, 27: 1601–1610.