ProbCast: Open-source Production, Evaluation and
Visualisation of Probabilistic Forecasts
Jethro Browell
Electronic and Electrical Engineering University of Strathclyde
Glasgow, UK [email protected]
Ciaran Gilbert
Electronic and Electrical Engineering University of Strathclyde
Glasgow, UK [email protected]
Abstract—Probabilistic forecasts quantify the uncertainty as-sociated with predictions about the future. They are useful in decision-making, and essential when the user’s objective is risk management, or optimisation with asymmetric cost functions. Probabilistic forecasts are widely utilised in finance and weather services, and increasingly by the energy industry, to name a few applications. The R package ProbCast provides a frame-work for producing probabilistic forecasts using a range of leading predictive models, plus visualisation, and evaluation of the resulting forecasts. It supports both parametric and non-parametric density forecasting, and high-dimensional dependency modelling based on Gaussian Copulas. ProbCast enables a
simple workflow for common tasks associated with probabilistic forecasting, making leading methodologies more accessible then ever before. These features are described and then illustrated using an example from energy forecasting, and the first public release of the package itself accompanies this paper.
Index Terms—Probabilistic Forecasting; Software, Uncertainty Quantification
I. INTRODUCTION
Quantifying the uncertainty associated with predictions is necessary in many situations, not least in power system operation. Probabilistic forecasting of electricity demand [1], renewable energy generation [2], and market prices [3] are all active areas of research and are increasingly being deployed in practice [4]. As the field matures, focus is moving towards more nuanced aspects of forecasting methodology, such as feature selection and engineering, modelling large-scale de-pendency structures including hierarchies, and realising value through innovative end-use. Therefore, it is desirable for both researchers and practitioners to work within a software framework that supports quick deployment of established tools but is flexible enough to incorporate novel elements. ProbCastis anRpackage written with this in mind, and its first public release is presented here. A strong motivation for producingProbCastis the lack of an existing framework for handling non-parametric densities in general, particularly those specified by multiple quantiles with, optionally, parametric tail distributions. While developed by energy forecasters, the potential scope of ProbCastis broad.
Numerous software packages exist for forecasting tasks ranging from commercial products, which typically automate
the process to a large degree and may include proprietary methodologies, and packages in scripting languages, which are typically open-source and provide a common framework for interacting with a range of statistical models. TheR package forecast[5], [6], for example, provides tools for time series forecasting. Other Rpackages, such as scoringRules[7] and fanplot [8], supplement forecasting packages with tools for evaluating and visualising probabilistic forecasts. The Python package RESgen [9], was developed for high dimensional energy forecasting, similar to ProbCast, but provides only a single methodology for density forecasting and covariance modelling, and is not actively maintained. Similarly the package MEFM, implementing the electricity demand methodology from [10] provides a wrapper functions for a single model.
ProbCast provides a modular modelling chain for the production of probabilistic forecasts supporting a broad range statistical models for parametric and non-parametric density forecasting, parametric models for extreme quantiles, and high-dimensional multi-variate forecasting. Additional func-tionality for forecast cross-validation, visualisation and evalu-ation is also provided. Central toProbCastis theMultiQR data structure for the results of multiple quantile regression. Standardising the format of this data allows for non-parametric predictive distributions to be fully specified when accompanied by routines for interpolation between quantiles and extrapo-lation beyond the upper and lower quantiles. It also provides interfaces between parametric distributions and other function-ality. Multi-dimensional forecasting is handled in a Gaussian Copula framework with a range of covariance estimation techniques.ProbCastis currently maintained and developed by researchers at the University of Strathclyde where it serves the dual purpose of accelerating and disseminating research.
This paper presents the first release of ProbCast in Sections II to VI, from it’s data classes for parametric and non-parametric density forecasts, to methods (functions) for fitting predictive models, dependency modelling, visualisation, and forecast evaluation. In Section VI an example based on the wind track of the 2014 Global Energy Forecasting Competition is presented, and the future development of ProbCast is
discussed in Section VIII.
II. PROBABILISTICFORECASTINGPARADIGM The first contribution of ProbCast is a common format for the storage of probabilistic forecasts of multiple continuous variables without being restricted to parametric distributions. In the parametric case, each predictive distribution is fully specified by predictions of the distribution’s parameters, of which there are typically a small number (per variable in the multivariate case, plus dependency structure), restricting the shape of the distribution. A non-parametric predictive (multivariate) distribution is not restricted in its shape but may be more complicated to specify, for example via kernel density estimation or quantile regression. ProbCast introduces a data class MultiQRfor storing the quantiles of a predictive distribution and methods for visualising and performing fore-cast evaluation.
Second,ProbCastprovides wrapper functions for a range of powerful predictive modelling techniques with support for cross-validation using parallel computation. Currently, wrap-pers for the following methods are included:
• gradient boosted regression trees, using gbm[11] • generalised additive models (GAM) for location, scale
and shape, using gamlss[12]
• boosted GAMLSS models, using gamboostLSS[13] • boosted quantile-GAMs, using mboost[14]
• a two-stage model based on linear quantile regression for the residuals of conventional GAMs based onmgcv[15], [16]
These approaches may be applied to general supervised learn-ing problems and time series forecastlearn-ing.
In any case, the aim is to produce the predictive distribution
ˆ
Dt of target variable yt∼Dt given explanatory information
Xt, which may include lagged values ofyt. In the multivariate
case yt is a vector, and Dˆt and Dt are multivatiate
distribu-tions.Dˆtmay be a parametric distribution, which is discussed
further in Section IV, otherwiseDˆtmust be constructed some
other way. ProbCastprovides methods for constructingDˆt
from multiple quantiles qτ,t τ =τ1, ..., τQ via interpolation
between quantiles and extrapolation beyond the upper and lower quantiles. Linear and monotonic cubic spline interpo-lation are supported. The interpointerpo-lation may be extended to user-specified boundaries, or alternatively an exponential tail distribution may be employed. Subscriptstare dropped in the remained of the paper to simplify notation.
III. MULTIPLEQUANTILEREGRESSION
Multiple quantile regression is a model based approach to constructing non-parametric conditional distributions. Typ-ically separate models are fτ(X) are estimated for evenly
spaced probability levels τ = τ1, ..., τQ to predict the
con-ditional quantilesqˆτ ofy∼Dˆ [17]. The functionsfτ(X)are
computed by minimising the mean of the Pinball Loss
ρτ(y−qˆτ) =
(
τ|y−qˆτ| if y≥qˆτ
(1−τ)|y−qˆτ| if y <qˆτ
(1)
over some set of training data in a supervised learning frame-work.
However, estimating a separate model for each quantile does not guarantee that the sequence of quantiles is non-decreasing, i.e. qˆτ1 ≤ qˆτ2 ≤ ... ≤ qˆτQ, as required to consider each quantile a point of a cumulative distribution function. Empirically, it is sufficient to re-order quantiles if
Qis sufficiently large.ProbCastincludes a check for non-decreasing quantiles and optional re-ordering. An extension to an ADMM-based estimator for multiple linear quantile regression has been proposed in [18] to produce multiple quantile regression that are constrained to be non-decreasing, but similar facilities are not available for the majority of learning algorithms.
In addition to direct quantile regression on the target vari-able y, ProbCastfacilitates a two-stage approach whereby the residuals of a GAM are modelled via linear quantile regression, as proposed by [15]. The linear quantile regression may be performed on a user-specified model or using the same smooth terms as estimated for the GAM with a further option use the smooth terms from a second GAM fit to the squared residuals of the first.
IV. SEMI-PARAMETRICREGRESSION
If the predictive distribution is assumed to be parametric,
y∼Dˆ(θ1, θ2, ...), the forecasting task is to predict the values of those parameters. Semi-parametric regression provides a framework for this where each parameter of the predictive distribution may be a GAM-type linear model of covariates. Each parameter is given by
gi(θi) =Xiβi+ Ni
X
n=1
si,n(Xi,n) (2)
where gi(·) is a link function, βi are linear regression
coefficients, and si,n(·) are typically smooth functions, the
second derivative (or ‘wiggliness’) of which are penalised during model estimation, though other types of learner may be incorporated.
Semi-parametric regression models are estimated by max-imising the penalised log-likelihood of the chosen distribution. ProbCast provides and interface to the gamlss pack-age, which implements two algorithms for model estimation with guarantees on maximisation for a given smoothness penalty [12], andgamboostLSS, which provides a gradient boosting algorithm for estimating gamlss-type models [13], [19]. Both support a wide range of parametric distributions, including censored and inflated varieties which are necessary when forecasting bounded variables.
While this approach restricts the shape of the predictive distribution, there are advantages of using this framework if suited to the specific problem. These include having a smaller number of regression models to estimate in order to specify the full distribution, avoiding imprecision introduced by inter-polating between quantiles, and having predictive distributions with well defined tails automatically.
V. MULTIVARIATEPROBABILISTICFORECASTING For some applications, probabilistic forecasts of multiple variables may be required, which requires that the inter-dependency between variables be captured in the forecast. Typical examples in power systems include spatial dependency between renewable generation during a given time period, temporal dependency for a single variable, or a combination of both. Copulas provide a useful framework for this task by separating the univariate marginal distributions and the dependency structure. For continuous predictive marginals
ˆ
Fi(·)there exists a unique copula functionC(·)that describes
the H-dimensional cumulative distribution [20]
ˆ F(y1, y2, ..., yH) =C ˆ F1(y1),F2ˆ (y2), ...,FˆH(yH) . (3) ProbCast has been developed with large scale problems in mind and therefore currently only supports Gaussian Copulas. Other bi-variate Copulas and vine structures for higher dimen-sional dependencies with tail dependency may be added in the future. The Gaussian copula is described by
CF1ˆ (y1),F2ˆ(y2), ...,FˆH(yH)
=
ΦΣ Φ−1( ˆF1(y1)),Φ−1( ˆF2(y2)), ...,Φ−1( ˆFH(yH)) (4)
where Φ−1(·) is the inverse standard normal distribution function and ΦΣ(·) the H-dimensional normal distribution
function with zero mean and covariance matrix Σ. Therefore, this covariance matrix specifies the entire dependency structure and needs to be estimated. Once the marginal distributions and covariance matrix have been estimated, forecasts are produced by sampling from the Gaussian copula and transforming each sample through the standard normal distribution function and the inverse-marginal distributions. The Gaussian Copula provides an efficient framework for modelling dependency structures, but estimating the covariance matrix and sampling can become difficult in high dimensions.
A range of options have been proposed for estimating Σ
including the empirical covariance calculated on training data, parametric estimates where some structure is assumed (e.g. exponential, Cauchy) [21, Chapter 4], and the graphical lasso for sparse estimation.ProbCastcurrently supports empirical covariance and simple parametric structures, but user-defined alternatives are straight forward to incorporate.
Note that the copula links uniformly distributed marginals
uh= ˆFh(yh), which are obtained via the Probability Integral
Transform (PIT). Probcast includes methods for this for MultiQR data structures and for the parametric regression modelling techniques discussed in Section IV. Additionally, visualising and testing the uniformity of the PIT data zh is a
useful tool in forecast evaluation.
VI. FORECASTEVALUATION
The evaluation of probabilistic forecast can be challenging and subtle, whether diagnosing a model fit or comparing two entirely different forecasting methods. The principles of probabilistic forecast evaluation are discussed in [22], notably
highlighting that a density forecast should be as sharp as possi-ble subject to calibration.Sharpnessis analogous to the width or ‘confidence’ of the predictive distribution, andcalibration (also called reliability) is the property that the proportion of observations exceeding each predicted probability level matches that nominal probability.
A range of scores and diagrams are widely used to evaluate various aspects of forecast performance.ProbCastprovides methods for standard evaluation metrics and visualisations including the Pinball Loss, reliability diagrams, and PIT histograms [22], [23]. These methods take a MultiQR data object and associated realisations to compute and visualise these scores. A valuable feature not available in other packages is the ability to easily separate scores by a user-specified covariate to aid with model diagnostics and more detailed evaluation. Additionally, confidence intervals may be gener-ated via bootstrap re-sampling and added to plots, which are useful when limited volumes of data are available.
Efficient implementations of the Continuous Rank Proba-bility Score (CRPS), Multivariate Energy Score (MES) [24] and Variogram Score [25] are available in scoringRules so not duplicated here.
VII. WINDPOWEREXAMPLE
To illustrate the functionality of ProbCast we provide the following example of wind power forecasting using data from the Global Energy Forecasting Competition 2014 (GEF-com2014) [26]. The data and a script implementing this example are supplied with ProbCast. The data is divided into a test and training set, two models are fit and then evaluated. The first is a gradient boosted tree fit using gbm, inspired by the winning entry from GEFcom2014 [27], and the second is a GAMLSS model for the inflated beta distribution. The inflated beta distribution is a mixture between a Bernoulli distribution with parameter γ and standard beta distribution beta(y|µ, φ)with weightsαand(1−α), respectively [28]. Its probability density function is written
beinf(y|µ, φ, α, γ) = α(1−γ) if y= 0 αγ if y= 1 (1−α)beta(y|µ, φ) otherwise . (5) The probability massesα(1−γ)andαγ on boundariesy= 0
and y = 1, corresponding to zero and rated power output, make this an appealing choice for wind power forecasting.
ProbCastprovides an ‘S3 method’ for theplotfunction inRto automatically visualiseMultiQRobjects with a single function call. An example is provided in Figure 1a.
By default the q50 is not plotted as this can mislead users who may interpret a deterministic forecast as the most likely temporal trajectory [29]. A reliability diagram for the gbm-based model, disaggregated by wind speed prediction, produced by the reliability function in ProbCast is illustrated in Figure 2.
Similarly, evaluation of forecast sharpness is provided through the Pinball Loss and options for plotting and
sub-Time Index [Hours] P o w er [Capacity F actor] Prediction Interval 90% 80% 70% 60% 50% 40% 30% 20% 10% 1 2 3 4 5 6 7 8 9 11 13 15 17 19 21 23 0.0 0.2 0.4 0.6 0.8 1.0
(a) Fan plot of the gbm example wind power density forecast. Plot produced by the S3 method plot.MultQR() provided in
ProbCast.
Lead Time [Hours]
P o w er [Capacity F actor] 1 2 3 4 5 6 7 8 9 11 13 15 17 19 21 23 0.0 0.2 0.4 0.6 0.8 1.0
(b) A set of 200 temporal trajectories for the forecast issue time as Figure 1a. Produced using the GAMLSS predictive densities and empirical covariance structure.
Fig. 1: While density forecast such as those illustrated on the left quantify uncertainty at individual points in time, they do not provide any information about dependency between time periods. The temporal trajectories on the right do provide this information but, it is difficult to visualise effectively.
0.0 0.2 0.4 0.6 0.8 1.0 0.0 0.2 0.4 0.6 0.8 1.0 Nominal Empir ical Ideal <=4.5 4.5 to 6 6 to 7.3 7.3 to 9 >9
Fig. 2: Example of reliability diagrams for wind power fore-casts separated by the NWP forecast of 100m wind speed [m/s], shown in different colours. Translucent areas illustrate 95% confidence intervals estimated via bootstrap re-sampling. In this example, the forecasts show a significant bias when the wind speed is forecast to be low.
setting are provided, similar to the reliabilityfunction. An example visualisation of the Pinball Loss is given on Figure 3.
Here, we extend the example to show the capabilities of ProbCastfor multivariate forecasting. To model the
tempo-0.0 0.2 0.4 0.6 0.8 1.0 0.00 0.02 0.04 0.06 0.08 0.10 Quantile Pinball Loss <=4.9 4.9 to 6.3 6.3 to 7.8 7.8 to 9.6 >9.6
Fig. 3: Example Pinball Loss diagram for wind power forecasts separated by the NWP forecast of 100m wind speed [m/s], shown in different colours. Translucent areas illustrate 95% confidence intervals estimated via bootstrap re-sampling. In this example the influence of the above rated region of the power curve is clear, giving a lower Pinball Loss in the upper region of the distribution at high wind speeds. Another useful choice for binning the score is by lead time.
TABLE I: Example multivariate evaluation results for temporal trajectories using ProbCastandscoringRulesaveraged over each cross-validation fold and test data. The marginal corresponds to the technique used to produce density forecasts.
Marginals Fold ID ES wVS1 wVS.5 gbm Fold 1 0.5542 0.4514 0.9878 Fold 2 0.5592 0.5020 1.0825 Fold 3 0.5408 0.3988 0.9455 Test 0.5820 0.5518 1.0926 gamlss Fold 1 0.5821 0.4247 0.9552 Fold 2 0.5946 0.4655 1.0230 Fold 3 0.5541 0.3800 0.9196 Test 0.6406 0.5233 1.0543
ral dependency of forecast errors across the forecast horizon in a Gaussian Copula framework, a set of Gaussian-distributed residuals from the forecast are calculated by transforming training data using the PIT and the inverse standard normal distribution function, zh,t = Φ−1( ˆFh,t(yh,t)) where h and t
are the forecast lead-time and issue time, respectively. These are then used to estimate the H×H covariance matrixΣ as either the empirical covariance or some parametric form.
ProbCast includes functionality for K-fold cross-validation. When used this returns out-of-sample density fore-casts, from which the required zh,t variables are generated
and used to estimate the matrix Σk, k = 1, ..., K for each
fold. This ensures that all aspects of the forecasts evaluated using cross-validation are as representative of out-of-sample performance as possible.
Once the model Copula and marginals have been estimated, an arbitrary number N temporal trajectories, or ‘scenario forecasts’ y˜h,t(n), h= 1, ..., H, n= 1, ..., N may be produced by drawing N samplesz˜h,t(n) fromΦΣ and transforming them
through y˜h,t(n) = ˆF−
1
h,t(Φ(˜z
(n)
h,t)). An example set of scenario
forecasts is illustrated in Figure 1b.
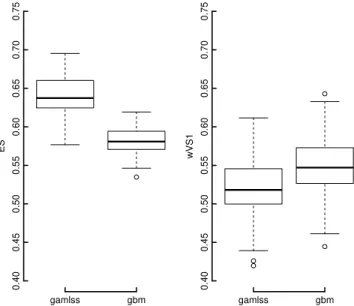
It is straightforward to evaluate forecasts produced by ProbCast using the packagescoringRules, which pro-vides a range of efficient implementations of scoring functions. In particular it provides some closed-form solutions for the Continuous Rank Probability Score, and scores for multivariate forecasts. Three common multivariate evaluation measures are presented in Table I for the temporal trajectories produced in this example. These are the Energy Score (ES), and two variants of the weightedp-Variogram Score (wVSp), for each cross-validation fold and test data. Each copula has marginals based on either multiple quantile regression (gbm), or the semi-parametric regression (gamlss). Often, as is the case here, there is only relatively minor changes in the mean ES score between models. Therefore, bootstrap sampling can be used to estimate the sampling variation of the mean score [23]. An example of this is shown in Figure 4 using a simple block bootstrap, for two multivariate evaluation scores during testing.
This example highlights the current capabilities of ProbCast, and as such we exclude necessary elements
ES 0.40 0.45 0.50 0.55 0.60 0.65 0.70 0.75 gamlss gbm wVS1 0.40 0.45 0.50 0.55 0.60 0.65 0.70 0.75 gamlss gbm
Fig. 4: Boxplots showing the results of block bootstrap sam-pling of two example multivariate scores from the test data for models with marginals produced by the two different methods, gbm andgamlss. The Energy Score (left) shows clear separation between the two configurations, unlike the variogram based score (right). This method can also be used to establish any robust change in evaluation scores for different dependency types. Note that the ES is sensitive to both the skill of the marginals and the dependency structure, where as the VS only evaluates the dependency structure.
of modelling such as feature engineering, selection, hyper-parameter tuning, etc. for brevity. However, this package provides the necessary framework for conducting these tasks in a fast and efficient manner.
VIII. DISCUSSION ANDCONCLUSIONS
The utility of probabilistic forecasting is well established but their production, evaluation, and general manipulation using scripting languages typically requires several hundred lines of bespoke code. ProbCast is an R package which provides a modular framework for uni- and multi-variate probabilistic forecasting with support for a wide range of statistical leaning techniques, evaluation and diagnostic tools, and visualisation. It provides a data structure, MultiQR, for storing tables of multiple predictive quantiles. It has been developed with energy applications in mind, for example [30], [31], but the functionality it provides is more generally applicable.
As well as simplifying the deployment of forecasting routines, the modular nature of ProbCast supports rapid development development and testing of novel methodologies. This paper presents the first public release of ProbCast but further developments are required in order to provide a comprehensive toolkit. Planned developments include sup-port for rolling model updates and adaptive models, hyper-parameter selection, comparative evaluation (see [23] for ex-ample), alternative CDF approximation methods, and
speci-fying parametric covariance structures. ProbCast will also be used to accelerate and disseminate future research of novel methodologies including estimation of time-varying and high-dimensional covariance matrices, hierarchical forecasting, and probabilistic forecast combination.
Anyone can expandProbCast’s functionality, for example by writing wrapper functions for new learning algorithms following the format of those already included. Contributions from the wider community are welcome, and we hope will be included in future releases.
ACKNOWLEDGMENT
Jethro Browell is supported by an EPSRC Innovation Fel-lowship (EP/R023484/1); Ciaran Gilbert is supported by the University of Strathclyde’s EPSRC Centre for Doctoral Train-ing in Wind and Marine Energy Systems (EP/L016680/1).
Data Statement: All data and code used in this paper are provided in the release v0.1-beta ofProbCast, which accom-panies this publication [32, doi: 10.5281/zenodo.3843333].
This version of ProbCast can be installed by run-ning the R command devtools::install_github( "jbrowell/[email protected]"). Results can be reproduced by running the file ‘Example.R’ included in the package.
REFERENCES
[1] T. Hong and S. Fan, “Probabilistic electric load forecasting: A tutorial review,”International Journal of Forecasting, vol. 32, no. 3, pp. 914– 938, jul 2016.
[2] C. Sweeney, R. J. Bessa, J. Browell, and P. Pinson, “The future of forecasting for renewable energy,”Wiley Interdisciplinary Reviews: Energy and Environment, sep 2019.
[3] J. Nowotarski and R. Weron, “Recent advances in electricity price forecasting: A review of probabilistic forecasting,” Renewable and Sustainable Energy Reviews, vol. 81, no. Part 1, pp. 1548 – 1568, 2018. [Online]. Available: http://www.sciencedirect.com/science/article/pii/S1364032117308808 [4] R. Bessa, C. M¨ohrlen, V. Fundel, M. Siefert, J. Browell, S. Haglund
El Gaidi, B.-M. Hodge, U. Cali, and G. Kariniotakis, “Towards improved understanding of the applicability of uncertainty forecasts in the electric power industry,”Energies, vol. 10, no. 9, 2017.
[5] R. Hyndman and Y. Khandakar, “Automatic time series forecasting: The forecast package for R,”Journal of Statistical Software, vol. 26, no. 3, 2008.
[6] R. Hyndman, G. Athanasopoulos, C. Bergmeir, G. Caceres, L. Chhay, M. O’Hara-Wild, F. Petropoulos, S. Razbash, E. Wang, and F. Yasmeen, forecast: Forecasting functions for time series and linear models, 2020, r package version 8.11. [Online]. Available: http://pkg.robjhyndman.com/forecast
[7] A. Jordan, F. Kr¨uger, and S. Lerch, “Evaluating probabilistic forecasts with scoringRules,”Journal of Statistical Software, vol. 90, no. 12, pp. 1–37, 2019.
[8] J. A. Guy, “fanplot: An R package for visualising sequential distribu-tions,”The R Journal, vol. 7, no. 1, p. 15, 2015.
[9] J. Iversen and P. Pinson, “RESGen: Renewable Energy Scenario Gener-ation Platform,” inProceedings of IEEE PES General Meeting. United States: IEEE, 2016.
[11] B. Greenwell, B. Boehmke, J. Cunningham, and G. Developers,gbm: Generalized Boosted Regression Models, 2019, r package version 2.1.5. [Online]. Available: https://CRAN.R-project.org/package=gbm
[10] R. J. Hyndman and S. Fan, “Density forecasting for long-term peak electricity demand,”IEEE Transactions on Power Systems, vol. 25, no. 2, pp. 1142–1153, May 2010.
[12] R. A. Rigby and D. M. Stasinopoulos, “Generalized additive models for location, scale and shape,”Journal of the Royal Statistical Society: Series C (Applied Statistics), vol. 54, no. 3, pp. 507–554, 2005. [Online]. Available: https://rss.onlinelibrary.wiley.com/doi/abs/10.1111/j.1467-9876.2005.00510.x
[13] B. Hofner, A. Mayr, N. Fenske, and M. Schmid, “gamboostlss: Boosting methods for gamlss models.” [Online]. Available: https://CRAN.R-project.org/package=gamboostLSS
[14] T. Hothorn, P. Buehlmann, T. Kneib, M. Schmid, and B. Hofner, “mboost: Model-based boosting, R package version 2.9-2.” [Online]. Available: https://CRAN.R-project.org/package=mboost.
[15] P. Gaillard, Y. Goude, and R. Nedellec, “Additive models and robust aggregation for GEFCom2014 probabilistic electric load and electricity price forecasting,”International Journal of Forecasting, vol. 32, no. 3, pp. 1038–1050, Jul 2016.
[16] S. Wood,Generalized Additive Models: An Introduction with R (2nd edition). Chapman and Hall/CRC.
[17] R. Koenker, Quantile Regression. John Wiley & Sons, Ltd, 2014. [Online]. Available: http://dx.doi.org/10.1002/9781118445112.stat07557 [18] A. Ali, J. Z. Kolter, and R. J. Tibshirani, “The multiple quantile graphical model,” in29th Conference on Neural Information Processing Systems, Barcelona, Spain, 2016.
[19] A. Mayr, N. Fenske, B. Hofner, T. Kneib, and M. Schmid, “Generalized additive models for location, scale and shape for high dimensional data-a flexible data-approdata-ach bdata-ased on boosting,”Journal of the Royal Statistical Society: Series C (Applied Statistics), vol. 61, no. 3, pp. 403–427, Jan 2012.
[20] R. Nelsen,An Introduction to Copulas. Springer-Verlag GmbH, 2007. [21] B. Finkenstadt, L. Held, and V. Isham, Eds.,Statistical Methods for
Spatio-Temporal Systems. Chapman and Hall/CRC, Oct 2006. [22] T. Gneiting, F. Balabdaoui, and A. E. Raftery, “Probabilistic forecasts,
calibration and sharpness,” Journal of the Royal Statistical Society: Series B (Statistical Methodology), vol. 69, pp. 243–268, 2007. [23] J. W. Messner, P. Pinson, J. Browell, M. B. Bjerreg˚ard, and I. Schicker,
“Evaluation of wind power forecasts—an up-to-date view,”Wind Energy, Mar 2020.
[24] T. Gneiting and A. E. Raftery, “Strictly proper scoring rules, prediction, and estimation,” Journal of the American Statistical Association, vol. 102, no. 477, pp. 359–378, 2007.
[25] M. Scheuerer and T. M. Hamill, “Variogram-based proper scoring rules for probabilistic forecasts of multivariate quantities,”Monthly Weather Review, vol. 143, no. 4, pp. 1321–1334, 4 2015.
[26] T. Hong, P. Pinson, S. Fan, H. Zareipour, A. Troccoli, and R. J. Hyndman, “Probabilistic energy forecasting: Global energy forecasting competition 2014 and beyond,” International Journal of Forecasting, vol. 32, no. 3, pp. 896–913, Jul 2016.
[27] M. Landry, T. P. Erlinger, D. Patschke, and C. Varrichio, “Probabilistic gradient boosting machines for GEFCom2014 wind forecasting,” Inter-national Journal of Forecasting, vol. 32, no. 3, pp. 1061–1066, 2016. [28] R. Ospina and S. L. P. Ferrari, “Inflated beta distributions,”Statistical
Papers, vol. 51, no. 1, pp. 111–126, March 2008.
[29] A. E. Raftery, “Use and communication of probabilistic forecasts,” Statistical Analysis and Data Mining: The ASA Data Science Journal, vol. 9, no. 6, pp. 397–410, Feb 2016.
[30] C. Gilbert, J. Browell, and D. McMillan, “Leveraging turbine-level data for improved probabilistic wind power forecasting,”IEEE Transactions on Sustainable Energy, pp. 1–1, 2019.
[31] ——, “Probabilistic access forecasting for improved offshore opera-tions,”International Journal of Forecasting, 5 2020.
[32] J. Browell and C. Gilbert, “Probcast: an R package for flexible probabilistic forecasting.” [Online]. Available: https://github.com/jbrowell/ProbCast
![Fig. 3: Example Pinball Loss diagram for wind power forecasts separated by the NWP forecast of 100m wind speed [m/s], shown in different colours](https://thumb-us.123doks.com/thumbv2/123dok_us/9896141.2483169/4.918.82.439.535.823/example-pinball-diagram-forecasts-separated-forecast-different-colours.webp)