Classification Based Analysis on Cancer Datasets Using Predictor
Measures
J. Adarsh Samuel Raj1* , Y. Sunil Raj2, Charles Savarimuthu3, Dinesh Kumar4
1Department of Computer Science and Engineering
Sastra University, Vallam, India
2Department of Computer Science
St. Joseph’s College, Trichy, India
3Department of Computer Science and Engineering
Al-Musana College of Tech, Oman
4Department of Health science and technology,
Instituito Politecnico deLeiria, Portugal
*Corresponding author email : aadarshjn@gmail.com
Abstract
Cancer is a life-threatening disease. Probably the most effective way to reduce cancer deaths is to detect it earlier. Diagnosing the disease earlier needs an accurate and reliable procedure which could be used by physicians to distinguish between cancer from malignant ones without leaving for surgical biopsy. Data mining offers solution for such types of the problems where a large quantity of information about patients and their conditions are stored in clinical database. This paper focuses on prediction of some such diseases like Leukemia and Breast cancers. Naïve Bayes and SVM prediction models are built for the prediction and classification. The performance of the proposed models produced significant results of above 96% while compared with other models in terms of accuracy, computational time and convergence.
Keywords: Prediction, Data Mining, Diagnosis, Cancer, Naïve Bayes, Supper Vector machine (SVM).
DOI: 10.7176/CEIS/10-6-05
Publication date:September 30th, 2019
1. Introduction
Data mining has emerged as a growing field of multidisciplinary research for discovering interesting useful knowledge from large databases. Medical Data Mining is a branch of data mining, with the problem of scientific decision-making for the diagnosis and treatment of a disease by extracting useful knowledge from large databases. Relationships and patterns could provide new medical knowledge, for the actual data is from clinical databases [24]. The prediction system is implemented using Naïve Bayes classifiers for quantifying the subjective variables, identifying significant patterns and classifying the presence, non-presence of the disease.
Cancer is still one of the deadly diseases in the world [15]. Cancer disease is the abnormal growth of cells in particular organ that spreads over to invade other tissues of the body. Cancer can be triggered by both internal and external factors. Cancers is of various types could be identified and named as the organ they formed. Few familiar cancer diseases are lung cancer, liver cancer, breast cancer etc. Accurate cancer prediction is significant for the fruitful application of specific medications.
In general, cancers are formed on the functional organ cells of the human body. The life cycle of the cells begins by growing in a controlled way and divide to create more cells to keep the body fit. The cells die and replaced with new ones when they become old or damaged. However, occasionally this cycle fails or gets disturbed due to many reasons. At the point when this happens, cells do not kick the bucket of course and new cells are structured actually when the body does not require them. These additional cells may structure a mass of tissue called a tumor. Tumors can be either benevolent or harmful. Though the prediction of Cancer has developed in the recent years, there is still a necessity for a completely computerized and less subjective method for cancer diagnosis.
This paper presents the prediction accuracy of Naïve Bayes classification algorithm over certain medical data-sets and also to compare the prediction accuracy of SVM classification algorithm with respect to two types of cancer data-set such as leukemia and breast cancers. The results are to be analyzed with two factors such as prediction accuracy and time.
2. Literature Review
Gopala Krishna Murthy, et. al., have found that algorithm for classification of data can be used on diverse data sets. It was observed that, the accuracy of any tool may differ depending on the data set chosen. Study also presents that the classifiers of a specific group did not perform with equal accuracies.
Priyanga Andrea, Prakasam, has evaluated the performance of different distances that can be used in the classification algorithm. Various data mining techniques were used to predict and it was found the classifiers with greater accuracy. Also have come out with an architecture of data mining technique based prediction system, combining the prediction system with mining technology.
Saleema, et al., have found the classifiers provides better accuracy while classifying the data after applying sampling techniques. After sampling using traditional random sampling and stratified sampling techniques have been applied. The balanced stratified sampling with variations as per the choice of the prognosis class labels have been tested at the next level. The model for classification was built with three known classifiers namely Decision Tree, Naive Bayes and K-Nearest Neighbor.
Shweta Kharya., have analyzed various data mining techniques widely used for breast cancer diagnosis. Among the numerous data mining classifiers decision tree was found to be best predictor with higher classification accuracy. It was found that predictor can be used to accept the predictor variables. Results shows that decision tree based prediction will best suit to rural regions, to imitate human diagnostic expertise for prediction of ailment. Senthamarai Kannan, et al., have focused at the use of biological knowledge in developing analytic techniques. As the result was produced it was observed that, over a long time the random variable spent around 25.96% of time in A, and around 28.56% of time in G, nearly 34.69% of the time in C finally 10.79% of the time in T state. It was found that the percentage of result is almost same at all the states.
Krishnaiah, et al., have developed a prototype for a prediction system using data mining classification techniques. It was found that the effective model to predict cancer decease is Naïve Bayes when followed by IF-THEN rule. Also have used Decision Trees and Neural Network for comparing the result. And result proved that Naïve Bayes performs better than Decision Trees as it identified every significant medical predictors. The emphasis was to find the target group of people who needs further screening to make prevalence and mortality rate could be brought down.
Ada, Rajneet Kaur., in their study have use some data mining classification techniques such as SVM for detection and classification of Lung Cancer in X-ray chest films. Due to high number of false positives extracted, a set of 160 features was calculated and a feature extraction technique was applied to select the best feature. The digital X-ray films are classified in two categories: normal and abnormal. The normal or negative ones are those characterizing a healthy patient. Abnormal or positive ones include types of lung cancer.
DursunDelen, et. al, has reported on effort by developing several prediction models for breast cancer survivability. Three popular data mining methods such as ANN, decision trees and logistic regression have been used. To measure prediction accuracy of the three methods, a 10-fold cross-validation procedure is used which means dividing the dataset into 10 mutually exclusive partitions. The accuracy measure for the model is calculated by averaging the 10 models performance numbers. The aggregated results indicated that the logistic regression model came out to be the worst with a classification accuracy of 89.2%.
Thangaraju, et. al., have experimented with several data mining classification techniques and it is found that the Naive Bayes algorithm gives a better performance over the supplied data set with the accuracy of 83.4%. It is believed that the data mining can significantly help in the Lung Cancer research and ultimately improve the quality of health care of Lung Cancer patients. It can also be implemented using several classification techniques. Kaishi Li, et. al., have found significant improvement in classifying by applying feature selection in the basis of the gene expression profiles. Have also expressed that choice of features could improve the classification of the diseased and normal stage samples, and the potential application of feature screening to produce feature sets, with better accuracies and lowest number of embedded features. Also have proved that feature selection to be an essential and affirmative step in the biomedical data mining models based on gene expression profiles.
XiangchunXiong, et al., have explored that statistical and mining techniques together can offer great promice in uncovering patterns hidden in data. In the study they have used PCA, PLS1 regression, decision tree, association rules, select attribute techniques to obtain good results. The result is found to be best so that it can be used as reference for doctor’s decision-making and organization’s research.
Chun-Hui Wu, et al., have worked in predicting prostate cancer and have found the average classification accuracy is close to 80%. This study employs data mining techniques to explore the hidden knowledge among meridian energy of prostate cancer from 213 patients’ health examination data including patient demographics and evaluations for prostate-specific antigen (PSA) blood test as well as the meridian energy. Through the construction of decision tree, totally ten classification rules for predicting prostate cancer are extracted. It is found that the rules generated are helpful to reference in diagnosis and treatment of prostate cancer for TCM physicians.
SoltaniSarvestani, et al., has investigated on the use of different classes of breast cancer. The proposal was initially evaluated using some internationally available data set. Later a diagnostic system was constructed that this system performs quite well. The performance of these neural network structures was investigated for breast cancer and have found PNN gives the best classification accuracy when the test set is considered.
Yao Liu, et al., has investigated in data classification algorithms, discrete particle swarm optimization and has proved to be competitive in predicting breast cancer. It was found that use of data mining techniques in cancer classification increases the chance of making a correct and early detection, which could prove to be vital in combating the disease.
Nashat Mansour, et al., have analyzed breast cancer and presented a method to detect a clustering pattern of the genes causes breast cancer. Here a design was proposed to explore growing hierarchical self-organizing map to mine gene microarray data.
R. Agrawal, R. Shrikant, have presented new algorithms, Apriori and AprioriTid, for discovering all significant association rules between items in a large database of transactions. As the average transaction size increases, the execution time increases only gradually. These experiments demonstrate the feasibility of AprioriHybrid in real applications involving very large databases.
Antonio, et al., have proposed statistical indicators, which are related to the activity: initiative, regularity of the learners and the activity caused by the learners. EM clustering algorithm classified the learner statistical indicators and learner collaboration levels, which were provided by an expert, were used to validate the clustering classification as a collaboration level classification.
3. Medical Imaging Data
Clinical data have a peculiar position based upon their applicability to all people and their urge including life or death and a moral obligation to be used for beneficial purposes [23]. The major points of uniqueness of medical data may be organized as follows:
3.1Heterogeneity of medical data
Raw medical data are voluminous and heterogeneous. The leading areas of medical data mining may be organized as follows:
3.1.1 Volume and complexity of medical data
More and more medical procedures employ imaging as a preferred diagnostic tool. Therefore, there is a demand to evolve methods for prompt mining in databases of images, which are challenging than mining in numerical. It is apparently hard for an unaided human to process gigabytes of records, though dealing with images is relatively easier for humans to recognize patterns.
3.1.2 Importance of Physician’s Interpretation
The physician’s interpretation of pictures, signals, or other clinical data, is recorded in Unstructured free-text English, which is hard to standardize and thus arduous to mine [25]. Not only do they use different names as
synonyms to describe the same disease, but they render the task even more daunting by using different grammatical constructions to describe relationships among medical entities.
3.1.3Sensitivity and specificity analysis
Sensitivity measures the ability of a test to be positive when the condition is actually present [23]. Specificity measures the ability of a test to be negative when the condition is actually not present.
3.1.4Poor mathematical characterization of medical data
Specific feature of MDM is that the underlying data structures of medicine are poorly characterized mathematically, as compared to many areas of the physical sciences. Physical scientists collect data which they can put into formulas.
3.2Ethical, legal, and social issues
There are tremendous ethical and legal custom designed to forbid the mistreatment of patients and misuse of their data. The major points of the ethical, legal, and social issues in medicine may be organized as follows:
3.2.1Privacy and security of human data
Privacy and security concerns of individual patient is not only a potential breach of patient confidentiality, with the possibility of ensuing legal action but also erosion of the physician–patient relationship.
De-identified data are collected initially with patient-identifiers, which are afterwards encoded or encrypted. Identified data can only be collected under significant review by the institution, federal Guidelines etc. with the patient giving written informed consent.
3.2.2Expected benefits
Any use of patient data, even de-identified, must be justified to the IRB as having some expected benefits. Performing data analysis for nefarious purpose is not possible legally and ethically. However, the Internet is the cheapest and most convenient way to distribute data, and the most accessible to the public which may have legitimate reasons for access.
3.3Statistical philosophy
Human medicine is primarily a patient care activity and serves only secondarily as a research resource. In general, the consideration for collecting data or refusal to collect certain data, is to benefit the patient [18]. Some patients might consent to be involved in research projects that do not benefit them directly, but such data collection is typically very small scale, narrowly focused, and highly regulated by legal and ethical considerations. The major points of statistical philosophy in medicine may be organized under.
3.3.1Ambush in statistics
Classical statistical tests are designed from the idea of a repeatable experiment, with rules set up in advance. It is not fair to change rules in the middle of an experiment, because the formulas and distributions become meaningless. Thus, classical and statistical tests are made use of in medicine subjected to ambush. It is astonishing, but real, that intellectual paradigm of classical statistics relies not only upon the actualized numbers collected, but also upon priori assumptions at the outset of the statistical investigation.
3.3.2Data mining as a super set of statistics
Though data mining and statistics both are employed in identifying the structure in data. Data mining draws heavily from many other disciplines, most notably machine learning and database technology. Data mining differs from statistics in that it deals with mixed data fields, whereas just assorted numbers in the case of statistics. Good example of heterogeneous data is medical data that, include images, signals, clinical information like temperature, cholesterol levels, urinalysis data, etc., as well as the physician’s interpretation written in unstructured English [16].
4. Methodology
The study starts with parameter estimation, which actually helps identifying the useful attributes. Also here during estimation of parameter sample correction is undergone. Sample correction is followed by applying Naïve Bayes classifier to classify while the same data set is classified using support vector machine. The methodology used throughout this study is described as follows:
Estimating the parameters for the distribution of feature's, generating non parametric models for the features from the training set is required. Dealing with continuous data may include a typical assumption that every class are distributed according to a Gaussian distribution.
Naïve Bayes classifier only requires a little amount of training data to compute means and variances of the variables necessary for classification. Support Vector Machine is a set of methods used for classification and regression, belong to a family of generalized linear classification. Training vectors are mapped into a higher, may be infinite dimensional space by the function Ф.
5. Results and Discussion
Primary goal is to have a comparative analysis on two classic algorithms such as Naïve Bayes and SVM in terms of prognosticating the existence of cancer disease in organs specifically, breast and bone marrow. The breast data-set is UCI Machine Learning Repository and the Leukemia data-data-set is from Bio-Informatics Research group.
5.1Breast cancer dataset description
The database reflects the chronological grouping of the data. The samples consist of visible assessed nuclear features of fine needle aspirates which was from patients' body. Every sample has been assigned a 9-dimensional vector (attributes 3 to 9 below) by Dr. Wolberg. Each component is in the interval 1 to 10, with value 1 corresponding to a normal state and 10 to a most abnormal state. Attribute 1 is sample number, while attribute 2 designates whether the sample is benign or malignant. Malignancy to is observed by picking sample tissue from the patient's body and undergoing a biopsy on it. Biopsy or periodic examination are the ways to confirm benign diagnosis. This depends on the patient's choice. Groups in file are separated as the groups with a line opening with ##### and the number of points in that group. With one data point per line, there are 11 attributes per data point. Attribute are separated by commas. The number of instances chosen are 699, where attributes existed about 10 plus the class attribute. Number of attributes found to be missing are 16.
Table 1. Breast Cancer Analysis
BenOgn MalOgnant
BenOgn 428 5
MalOgnant 21 234
Table 1 theorize that among 683 instances 428 instances are classified to be benign and 255 instances are classified into malignant. Hence the experimentation proved that the algorithm works well even with high dimensional dataset. In binary classification, precision also called positive predictive value is the fraction of retrieved instances that are relevant, while recall also known as sensitivity.
Parameter Estimation
Naive Bayes
Sample Correction
Figure1. Bar chart for breast cancer dataset using Naïve Bayes algorithm
5.2Leukemia Cancer Dataset Description
The dataset consists of 38 samples, where 27 of Acute Myeloid Leukemia (AML) and 11 of Acute Lymphoblastic Leukemia (ALL). Gene expression levels are measured using high density oligonucleotide microarrays.
The Number of Instances is 38 and number of Attributes found are 7129 plus the class attribute and there is no Missing attributes. The domain of the attributes is set to real as the gene expression may fall under real values.
Table 2. Leukemia Cancer calculation
TP RATE 1
FP RATE 0
PRECISION 1
RECALL 1
F MEASURE 1
Table 2 describes the values of Naïve Bayes classifier over leukemia cancer dataset. Precision and recall are therefore based on an understanding and measure of relevance.
Table 3. Leukemia Cancer result
ALL AML
ALL 27 0
AML 0 11
Table 3 Explicates that out of 38 instances 27 instances are classified to be ALL cancer and 11 instances are classified into AML cancer. Since, the experiment proves that algorithm works well even with high dimensional dataset. Here precision and recall are therefore based on an understanding and measure of relevance.
Figure 2. Bar chart for Leukemia cancer dataset using Naïve Bayes algorithm 0
0.5 1
TP RATE FP RATE PRECISION RECALL F MEASURE 0.979 0.047 0.918 0.953 0.936 0 0.2 0.4 0.6 0.8 1
TP RATE FP RATE PRECISION RECALL F MEASURE 1
0
5.3Comparative Analysis of Naïve Bayes and SVM
5.3.1 Breast Cancer
The quality of the classification is measured using two quality measures such as precision and recall have calculated. The precision for a class is the number of true positives divided by the total number of elements labeled as belonging to the positive class.
The precision score 1.0 means that every outcome retrieved by a search was relevant. The perfect recall score 1.0, specifies that every relevant documentwas retrieved by the search.
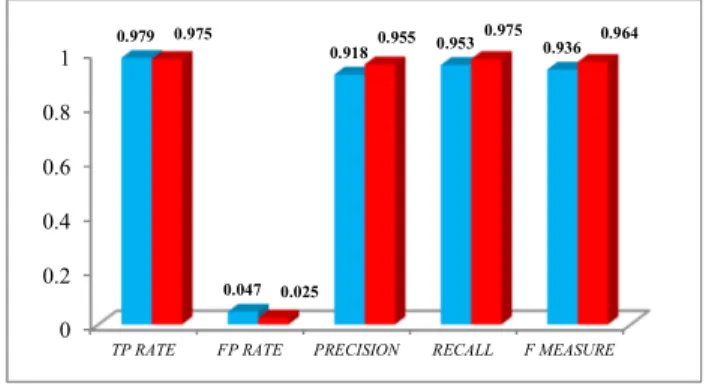
Table 4. Quality Measure of Naïve Bayes Algorithm over Breast Cancer
QualOty Measure Naïve Bayes SVM
TP RATE 0.979 0.975
FP RATE 0.047 0.025
PRECISION 0.918 0.955
RECALL 0.953 0.975
F MEASURE 0.936 0.964
Table 4 describe the precision and recall values of the Naïve Bayes and SVM classification algorithms over breast cancer dataset. It is being witnessed that the precision and recall values of SVM is higher than Naïve Bayes algorithm.
Figure3. Performance of Naïve Bayes and SVM (Breast Cancer)
The visualization of the comparative analysis on the performance of algorithms over breast cancer dataset is shown in Figure 3. The bar displayed in red represents Naïve Bayes and the bar that displayed in aqua represents SVM. 5.3.2 Leukemia Cancer Dataset
The experiment is extended to compare the performance analysis of Naïve Bayes and SVM classification algorithms with yet another leukemia cancer dataset for verifying the consistency of the qualitative performance of both the algorithms.
Table 5. Quality Measure of Naïve Bayes Algorithm over Leukemia Cancer QualOty Measure Naïve Bayes SVM
TP RATE 1 1
FP RATE 0 0
PRECISION 1 1
RECALL 1 1
F MEASURE 1 1
Table5 explicate the quality measures of the naïve Bayes and SVM algorithm with respect to Leukemia cancer dataset describes the precision and recall values of the Naïve Bayes and SVM classification algorithms over breast cancer dataset. It is being witnessed that the precision and recall values of SVM is higher than Naïve Bayes algorithm. 0 0.2 0.4 0.6 0.8 1
TP RATE FP RATE PRECISION RECALL F MEASURE
0.979 0.047 0.918 0.953 0.936 0.975 0.025 0.955 0.975 0.964
Figure 4. Performance of Naïve Bayes and SVM (Leukemia Cancer)
The graphical visualization of the comparative analysis on the performance of Naïve Bayes and SVM algorithms over Leukemia cancer dataset is shown in Figure 4. The bar that is displayed in red represents Naïve Bayes algorithm and the bar that displayed in aqua represents SVM algorithm.
5.4 Time Complexity
Time complexity of an algorithm quantifies the amount of time taken by an algorithm to run as a function of the length of the string representing the input. The time complexity of an algorithm is commonly expressed using big O notation, which excludes coefficients and lower order terms. When expressed this way, the time complexity is said to be described asymptotically, i.e., as the input size goes to infinity.
Time complexity is commonly estimated by counting the number of elementary operations performed by the algorithm, where an elementary operation takes a fixed amount of time to perform. Thus the amount of time taken and the number of elementary operations performed by the algorithm differ by at most a constant factor.
5.4.1 Complexity Between NB And SVM
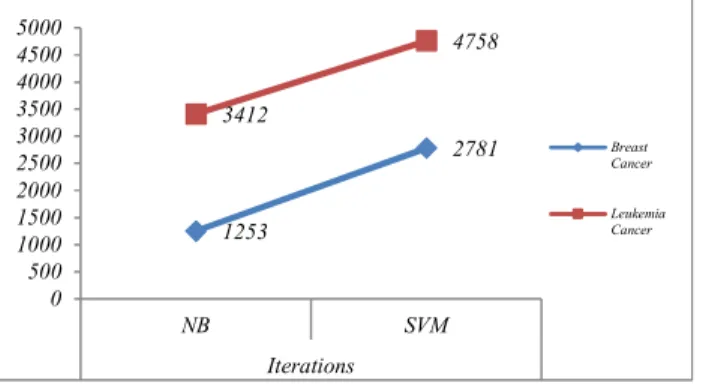
The analysis of quality measure, an attempt is directly made to compare the time complexity of a Naïve Bayes with the SVM algorithm. Trials of about five and cross-validation of about two fold in both algorithms were executed. This procedure allowed to run statistical significant tests between the time differences in the Naïve Bayes and SVM performances. Table 6 depicts the number of iterations and time complexity of both algorithms.
Table 6. Comparative Analysis of Time Complexity and Iterations of NB Vs. SVM
S. No Dataset IteratOons TOme taken to buOld model
NB SVM NB SVM
1 Breast Cancer 1253 2781 0.7169 0.8570
2 LeukemOa
Cancer 3412 4758 0.8375 0.9576
As in the table 6, not only the Naïve Bayes run faster than the SVM, but for the two datasets the number of iterations also equal or lesser. It is clear that the Naïve Bayes executes faster than SVM and even more importantly, that this difference increases with the dataset size.
0 0.1 0.2 0.3 0.4 0.5 0.6 0.7 0.8 0.9 1
TP RATE FP RATE PRECISION RECALL F MEASURE
1 0 1 1 1 1 0 1 1 1
Figure5. Time Complexity naïve Bayes vs. SVM
Moreover, these two algorithms not only differ in the execution time, but also there is a significant variance in the number of iterations that have been taken by the algorithms for taking decision.
Figure 6. Iteration Complexity Naïve Bayes vs. SVM
Fig. 5.6. represents the iteration complexity of NB and SVM. Naïve Bayes takes lesser iterations than SVM for both datasets.
6. Conclusion
The ability of Naïve Bayes and SVM classifiers are compared in terms of accuracy over classifying two different sets. The best results are achieved using Naïve Bayes classifier and SVM. The evaluation of the experiments on Naïve Bayes classifier, resulted with the improvement of 96% for breast cancer and 100% for leukemia cancer. After evaluating same experiments on SVM, produces the result of about 97% for breast cancer and 100% for leukemia cancer.
In future this can be done with traditional algorithms like K- Nearest Neighbor, IBK, and Decision trees etc. In-depth analysis and comparison can be holding on the diverse datasets and text classification techniques.
References
[1] Gopala Krishna Murthy Nookala, Bharath Kumar Pottumuthu, NagarajuOrsu, Suresh B. Mudunuri, “Performance Analysis and Evaluation of Different Data Mining Algorithms used for Cancer Classification”, IJARAI, Vol. 2, No.5, 2013.
[2] A.Priyanga Andrea,S.Prakasam “The Role of Data Mining-Based Cancer Prediction System in Cancer Awareness” International Journal of Computer Science and Engineering Communications- IJCSEC. Vol.1 Issue.1, December 2013. 0.7169 0.857 0.8375 0.9576 0 0.2 0.4 0.6 0.8 1 1.2 NB SVM Breast Cancer Leukemia Cancer 1253 2781 3412 4758 0 500 1000 1500 2000 2500 3000 3500 4000 4500 5000 NB SVM Iterations Breast Cancer Leukemia Cancer
[3] J.S.Saleema, N.Bhagawathi, S.Monica, P.DeepaShenoy, K.R.Venugopal .M.Patnaik,” Cancer Prognosis Prediction using Balanced Stratified Sampling”,IJSCAI, Vol.3, No. 1, February 2014.
[4] ShwetaKharya, “Using Data Mining Techniques for Diagnosis and Prognosis of Cancer Disease”, IJCSEIT, Vol.2, No.2, April 2012.
[5] K. Senthamarai Kannan, N. Senthilvel Murugan, V. Vallinayagam, T. Viveka, “Analysis of Liver Cancer DNA Sequence Data using Data Mining”, International Journal of Computer Applications, 0975 – 8887, Vol. 61- No.3, Jan 2013.
[6] V. Krishnaiah, G.Narsimha, N. Subhash Chandra, “Diagnosis of Lung Cancer Prediction System Using Data Mining Classification Techniques”, IJCSIT, Vol. 4 (1), 2013, 39 – 45.
[7] Ada, Rajneet Kaur, “A Study of Detection of Lung Cancer Using Data Mining Classification Techniques”,International Journal of Advanced Research in Computer Science and Software Engineering, Mar 2013, pp. 131-134.
[8] DursunDelen, Glenn Walker, Amit, Kadam, “Predicting breast cancer survivability: a comparison of three data mining methods”, Department of Management Science and Information Systems, Oklahoma State University, 700 North Greenwood Venue, Tulsa, Jan 2004.
[9] Thangaraju P, Barkavi G, Karthikeyan T, “Mining Lung Cancer Data for Smokers and Non-Smokers by Using Data Mining Techniques”, International Journal of Advanced Research in Computer and Communication Engineering Vol. 3, 7, Jul 2014.
[10] Kaishi Li, Meixue Yang, Gaurav Sablok, Jianping Fan, Fengfeng Zhou, “Screening features to improve the class prediction of acute myeloid leukemia and myelodysplastic syndrome”, ELSEVIER, 348–354, 2013. [11] Gopala Krishna Murthy Nookala, Bharath Kumar Pottumuthu, NagarajuOrsu, Suresh B. Mudunuri, “Performance Analysis and Evaluation of Different Data Mining Algorithms used for Cancer Classification”, International Journal of Advanced Research in Artificial Intelligence, Vol. 2, No.5, 2013.
[12] Xiangchun Xiong, Yangon Kim, Yuncheol Baek, Dae Wong Rhee, Soo-Hong Kim, “Analysis of Breast Cancer Using Data Mining & Statistical Techniques”, IEEE, 0-7695-2294-7/05, 2005.
[13] Chun-Hui Wu, Kwoting Fang, Ta-Cheng Chen, “Applying data mining for prostate cancer”, IEEE, 978-0-7695-3687-3/09, 2009.
[14] A. SoltaniSarvestani, A. A. Safavi, N.M. Parandeh, M.Salehi, “Predicting Breast Cancer Survivability Using Data Mining Techniques”, IEEE, 978-1-4244-8666-3, 2010
[15] Yao Liu, Yuk Ying Chung, “Mining Cancer data with Discrete Particle Swarm Optimization and Rule Pruning”, IEEE, -1- 61284-704-7s, 2011.
[16] Nashat Mansour, RoubaZantout, Mirvat El-Sibai, “Mining Breast Cancer Genetic Data”, IEEE, 978-1-4673-4714-3, 2013.
[17] R. Agrawal, R. Shrikant, “Fast algorithms for mining association rules”, Proc. 20th Int’l. Conf. Very Large Databases, pp. 487-499, 1994.
[18] Tobyho, "Data Mining and KDD", Mar 15, 2008.
[19] Antonio R. Anaya, Jesús G. Boticario “A Data Mining Approach to Reveal Representative Collaboration Indicators in Open Collaboration Frameworks”, Educational Data Mining, 2009.
[20] B.P.B Editorial Board, Typical Data Mining process for Predictive Modeling, BPB publication, New Delhi. [21] Weiss, Kulikowski, C., Computer Systems That Learn: Classification and Prediction Methods from Statistics, Neural Networks, Machine Learning, and Expert Systems. San Francisco, 1991.
[22] Jain, A. K., Dubes, R. C., Algorithms for Clustering Data. Englewood Cliffs, N.J.: Prentice-Hall.
[23] Moore GW, Berman JJ. “Anatomic pathology data mining”. In: Cios KJ, editor. Medical data mining and knowledge discovery, Heidelberg: Springer, p. 61–108, 2008.
[24] Cios K J, Medical data mining and knowledge discovery. Heidelberg: Springer, 2001.
[25] Moore G W, Hutchins G M, “Effort and demand logic in medical decision making”,Meta medicine, 1980, 1:277–304.