GCTW Alignment for Isolated Gesture Recognition
Leonardo Braulio Guzman Zenteno
Advisor: Ph.D. Guillermo C´amara Ch´avez
Committee Members:
Ph.D. Andrea Bianchi – Universidade Federal de Ouro Preto - Brasil. Ph.D. David Menotti – Universidade Federal do Paran´a - Brasil. Ph.D. William Schwartz – Universidade Federal de Minas Gerais - Brasil.
Ph.D. Jos´e Ochoa Luna – Universidad Cat´olica San Pablo - Per´u.
Thesis submitted to the Department of Computer Science
in partial fulfillment of the requirements for the degree of Master in Computer Science.
Universidad Cat´olica San Pablo – UCSP October 2018 – Arequipa – Per´u
To my parents, Loyola and Nestor, for constantly encouraging and supporting me. To my brothers for being there for me all the time and making me laugh.
Abbreviations
SL Sign Language
SLR Sign Language Recognition ASL American Sign Language MS Manual Signs
NMS Non-manual Signs HMM Hidden Markov Model
CNN Convolutional Neural Network
GCTW Generalized Canonical Time Warping
Acknowledgments
First and foremost, I want to thank God for having guided me throughout these two years of study. I would like to express my gratitude and appreciation to my advisor Ph.D. Guillermo C´amara Chavez for giving me his guidance and support throughout the master program, for the time dedicated to discuss my doubts and advances, and his patience during the preparation of this thesis. I also want to thank my family, for their constant support and encouragement during these years of study.
I would like to thank in a special way to the National Council for Science, Technol-ogy and Technological Innovation (CONCYTEC-PERU) and to the National Fund for Scientific Development, Technological and Technological Innovation (FONDECYT-CIENCIACTIVA), which through the Management Agreement 234-2015-FONDECYT have allowed the grant and financing of my studies in the Master Program in Computer Science at Universidad Cat´olica San Pablo (UCSP).
Abstract
In recent years, there has been increasing interest in developing automatic Sign Language Recognition (SLR) systems because Sign Language (SL) is the main mode of communication between deaf people all over the world. However, most people outside the deaf community do not understand SL, generating a communication problem, between both communities. Recog-nizing signs is a challenging problem because manual signing (not taking into account facial gestures) has four components that have to be recog-nized, namely, handshape, movement, location and palm orientation. Even though the appearance and meaning of basic signs are well-defined in sign language dictionaries, in practice, many variations arise due to different fac-tors like gender, age, education or regional, social and ethnic facfac-tors which can lead to significant variations making hard to develop a robust SL recog-nition system. This project attempts to introduce the alignment of videos into isolated SLR, given that this approach has not been studied deeply, even though it presents a great potential for correctly recognize isolated gestures. We also aim for a user-independent recognition, which means that the system should give have a good recognition accuracy for the sign-ers that were not represented in the data set. The main features used for the alignment are the wrists coordinates that we extracted from the videos by using OpenPose. These features will be aligned by using Generalized Canonical Time Warping. The resultant videos will be classified by making use of a 3D CNN. Our experimental results show that the proposed method has obtained a 65.02% accuracy, which places us 5th in the 2017 Chalearn LAP isolated gesture recognition challenge, only 2.69% away from the first place.
Keywords: Artificial Intelligence, Video Processing, Alignment of Multiple Sequences.
Figure 1: Pipeline of our proposed model.
Resumen
En los ´ultimos a˜nos, ha aumentado el inter´es en desarrollar sistemas au-tom´aticos de reconocimiento de lenguaje de se˜nas (SLR), porque el lenguage de se˜nas es el principal modo de comunicaci´on entre las personas sordas de todo el mundo. Sin embargo, la mayor´ıa de las personas ajenas a esta comu-nidad no entienden el lenguage de se˜nas, lo que genera un problema de co-municaci´on entre ambas comunidades. Reconocer las se˜nas es un problema desafiante porque los gestos manuales (sin tener en cuenta los gestos faciales) tienen cuatro componentes que deben reconocerse, a saber, la forma de la mano, el movimiento, la ubicaci´on y la orientaci´on de la palma. Aunque la apariencia y el significado de los signos b´asicos est´an bien definidos en el lenguaje de se˜nas, en la pr´actica surgen muchas variaciones debido a difer-entes factores como el g´enero, la edad, la educaci´on o factores regionales, sociales y ´etnicos que provocan variaciones importantes que dificultan el desarrollo de un sistema robusto de reconocimiento de lenguage de se˜nas. Este proyecto intenta introducir la alineaci´on de videos en el reconocimiento de lenguage de se˜nas aisladas, dado que este enfoque no se ha estudiado a fondo, a pesar de que presenta un gran potencial para el reconocimiento correcto de gestos aislados. Las principales caracter´ısticas utilizadas para la alineaci´on son las coordenadas de las mu˜necas que extrajimos de los videos mediante el uso de OpenPose. Estas caracter´ısticas se alinear´an usando Generalized Canonical Time Warping. Los videos resultantes se clasificar´an haciendo uso de una CNN 3D. Tambi´en apuntamos a un reconocimiento independiente del usuario, lo que significa que el sistema deber´ıa tener una buena precisi´on para los firmantes que no estan representados en el conjunto de datos de entrenamiento.
Palabras clave: Inteligencia artificial, Procesamiento de Videos, Alineamiento de multiples sequencias.
Contents
List of Tables XV
List of Figures XVIII
1 Introduction 1
1.1 Motivation and Context . . . 4
1.2 Research Statement . . . 4 1.3 General Objective . . . 4 1.3.1 Specific Objectives . . . 5 1.4 Thesis Organization. . . 5 2 Literature Review 7 2.1 Sensor-Based Systems . . . 7 2.2 Vision-Based Systems. . . 9 2.2.1 Alphabet Recognition . . . 9
2.2.2 Isolated Sign Recognition . . . 9
2.2.3 Continuous Sign Language Recognition . . . 11
3 Theorical Foundations 15 3.1 Convolutional Neural Networks . . . 15
3.1.1 C3D model . . . 15
3.2 Generalized Canonical Time Warping . . . 17 XIII
CONTENTS
3.3 OpenPose . . . 18
4 Proposal 21 4.1 Silent Frames Extraction . . . 21
4.2 Alignment . . . 23
4.3 Normalization and Masking . . . 24
4.4 Classification . . . 25
5 Experiments 27 5.1 ChaLearn Isolated Gesture Dataset (IsoGD) . . . 27
5.2 Experiments with a subset of IsoGD . . . 28
5.2.1 Experiments with the proposed model . . . 28
5.2.2 Other sampling methods used . . . 29
5.3 Experiments on complete IsoGD . . . 30
5.3.1 Fusion results on IsoGD . . . 31
5.3.2 Comparison on IsoGD . . . 31
6 Conclusions and Future Work 33 6.1 Limitations . . . 34
6.2 Future Work . . . 34
Bibliography 43
List of Tables
5.1 Results of C3D model over 4 different types of data on a subset of IsoGD. 29 5.2 Results of multiple sample methods tested on the subset of the IsoGD. 30
5.3 Results of C3D model with the complete IsoGD. Intensity data. . . 31
5.4 Results of C3D model with the complete IsoGD. Depth data. . . 31
5.5 Results of fusion methods of depth and RGB results. . . 32
5.6 Results of fusion methods of depth and RGB results. . . 32
LIST OF TABLES
List of Figures
1 Pipeline of our proposed model. . . X
1.1 American Sign Language. . . 2 1.2 The 27 frames that occurred in a specific demonstration form of the sign
CHICAGO. . . 3 1.3 The final frame of GO, two transitional frames, and the first frame of
CHICAGO as they were produced in a sentene that translates ‘I go to Chicago.’. . . 3
3.1 96 convolutional kernels of size 11×11×3 learned by the first convolu-tional layer (Krizhevsky et al., 2012) . . . 16 3.2 C3D Architecture. C3D net has 8 convolution, 5 max-pooling, and 2
fully connected layers, followed by a softmax output layer. The number on each convolutional network is the number of filters it has. Image taken from Tran et al. (2015) . . . 16 3.3 Prediction on Sports-1M test data. Blue (first row) indicates ground
truth label and the bars below show model predictions sorted in de-creased confidence. Greed and red distinguish correct and incorrect pre-dictions, respectively.(Tran et al.,2015) . . . 17 3.4 Comparison of temporal alignment algorithms for aligning multi-feature
video data. (a) An example of two video sequences aligned by GCTW. The top two sequences are the key-frames after background subtraction, while the bottom two are the binary images and the Euclidean distance transforms. (e) An example of three aligned videos by GCTW. The top three sequences are the original frames after background subtraction, while the bottom three are the binary images, the Euclidean distance transforms and the solutions of the Poisson equation. (b)(f) The align-ment results. (c)(g) Comparison of time warping paths. (d)(h) Mean and variance of the alignment errors. . Image taken from Zhou and De la Torre (2016) . . . 18
LIST OF FIGURES 3.5 Example of multi-person body-foot estimation using OpenPose. . . 19 3.6 OpenPose Output format for the 25 key-points in the body. . . 19
4.1 Proposed Model. The silent frame extraction removes frames with no relevant information, GCTW is in charge of aligning similar frames inside each class, after that we mask everything but the hands and finally use the C3D model for RGB and depth information. . . 22 4.2 Removal of silent frames. This specific case are the images from the
sign M 00128 from the train set of the IsoGD. It has 88 frames, from which only 14 represent the sign, and the other 74 are frames where the signer is in a resting position. . . 22 4.3 Two different videos of the same sign before alignment with GCTW. . 23 4.4 Frames selected after being aligned with GCTW. . . 23 4.5 A comparison between a normal and a hand masked image. In the hand
masked image, there are 2 squares representing the left and right wrists obtained with OpenPose. . . 25
Chapter 1
Introduction
Sign languages are the main form of communication used by the deaf-mute community all around the world, which employs signs made by moving the hands combined with facial expressions and body postures. These movements take place in a three dimen-sional space close to the signer’s trunk and head called signing space. The gestures that are made with the hands are known as Manual Signs (MS) which involves tak-ing into account four main characteristics, namely, hand shape, hand movement, hand location and palm orientation (Johnson and Liddell, 2011). While the facial expres-sions, head and body postures, gaze and mouth movements are known asNon-manual Signs (NMS).
Taking into account all of these features, Sign Language (SL) is considered a complex language completely separate and distinct from the spoken language. It has all the fundamentals characteristics of language like their own rules for pronunciation, word order and grammar. Besides those characteristics,SLis highly dynamic due to its linguistic variations like dialects, co-articulation, signing style and signers’ appearance. Similarly, the same signer might use variants of a sign to convey the same meaning depending on different contexts. In some cases, not all concepts can be described as a sign. In such cases, the sign often describes something related to the concept instead. Signs can also be compounded, like words are in spoken language, and all these possibilities greatly increase the complexity ofSL.
As complex as it is there is no direct correspondence between SL and written language. Unlike hearing people who can learn and perceive written language as a visual representation of spoken language where letters encode phonemes. For deaf people, this correspondence does not exist thus letters are just seen as symbols without any meaning Von Agris et al. (2008).
In addition, SL is spread all over the world but it is not universal. Different national sign languages have been allowed to evolve, while being used in well-established signing communities. Furthermore, there are sometimes that spoken language intrudes into theSLvia systems such as finger spelling. And just like in spoken language there are regional dialects because there is no standard for signs which leads to people using
altogether different signs for the same word (Schlesinger and Namir, 2014).
The process of identification of sign language is known asSign Language Recogni-tion (SLR), in which there are two main types of recognition, StaticSLRand Dynamic SLR.
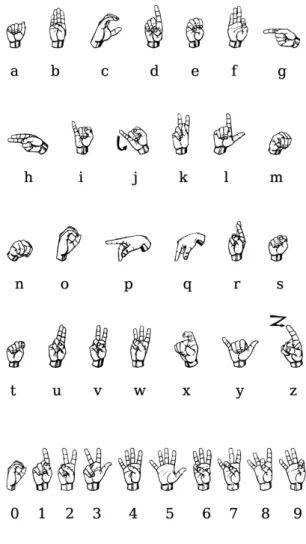
The StaticSLR focuses only on images such as the ones in Fig. 1.1. In this case the shape of the hand represents a specific letter and number of the American Sign Language American Sign Language (ASL).
Figure 1.1: American Sign Language. Image taken from LifePrint(2018)
On the contrary, Dynamic SLRuses videos, being the information of the videos intensity and/or depth. In this case, there are two more sub-divisions of dynamicSLR. Isolated SLR and ContinuousSLR.
In IsolatedSL, the main focus is on recognizing single signs which normally rep-resent one concept or word. In Fig. 1.2, we can see a representation of the sign CHICAGO from the ASL. This is considered an isolated sign given that it only repre-sents one word, and also because the signer starts with a resting posture and ends the 2 Master Program in Computer Science - UCSP
CHAPTER 1. Introduction
video with the same posture. Also,as we can see, the shape of the hand is sometimes blurry, adding some difficulty at the moment of recognizing the shape of the hand.
Figure 1.2: The 27 frames that occurred in a specific demonstration form of the sign CHICAGO.
Image taken from Johnson and Liddell (2011)
In Continuous SL, the focus is on recognizing multiple signs inside multiple phrases. The main challenge in this topic is to learn how to recognize the movement epenthesis. Movement epenthesis is the gesture movement that bridges two consecutive signs, in written language it would be like the blank spaces between consecutive words. In Fig. 1.3, we can see the transition gesture between the signsGO and CHICAGO.
Figure 1.3: The final frame of GO, two transitional frames, and the first frame of CHICAGO as they were produced in a sentene that translates ‘I go to Chicago.’
Image taken from Johnson and Liddell (2011)
1.1. Motivation and Context
1.1
Motivation and Context
SLR has been studied for about 20 years until now and it is still a problem that has not been completely solved yet because of its complexity and dynamicity. This is a significative problem since in Peru there are at least 560 thousand people with some hearing impariment (CONADIS, 2016). In the US, the amount of people who has some type of hearing impairment (38 million) is more than the total population of Peru (Hamrick et al., 2010). And worldwide, the World Health Organization Organization
(2017) estimates that around 360 million people have disabling hearing loss and 32 million of those are children.
There are multiple causes of hearing loss and deafness and such can be divided into congenital and acquired causes. The congenital causes may lead to hearing loss being present at or acquired soon after birth. This can be caused by hereditary and non-hereditary genetic factors or by certain complications during pregnancy and childbirth. The acquired causes may lead to hearing loss at any age, such as: infectious diseases, ear infections, injuries, excessive noise, etc. Therefore, if a kid has any kind of hearing impairment, it is of great significance to detect it as soon as possible given that if not, the kid will not be able to take advantage of the best years of his life to develop the skills needed for an efficient communication.
1.2
Research Statement
Automatic Sign Language Recognition is a vast and relatively new field of research which requires high levels of expertise in different areas. The existing research shows that there are many shortcomings and challenges on the area of SLR. These problems are not associated with a particular classification technique but rather on some other general problems like the segmentation, size of dictionary, unrestricted environment, variety of gestures, start and end points of gestures, variance of the same gestures signed by different people. Besides the fact that each country has its own SL, so there is a need for a fast and effective way to create a database for eachSLall over the world.
1.3
General Objective
Develop a simple method that can effectively recognize Isolated Sign Language. Our main focus is alignment, by making use of wrist coordinates we will improve the per-formance of 3D CNNs by correctly aligning the frames of each video in a dataset. 4 Master Program in Computer Science - UCSP
CHAPTER 1. Introduction
1.3.1
Specific Objectives
1. Develop a method that can take advantage of both intensity and depth informa-tion of the videos.
2. Explore which features are the most useful to do a correct alignment of videos.
1.4
Thesis Organization
The rest of the thesis is structured as below,
Chapter 2. In this chapter, we present an investigation of the most relevant methods inSLR. And is divided in Alphabet Recognition, Isolated Gesture Recognition and Continuous Sign Language Recognition.
Chapter 3. This chapter presents all the needed theory to understand the method that will be proposed in the next section.
Chapter 4. This chapter details the methods that are being proposed.
Chapter 5. In this chapter, we make a brief explanation about the dataset used. We also show the results of the multiples experiments done on the dataset previosly mentioned.
Chapter 6. Conclusions
1.4. Thesis Organization
Chapter 2
Literature Review
There have been multiple studies in recent years about SLR (Cooper et al., 2011;
Melnyk et al., 2014; Kausar and Javed, 2011), where SLR is divided into two main parts, image-based and sensor-based approaches. And each of these approaches can be divided into three domains:
• Static Gesture Recognitionconsists on only recognizing the shape of the hand which usually can represent a letter of the alphabet.
• Isolated Gesture Recognition is about recognizing words or specific phrases. • Continuous Gesture Recognitionis recognizing words and movement
epenthe-sis (blank spaces between words).
2.1
Sensor-Based Systems
This type of systems uses hardware such as data gloves and accelerometers to acquire specific features of a sign. In the beginning, the initiative for this trend was that the processing power for real time vision based methods was very high. Also, it was and is still very difficult to extract some features like the orientation of the hand relying only on visual data.
In his patent,Grimes(1983) proposed the idea of a glove with sensors to be used to detect the flex of finger joints and the contact between different portions of the hand, as well as, the twisting and flexing of the wrist. Besides some additional sensors to detect the movement of the hand with respect to a gravitional vector and a horizontal plane of reference. After that, Hall(1985) described a experimental system to recognize finger postures with a LED glove, being the pioneer for using hand gestures forSLR. Kadous et al.(1996) used instance-based learning and decision tree methods on Australian SL data collected by a PowerGlove. The user dependent system recognizes 95 signs.
2.1. Sensor-Based Systems
Starner and Pentland (1997) described a real time Hidden Markov Model based system for recognizing American SL sentences using solidly colored gloves. Brashear et al. (2003) proposed a mobile assistive technology for American SLR. They used multiple sensors that consisted on a hat mounted camera, wearable computer, and accelerometers. They also marked each hand with a different wrist band color for an easier hand localization. Hernandez-Rebollar et al. (2002) used AcceleGlove for recognizing the 26 hand shapes of the AmericanSLalphabet. It was different from other approaches because it did not require a tracking system to identify hand orientation.
Mehdi and Khan (2002) investigated the possibility of recognizingSL gestures using a sensor glove, made out of cloth with sensors fitted on it. A total of 7 sensors were used, 5 for the fingers, one for measuring the tilt of the hand, and the last one for measuring the rotation of the hand. Their algorithm is based on an Artificial Neural Networks.
Gao et al. (2004) proposed a temporal clustering algorithm to cluster a large amount of transition movements, and then the corresponding training algorithm is also presented for automatically segmenting and training these transition movement models. The clustered models improve the generalization of transition movement models, and are very suitable for large vocabulary of continuous SLR. They used two Cybergloves and three Pohelmus 3SPACE-position trackers as input devices. The trackers were for each wrist and one fixed at the signer’s back. Kuroda et al. (2004) presented an intelligent data glove called StrinGlove. StrinGlove determines full degrees of freedom of a human hand using 24 inductcoders and 9 contact sensors. Then, it encodes hand postures into posture codes on its hardware decreasing the load on the central CPU.
Hernandez-Rebollar et al. (2004) discussed an approach for capturing and translating isolated signs using a system composed of an AcceleGlove and a two-link arm skeleton. Their classification method was based on Hidden Markov Models and Artificial Neural Networks.
In more recent studies using devices with more advanced technologies. Oz and Leu (2011) used a sensory glove called CyberGlove and 3D motion tracker to extract hand features. The finger joint angles define the hand shape, and the data from the tracker is used to estimate the trajectory of the hand. Assaleh et al.(2012) proposed a low complexity classification method to recognize Arabic SL. The gloves have 5 bend sensors and a 3D accelerometer. Luzanin and Plancak (2014) used a low-budget 5-sensor data glove. Their probabilistic neural network-based gesture recognition method is able to process simple and complex static gestures. Bhaskaran et al.(2016) presented a glove embedded with flex sensors and an Inertial Measurement Unit to recognize the gesture. Their method is based on State Estimation which tracks the motion of the hand in three dimensional spaces. It is also able to convert Indian SLto voice output. Even though these approaches can easily give almost exact coordinates and fea-tures the fact that the user has to wear this devices makes the communication not natural and also the high cost of the hardware makes the trend in favor of image and video based systems.
CHAPTER 2. Literature Review
2.2
Vision-Based Systems
Visions based systems use appearance-based image features from images and video sequence frames.
2.2.1
Alphabet Recognition
This branch is focused on recognizing explicitly the shape of the hand. Given that these are static images the best approach to recognize the different shapes of the hand is Convolutional Neural Network (CNN), at least when there is enough data for the CNN.
Feris et al. (2005) proposed a novel method for recognition of isolated finger-spelling gestures based on depth edge features. Their approach is based on a simple and inexpensive modification of the capture setup. They use a multi-flash camera with flashes strategically positioned to cast shadows along depth discontinuities in the scene, allowing efficient and accurate extraction of depth edges. The proposed method em-ploys a shift and scale invariant shape descriptor for fingerspelling recognition. They observe an improvement over methods relying on features acquired by traditional edge detection and segmentation algorithms. Rioux-Maldague and Giguere (2014) devel-oped a new feature extraction technique for hand pose recognition using depth and intensity images. Their classification used a Deep Belief Network for which their fea-ture extraction technique is tailored. The input for deep belief network were successive binary depth images which represent different depths in the image of the hand. Kang et al. (2015) presented a method for fingerspelling recognition using CNN from depth maps. Also making use of hyper-parameter selection. Ameen and Vadera (2017) de-veloped a CNN aimed at classifying fingerspelling images using both image intensity and depth data. Their network fused the output of the convolutional layers both the intensity and depth information and classify it with a feed forward neural network.
2.2.2
Isolated Sign Recognition
Assan and Grobel (1997) focused on the video-based signer dependent recognition of isolated signs. They use the manual parameters of sign language. They consider a sign as a doubly stochastic process to define Hidden Markov Models. The observations extracted from video frames are regarded as feature vectors. Akyol and Alvarado(2001) presented a recognition system for the mobile use. They extract and combine motion cues and skin color features from single-view image sequences. Their method uses Bayes’ classification to generate a probability map based on the skin color. They also used motion history to generate a similar motion probability map. Combining both maps they detect signers’ hands and classify the gestures.
2.2. Vision-Based Systems
Zhang et al.(2004) presented a recognition system composed of two sub-modules. They combined techniques of robust hands detection, background subtraction and pupils detection to precisely extract feature data with the aid of colored gloves in an unconstrained environment. Their method employ Principal Component Analysis to characterize the finger features. Then, a Tied-Mixture Density Hidden Markov Model is used to speed up the recognition without significant loss of recognition accuracy.
Zieren and Kraiss (2005) developed a system that uses a background model to remove static areas from the input video on pixel level. They used Hidden Markov Models along with features normalized for person-independence and robustness.
Haberdar and Albayrak (2006) proposed a series of recognition systems using initially global and then local features extracted from videos showing signs in Turk-ish SL. Their method is a two-step algorithm, they first classify the signs based on the movement of the hands. Then, the shape of the hands is used to recognize the sign in the initially selected subset. Their system can recognize 172 isolated signs.
Zafrulla et al.(2010) proposed a relatively novel approach for American Sign Language phrase verification by combining confidence measures obtained from aligned forward sign models and reversed sign models to the same input. They use the Normalized likelihood score and the Log-Likelihood Ratio in the proposed model. Interestingly, they perform leave-one-signer-out cross validation on a dataset of 420 American Sign Language phrases obtained from five deaf children playing an educational game called CopyCat.
Kishore and Kumar (2012) developed a method to segment gestures of Indian SL. Their algorithm extracts signs from video sequences under dynamic backgrounds. The signs are segmented by minimizing the energy function of the level set fused by various image features such as color, texture, boundary and shape information. From RGB color video, three color planes are extracted, and one color plane is used based on the contrasting environments presented by the video background. Texture edge map provides spatial information which makes the color features more distinctive for video segmentation. Their experiments show that the method provides segmentation for user independent signer under different imaging conditions. Fagiani et al. (2013) proposed a system for Italian SLR. Their system is composed of a feature extraction stage, and a sign recognition stage. Sequential forward selection method was used to obtain feature vectors with the minimum dimension and the best recognition performance. They represent each sign with a single Hidden Markov Model having parameters estimated through the re-substitution method. They obtained a recognition accuracy of 47.24% on the Italian SLDatabase A3LIS-147.
Zhu et al.(2016) used a pyramid input which consists of 4 parts. The first one is the whole signal and the other are 3 uniform segments of at least 16 frames. When there are less frames than 16*3, frames are duplicated or overlapped. They use 3D convNets on intensity and depth and do a late fusion. Before entering the softmax layer they do a pyramid fusion (reshape and pool) which ensures that all convNets points towards the same labels. Finally they obtained 50.93% accuracy in the 2016 ChaLearn LAP Large-scale Isolated Gesture Recognition Challenge. Wang et al. (2016) used only depth information. The depth data was transformed into Dynamic Depth Images (DDI) for 10 Master Program in Computer Science - UCSP
CHAPTER 2. Literature Review
posture information, Dynamic Depth Normal Images (DDNI) for posture and motion information, and Dynamic Depth Motion Normal Images (DDMNI) where Gaussian Mixture Models were used on the depth mostly for motion information. All were made by making use of the ranking pooling method in a bi-directional way. In total there are 6 CNNs based on pre-trained models on ILSVRC-2012 that were trained individually,then for each pair multiply-score fusion was used and finally the three normalized score vectors are then multiplied in an element-wise fashion and the max score in the resultant vector is assigned as the probability. They obtained 55.57% accuracy in the 2016 ChaLearn LAP Large-scale Isolated Gesture Recognition Challenge. Wang et al.(2018) later on presented another work using DDI, DDNI and DDMNI, that were constructed from a segmented sequence of depth maps using hierarchical bidirectional rank pooling to effectively capture the spatial-temporal information. They improved their results to 59.21% accuracy on the same dataset.
Li et al. (2016) first resizes all videos to 32 frames using a dynamic ratio. Then uses the C3D model (Tran et al., 2015), an architecture of 3D CNNs, that has been previously trained on the sports-1m dataset (Karpathy et al.,2014). They train a C3D for depth and intensity independently. Then integrate both vectors and classify it with an SVM, obtaining 56.9% accuracy in the 2016 ChaLearn LAP Large-scale Isolated Gesture Recognition Challenge. InWan et al.(2017) article we can also see the results of the second round for the ChaLearn LAP Large-scale Isolated Gesture Recognition Challenge. The first place(team ASU), first used a data enhancement strategy called retinex to unify the illumination of the videos. Also, optical flow information is used as another modality of data, which focus on gesture motions. After that, the C3D model and TSN are used for feature extraction.
2.2.3
Continuous Sign Language Recognition
Most of the vision based continuous SLR methods are based on or employs Hidden Markov Models (Eddy, 1996), while there are some exceptions.
Vogler and Metaxas (1997) used three-dimensional data of arm motions as in-put. These parameters are used as features for Hidden Markov Models to recognize 486 American SL sentences. They also modeled transient between signs yielding bet-ter recognition results. Lee and Kim (1999) introduced the concept of a Threshold Model for continuous gesture recognition that calculates the likelihood threshold of an input pattern and provides a confirmation mechanism for the provisionally matched gesture patterns. Bauer and Hienz (2000) described the development of a video-based continuous GermanSLR system based on Hidden Markov Models with one model for each sign. The goal of the proposed system is to design an automatic signer dependent recognition of sign language sentences, based on a lexicon of 97 signs.
Bauer et al. (2000) describes the development of a signer dependent video-based continuousSLRsystem using Hidden Markov Models. Their system is developed using a lexicon of 97 signs of German Sign Language and employs manual sign parameters. Master Program in Computer Science - UCSP 11
2.2. Vision-Based Systems They used a single color video camera to capture images. Wang et al.(2002) presented an approach to large vocabulary, continuous Chinese SLR using phonemes instead of whole signs as the basic units. There are about 2400 phonemes in Chinese Sign Language. Because the number of phonemes is limited, Hidden Markov Model based training and recognition of the Chinese SL signal has the potential of recognizing enlarged vocabularies. The proposed method can manage the finger-alphabet and gestures. They generate one Hidden Markov Model for each phoneme, and then the signs are encoded based on these phonemes. They used clustering of the Gaussians on the states, the language model, and N-best-pass to improve the performance of the system. They carried out experiments on a size of 5119 signs. Vogler and Metaxas
(2003) followed the Movement-Hold model to devise a breakdown of the signs into their constituent phonemes, which provide the fundamental building blocks for the Hidden Markov Model based system. To handle simultaneous events, they split up the signs into movement and handshape channels that are independent from one another and different for each hand. They validate their framework in experiments with a 22-sign vocabulary and up to three channels.
Nayak et al. (2005) proposed a continuous state space model, where the states are based on image-based features. They present an unsupervised approach to both extract and learn models for continuous basic units of signs from continuous sentences. Coarticulation effects are very strong in sign language. Given a set of sentences with a common sign, they can automatically learn the model for part of the sign which is affected by coarticulation effects. Their model is based on traces in a space of relational distributions, and each point in this space represents a relational distribution, capturing the spatial relationships between low-level features, such as edge points. They also perform speed normalization and then incrementally extract the common signs between sentences. Holden et al. (2005) presented an automatic Australian Sign Language recognition system that tracks the face and hands in videos. They perform the tracking using correspondences of simple geometrical features between the target objects within the current and the previous frames. The proposed system could deal with the occlusion of the face and a hand by detecting the contour of the foreground moving object using a combination of motion cues and the snake algorithm. They use Hidden Markov Models as the base model and conduct experiments using 163 test sign phrases with varying grammatical formations.
Fang et al. (2007) proposed a method for handle transition parts between two adjacent signs in large-vocabulary continuous sign language recognition. They develop a temporal clustering algorithm improved from k-means by using dynamic time warp-ing as its distance measure for tacklwarp-ing mass transition movements arisen from a large vocabulary size. Then, they present an iterative segmentation algorithm for auto-matically segmenting transition parts from continuous sentences. Dreuw et al. (2007) developed a system that is able to recognize sentences of continuous SL independent of the speaker. They employ pronunciation and language models in sign language. The recognition algorithm is based on the Bayes’ decision rule. The system was tested on a publicly available benchmark database consisting of 201 sentences and 3 signers.
Dreuw et al. (2009) investigated whether explicitly incorporating depth information could improve the recognition of American SL. The depth information was extracted 12 Master Program in Computer Science - UCSP
CHAPTER 2. Literature Review
using a stereo-vision method on sequential frames. They demonstrated that the depth information helped disambiguate overlapping hands and improve the tracking of the hands; however, the tracking improvements did not have much influence on the final recognition results. Kelly et al. (2009) presented a multi-modal system for the recog-nition of manual signs and non-manual signals in continuous SL sentences based on multichannel Hidden Markov Models. Manual signs and non-manual signals are han-dled independently using continuous multidimensional Hidden Markov Model threshold model. They use a single non-manual signal, head movement, to evaluate the proposed framework when recognizing non-manual signals.
Buehler et al.(2009) developed a system to automatically learn a large number of British Sign Language (BSL) signs from TV broadcasts. Their method proposed a dis-tance function to match signing sequences which included the trajectory of both hands, the hand shape and orientation. And also optimized a scoring function based on mul-tiple instance learning. Pfister et al.(2013) proposed a method for automatically learn a large number of signs from sign language-interpreted TV broadcasts. By exploiting supervisory information available in the subtitles of the broadcasts. They developed a multiple instance learning method using an efficient discriminative search, which de-termines a candidate list for the sign with both high recall and precision. Kong and Ranganath (2014) presented a recognition strategy based on a two-layer conditional random field (CRF) model, where the lower layer processes the component channels and provides outputs to the upper layer for sign recognition. The sub-segments are labeled SIGN or ME (movement epenthesis) by a Bayesian network (BN) which fuses the outputs of independent CRF and support vector machine (SVM) classifiers. The remaining SIGN sub-segments are merged and recognized by the two-layer CRF classi-fier; for this they proposed a new algorithm based on the semi-Markov CRF decoding scheme.
Zhang et al. (2014) proposed a threshold matrix and rate thresholds for a coarse segmentation and a fine segmentation based on Dynamic Time warping and Length-Root method for efficiently determine the end point of a sign candidate. The final recognition is obtained by concatenating the most possible signs in a Hidden Markov Model (HMM) based system. Yang (2014) applied a Hierarchical Conditional Ran-dom Field over depth information to recognize hand signs from the hand motions and then BoostMap embedding to verify the hand shapes of the segmented signs. Koller et al. (2015) presented one of the firsts work focused on real-life data. They tackled Signer-dependency with Constricted Maximum Likelihood Linear Regression (CMLLR) adaptation and further improved the recognition by employing class language models.
Pigou et al. (2014) created an architecture where they fused two CNNs. One of the CNNs receives the resized video(32 frames) as input, while the other one receives a cropped part of the video which focuses on the hand. And for spotting different ges-tures they use the sliding window technique, where each possible interval of 32 frames is evaluated by the trained model. They achieved a mean Jaccard Index of 0.789 in the ChaLearn 2014 Looking at People gesture spotting competition.
Neverova et al. (2014) proposed a highly complex model that consists of single-scale paths connected in a parallel way. Each path learns at its own temporal single-scale, in Master Program in Computer Science - UCSP 13
2.2. Vision-Based Systems this case, they extract five frames from a window of 9, 13 and 17 frames. Each path consists of 4 CNNs, two for the right hand(depth and intensity with late fusion), and the other two for the left hand. Plus a pose feature extractor which consists of joint positions, velocities, accelerations, inclination angles, azimuth angles, bending angles and pairwise distances of all normalized joint positions. Once they have the three out-puts (left hand, right hand and pose features) they do a fusion with a single weight per model, obtaining 85.0% in the ChaLearn 2014 Looking at People gesture spotting competition. Koller et al. (2016) exploited the generic annotation from HamNoSys to learn subunit classifiers of the hand orientation making use of CNN. All of this based on a Gaussian Mixture Model and a HMM system. Koller et al. presented an iterative re-alignment approach applicable to visual sequence labeling tasks such as ges-ture recognition, activity recognition and continuous sign language recognition. Their algorithm treats the provided training labels as weak labels and refines the label-to-image alignment on the-fly in a weakly supervised fashion. After that a deep recurrent CNN-BLSTM (Bi-directional long short term memory) network is trained end-to-end embedded into an HMM.
In summary, both systems sensor-based and vision-based have been progressing a lot through the years. While the sensor-based systems might be more precise because of the hardware used in them, we opt to work on a vision-based system because we think it would be more natural using only a camera and not devices for the hands. Our method makes use of RGB and Depth data, we first find the wrists joints by making use of OpenPose (a system that detects body, hand and facial points on single images). With those joints we proceed to select the most meaningful frames from each video. Then we align the clipped videos usingGeneralized Canonical Time Warping (GCTW) and finally we train two 3D convolutional networks and fuse its results. In the next chapter we will present all theorical foundations used in our method.
Chapter 3
Theorical Foundations
3.1
Convolutional Neural Networks
CNNs are very similar to ordinary Neural Networks, in the sense that, both are made up of neurons with learnable weights and biases. And a loss function (e.g. Softmax,SVM) on the last fully-connected layer. The main difference with Neural Networks is that, CNNs make the explicit assumption that the input are images, and thus, their prop-erties in the architecture make the forward function more efficient to implement and with reduced amount of parameters. The layers of a CNN have neurons arranged in 3 dimensions: width, height, depth. This way, neurons are connected to a small region of the layer before it. Between the most popular types of layers, we have convolutional, fully connected, RELU, and pool layers.
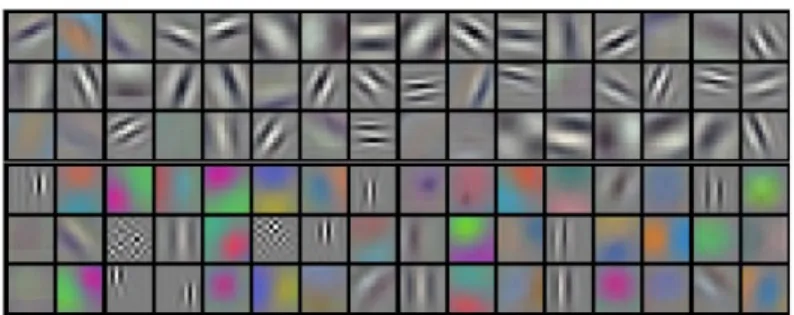
The convolutional layers are the ones that will do most of the computational heavy lifting. This layers’ parameters consist of a set of learnable filters, as seen in Fig 3.1. These filters are spatially small, but each filter slides across the width and height of the input volume, computing the dot product of their weights and the region they are connected to. The output of this computing will be 2-dimensional activation maps, that are the responses of the filters used. RELU layers apply an element wise activation function, leaving the size of the volume unchanged. Pool layers are in charge of downsampling the spatial dimensions such as height and weight. Finally, the Fully Connected layers are in charge of computing the class scores (class CS231n,2018).
3.1.1
C3D model
Tran et al.(2015) believe that 3D convNets are well suited for spatio-temporal feature learning. This ability to model temporal information is due to the 3D convolution and 3D pooling operations.
The C3D architecture is shown in Figure 3.2. All of 3D convolution filters are 15
3.1. Convolutional Neural Networks
Figure 3.1: 96 convolutional kernels of size 11×11×3 learned by the first convolutional layer (Krizhevsky et al.,2012)
3×3×3 with stride 1×1×1. All 3D pooling layers are 2×2×2 with stride 2×2×2 except for pool1 which has kernel size of 1×2×2 and stride 1×2×2. They trained the C3D model on Sports-1M dataset (Karpathy et al.,2014) which was the largest video classification benchmark at the time. They trained from scratch, using mini-batches of 30 clips, with a learning rate of 0.003. The learning rate is divided by 10 after 4 epochs. The training is stopped after 16 epochs.
They also used the deconvolution method explained by Zeiler and Fergus (2014) to properly understand what the C3D model is learning internally. They observed that the C3D, in the first frames it focuses on appearance. While in the subsequent frames it tracks the salient motion. Thus C3D excels standard 2D CNNs in that it can learn both motion and appearance.
Figure 3.2: C3D Architecture. C3D net has 8 convolution, 5 max-pooling, and 2 fully connected layers, followed by a softmax output layer. The number on each convolutional network is the number of filters it has. Image taken from Tran et al.
(2015)
They demonstrated with this work that, C3D features with a linear classifier can outperform or approach the current best methods on different video analysis bench-marks. Finally, the proposed C3D features are efficient, compact and extremely easy to use which makes it a good method to take advantage of.
The C3D model was trained on the Sports-1M dataset. This dataset consist of 1 million YouTube videos annotated with 487 classes. The classes are arranged in a manually-curated taxonomy that contains internal nodes such as Aquatic Sports, Team Sports, Winter Sports, Ball Sports, Combat Sports, Sports with Animals, and generally becomes fine-grained by the leaf level. For example, this dataset contains 6 different types of bowling, 7 different types of American football and 23 types of billiards.
The dataset was split by assigning 70% of the videos to the training set, 10% for the validation and 20% for the test set. Some images taken from the videos are shown in Fig. 3.3.
CHAPTER 3. Theorical Foundations
Figure 3.3: Prediction on Sports-1M test data. Blue (first row) indicates ground truth label and the bars below show model predictions sorted in decreased confidence. Greed and red distinguish correct and incorrect predictions, respectively.(Tran et al., 2015)
3.2
Generalized Canonical Time Warping
Zhou and De la Torre(2016) proposed an extension of Dynamic Time Warping (DTW) and set Canonical Correlation Analysis (mCCA) for temporally aligning multi-modal sequences from multiple subjects performing similar activities.
Given a collection of m time series, {Xi}mi=1, GCTW aims to seek for each Xi = [ xi
1, ... , xini ] ∈ R
di×ni, a low-dimensional spatial embedding V
i ∈ Rdi×d and a non-linear temporal transformation Wi = W(pi) ∈ {0,1}ni×l parameterized by pi ∈ {1 : ni}l, such that the resulting sequence VTi XiWi ∈ Rd×l is well aligned with the
others in the least-squares sense. Concisely, GCTW minimizes the sum of pairwise distances between the sequences:
min {Vi}i∈Φ,{pi}i∈Ψ Jgctw= m X i=1 m X j=1 1 2||V T i XiWi−VjTXjWj||2F + m X i=1 (φ(Vi) +ψ(pi))
whereφ(·) is the regularization function penalizing the irregularity of the spatial trans-formationVi, i.e., φ(Vi) = mλ 1−λ||Vi|| 2 F
where λ ∈ [0,1] is a parameter to trade-off between the least-square error and the regularization term. Following the multi-set Canonical Correlation Analysis (mCCA), GCTW constrains the spatial embeddings as :
3.3. OpenPose Φ = {{Vi}i| m X i=1 ViT((1−λ)XiWiWiTXiT +λI)Vi =I} .
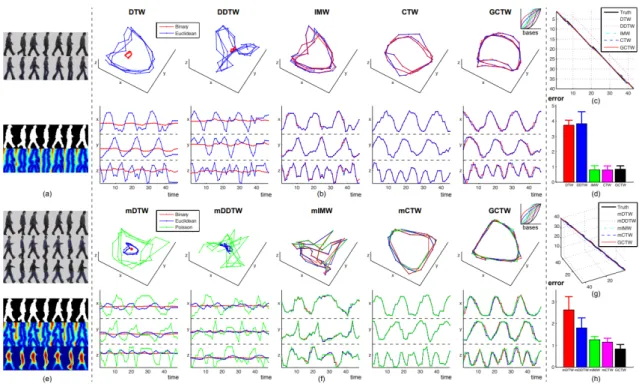
In Fig. 3.4 we can see howGCTWexcels in the alignment of multiple videos at a time. Getting a lower error rate than multi-sequence Dynamic Time Warping (mDTW), multi-sequence Derivative Dynamic Time Warping (mDDTW), multi-sequence Itera-tive Motion Warping (mIMW) and multi-sequence Canonical Time Warping (mCTW).
Figure 3.4: Comparison of temporal alignment algorithms for aligning multi-feature video data. (a) An example of two video sequences aligned by GCTW. The top two se-quences are the key-frames after background subtraction, while the bottom two are the binary images and the Euclidean distance transforms. (e) An example of three aligned videos by GCTW. The top three sequences are the original frames after background subtraction, while the bottom three are the binary images, the Euclidean distance transforms and the solutions of the Poisson equation. (b)(f) The alignment results. (c)(g) Comparison of time warping paths. (d)(h) Mean and variance of the alignment errors. . Image taken from Zhou and De la Torre(2016)
3.3
OpenPose
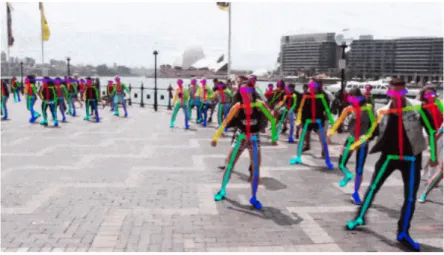
OpenPose represents the first real-time multi-person system to jointly detect human body, hand and facial points (135 points in total) on single images. It makes use of Convolutional Pose Machines (Wei et al., 2016), hand key-point detection using mul-tiview bootstrapping (Cao et al., 2017) and realtime multi-person 2D pose estimation using part affinity fields (Simon et al.,2017). An example is illustrated in Fig. 3.5. 18 Master Program in Computer Science - UCSP
CHAPTER 3. Theorical Foundations
In our case, we made use of its body pose estimation. The output of the body pose estimation gives 25 body parts, from which we used the left and right wrists. This key-points help us locate the position of the hands in the videos, and are shown in Fig. 3.6.
Figure 3.5: Example of multi-person body-foot estimation using OpenPose.
Figure 3.6: OpenPose Output format for the 25 key-points in the body.
3.3. OpenPose
Chapter 4
Proposal
As main contribution, our whole methodology achieves a good accuracy without using too many complex models. Our proposed model is mainly composed of 4 parts: a silent frame extraction, alignment withGCTW(Zhou and De la Torre,2016), masking everything but the hands, and two 3D convolutional networks (Tran et al., 2015) for RGB and depth data.
First, we noticed that the segmentation on the dataset is not the best, because most of the videos contain multiple frames which do not give any important informa-tion. We call these frames, ‘silent’, because these are frames where the signer is doing nothing, or is in a resting position. Thus, we make use of OpenPose to find the location of the hands, and extract the silent frames from the beginning and end of the videos.
Once we have deleted the silent frames, we will make use again of the positions of the hands that we got from OpenPose. This time we will use them to mask all the information that is not relevant, such as, background, cloth, body and so on. Which in our case would leave us with 2 squares and one hand inside each one.
Once we have our videos without silent frames, and masked, we proceed to align them usingGCTW. In this case, we will use the positions of the hands as the feature vector to align.
Finally, we use the two 3D convolutional networks, specifically the C3D model, for RGB and depth data, and fuse both results. This proposal is represented in Fig. 4.1.
4.1
Silent Frames Extraction
As mentioned before, the first step is to obtain the coordinates per frame of the hands in all the videos. For that, we make use of OpenPose which give us 25 body joints per image. From these points, we will only use the ones for the left and right hand wrists
4.1. Silent Frames Extraction
Figure 4.1: Proposed Model. The silent frame extraction removes frames with no relevant information, GCTW is in charge of aligning similar frames inside each class, after that we mask everything but the hands and finally use the C3D model for RGB and depth information.
Figure 4.2: Removal of silent frames. This specific case are the images from the sign M 00128 from the train set of the IsoGD. It has 88 frames, from which only 14 represent the sign, and the other 74 are frames where the signer is in a resting position.
joints.
Instead of finding the silent frames, we find the frames where the sign starts and where it ends, so we can get rid of everything else. To find the beginning frame of the sign, we find the first appearances of each hand, and save their coordinates as initial positions. Now we establish a radius, for that, we first take into account the size of the frames which is 320×240. We consider that about 10% of its size would be the best size for a radius. That would be between 24 and 32, so we tested with the values of 25, 30 and 35. After some testing, for the IsoGD dataset we found 30 to be the best for the radius.
Once a hand moves out of the radius of our initial positions, we start looking for the last frame of the video. We consider the last frame, as the frame where the hand moves back into the radius of the initial positions. And if it does not go back into the radius, we take the last frame of the video as the ending position of the sign . An example is shown in Fig. 4.2, where there are only 14 significant frames from the whole 88 frames the video has.
CHAPTER 4. Proposal
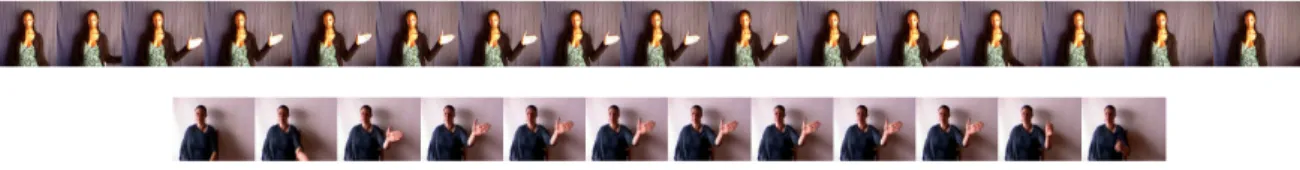
Figure 4.3: Two different videos of the same sign before alignment with GCTW.
Figure 4.4: Frames selected after being aligned with GCTW.
Another thing to take into account, is that even though OpenPose is a pretty good pose estimator, it is not perfect, and in some frames where there is some overlapping with the face, hand or body, the wrist joints are not correctly located, or are not found at all. To fix this, we employ linear interpolation over the values of the position of wrists that have already been found, to generate the missing middle key-points in the sequences.
Lastly, we noticed that after the silent frame extraction, there were some resultant videos with a really low number of frames, being the lowest some videos with 3 frames. Thus, we used a threshold, to know the quantity of data that is below this threshold. We used as threshold the numbers 6, 8, 10 and 12. Which resulted in 2.33%, 4.58%, 6.64% and 9.09% respectively, of the whole train set. For the videos that were below the threshold, we used all their frames and resize them dynamically. After testing with each threshold, we found that using 6 as threshold brought the best results.
4.2
Alignment
We first removed the silent frames because GCTW aligns strictly from beginning to end, which means that the first and last frame of each video will not change even after the alignment. The first and last frames are not the only problem, because all videos would be forcibly aligned from beginning to end, when it would be better to only align the segments that matter. Since we will be using this type of alignment, it is in our best interest that all videos are correctly segmented.
GCTW is a model that temporally aligns multiple sequences from multiple sub-jects that are performing similar activities. In this case, the sequences will be of size 4, which are thex, y coordinates from the left and right wrists joints. These are multiple sequences, because there will be a sequence per frame. Our subject will be the signer. A visual example ofGCTW can be seen in Fig. 4.3 and 4.4.
We proceed to extract features from the videos in our dataset. Being the features, Master Program in Computer Science - UCSP 23
4.3. Normalization and Masking the positions of left and right wrists joints, obtained with OpenPose. The amount of features to align will be 4 × the number of frames per video, all this multiplied by the number of videos in each class respectively. We proceed to cluster the features of the videos in each respective class, so we can proceed to align the features per class using GCTW.
The output of this alignment is per class. In each class, we receive a matrix of size number of videos × the largest video in each class. As mentioned before, GCTW aligns from beginning to end, meaning that the result of any alignment will have the size of the largest number of sequences. Each row of the matrix represents a frame from each video in the class, so every row represents the highest correlation between all the frames at a certain point of time.
4.3
Normalization and Masking
Once we have the indices, we proceed to select the indices that we will use for our newly resized train and test set. We select them by doing a simple sampling, which consists on dividing the number of indices by the number of frames we want per video. Finally, we create our new resized train and test set, without silent frames and aligned per class.
A fixed dimension of input data is required by the C3D model, we decided on 32 frames since it is the best choice validated by testing with different sizes(16, 32, 48) and also, because it is the nearest to the average of number of frames per video in the dataset used.
After selecting our 32 frames, we proceed to create square masks around the positions of the wrists and erase everything else. We used a square of size 60, because when we tested with a lesser value as 50, we found out that some hands would not fit entirely in that square. We also did not use the wrist joint as the center of the square, but we moved that center point upwards by 25% of the size of the square, so it would be more centered around the hand. This simple step will help the C3D model by getting rid partially of some distractors, such as the background, cloth, face or body. An example is showed in Fig. 4.5
All this process is made over the RGB data. For the depth data, we can not completely do the same process. We can not use the wrists position properly, because the depth images are not calibrated, which means that the positions will differ from the RGB data because of the distance from the camera to the signer is different fro every video in the dataset. So we end up using the same indices from the RGB data into the depth data. We also did not mask the depth data because we consider that it is not needed since depth data per se removes background and gives you the silhouette of the signer.
CHAPTER 4. Proposal
(a) Normal image. (b) Hand masked image.
Figure 4.5: A comparison between a normal and a hand masked image. In the hand masked image, there are 2 squares representing the left and right wrists obtained with OpenPose.
4.4
Classification
Once we have our new resized train and test sets with 32 frames per video, we utilize the C3D model. We use two C3D models, for depth and RGB information. We can not fuse RGB and depth at an early phase, because as mentioned before, depth data is not calibrated and will only worsen the accuracy of the model. We finetune each model over the weights that were already trained on the Sports-1M dataset.
After the 3 steps from before, silent frames extraction, alignment with GCTW and masking, the C3D model will be able to focus on learning the different aspects of the hand, and for temporal features, the movement of our masked hand will result useful.
An extra step that also showed an improvement in classification, is the re-training of both of our C3D networks, with the difference that we will be exchanging the weights learned from each other. This means, we will train over the rgb images with the weights of the C3D model that were learned over depth images, and viceversa.
Finally, we employ a fusion scheme for better performance. As RGB and depth are both available, we try to blend them together in this later stage. We used an averaging scheme, which consists on the average of both C3D models as the final classification.
4.4. Classification
Chapter 5
Experiments
In this chapter, we will describe our experiments done on a subset of the IsoGD dataset, taking also into account the experiments that did not work correctly on improving the classification. We also describe our method on the complete IsoGD dataset, plus a comparison with other methods that were tested on the same dataset.
5.1
ChaLearn Isolated Gesture Dataset (IsoGD)
The ChaLearn Looking at People RGB-D Isolated Dataset for gesture recognition (Wan et al.,2016) is the dataset that we use to test our method. The dataset consist of 47,933 videos. Each RGB-D video represents one gesture instance, having 249 gesture labels performed by 21 different individuals. There were 2 competitions based on this dataset, the first place in the first competition had an accuracy of 56.9% making use of the C3D model on 32-frame videos. In the second competition, the first place got an accuracy of 67.71%, they first unify the illumination of all RGB videos. Then generated optical flow videos as another modality of data. And used two different sampling strategies: uniform sampling and sectional weighted sampling. Finally, the 3 types of data, intensity, depth and optical flow are sent to C3D model for feature extraction.
The main reason we chose this dataset, is because it is one of the biggest and hardest datasets at the time. The number of different individuals makes it a good dataset for learning user-independent features. As well as all the different backgrounds, and positions of the signers with respect to the camera makes this dataset a difficult one.
5.2. Experiments with a subset of IsoGD
5.2
Experiments with a subset of IsoGD
We used a subset of the IsoGD Dataset, we used the first 100 classes, labeled from 1 to 100. The purpose of using only a subset and not the whole database, was so that the we could save computation time, thus making it possible to experiment more on the dataset.
The experiments on the C3D model were done with a base learning of 0.001, we also use gamma of 0.9, which is the factor that will decrease the learning rate each 2 epochs. Weight decay was 5e−5 and the solver was Stochastic Gradient Descent (SGD), which is caffe’s default solver.
5.2.1
Experiments with the proposed model
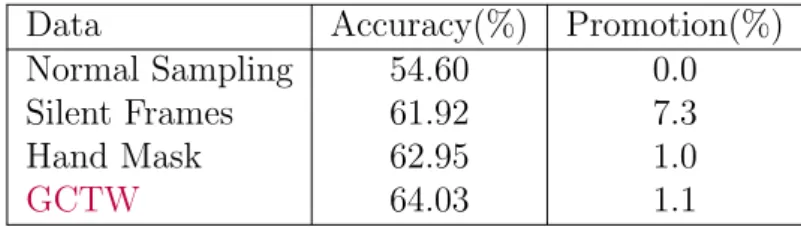
The results of the 3 steps of our model as well as the base accuracy model are shown in Table5.1, where we can see that there has been an improvement of 9.4% in performance. All these experiments were only done on the intensity data, given that we will be using the same selected frames per video in the depth data. Results of intensity + depth data will be shown in the next sub-section.
• Normal Sampling: It refers to resize the videos by dividing the number of frames of each video per 32. This step is taken as the base model, because the IsoGD presents videos ranging from 1 to 405, and the gestures made in this videos vary in speed too, so without any selection or alignment of frames this would achieve the lowest possible accuracy.
• Removal of Silent Frames: There is a big gap between the smallest and largest video in the dataset, and the biggest reason for that is that the videos are not correctly segmented. Most of the videos present large amounts of silent frames that do not help in slightest for the classification. Here we first remove the silent frames by making use the position of the hands that we obtained with OpenPose. After that we use a normal sampling over the remaining frames.
• Hand Mask: After removing the silent frames and normal sampling the frames. To keep low the negative effect of background, clothes, body and so on. We erase everything that will not help to improve the performance. We proceed to create a square mask over the position ob both wrists. In this case we used the size 60×60 pixels. This size was chosen after a few visual experiments on the dataset. • GCTW: Another problem to solve is the the difference of speed at each sign,
made by the different individuals in the dataset. The best way to approach this problem is by aligning similar signs, thus making the speed at each sign relatively more similar. In this case, after removing the silent frames, we proceed to use GCTW to create a new sampling based on the position of both wrists on each frame. After that, we use the hand mask over our new selected frames.
CHAPTER 5. Experiments
Table 5.1: Results of C3D model over 4 different types of data on a subset of IsoGD.
Data Accuracy(%) Promotion(%)
Normal Sampling 54.60 0.0
Silent Frames 61.92 7.3
Hand Mask 62.95 1.0
GCTW 64.03 1.1
5.2.2
Other sampling methods used
The following methods were tested on the subset of the IsoGD (100 classes). Most of the methods did not improve the results, and if they improve it, it was not relevant enough. In Table5.2, we illustrate the results of the following methods.
1. We sort the frames by using the difference of each frame with its consecutive one. After that, we use the frames with the highest differences. Even though the idea is good, it is not that reliable to use the difference between images, the best option would have been to use the coordinates and select the frames where the hands moves more. 57.35% accuracy achieved.
2. In this case, we use the difference of every frame against the very first frame of the video. Again, we use the frames with highest differences. The reason to compare against the first frame is because the sign would be made far from the resting position of the individual. Again, it is not that reliable to do this using the images. 54.98% accuracy achieved.
3. We used a combination of both previous methods. We used half of the chosen frames by each method, the ones with the highest difference. Again here, the use of images and not coordinates played against our performance. 55.08% accuracy achieved.
4. We used VGG16 to get a feature vector of each frame of every video, and used PCA to reduce the dimensionality of the vectors to 15. After that we used K-means over the reduced features of every video and used the nearest frame to every center of the 32 clusters made with K-means. In this case, we used features of images, to reduce the processing time. But still it looks like the clustering of images per video is not a good type of alignment. An improvement in here would be using the images and not features from them. Obtaining 54.55% accuracy. 5. First, we used the first method in this list, a sampling using the highest difference
between consecutive frames. After that, we used the otsu method over the depth data to create masks. A problem here is that the depth videos are not calibrated, meaning that the depth masks will not overlap correctly with RGB images. We used those masks over the RGB data. Obtaining 54.45% accuracy.
6. We used two different types of saliency (Zhu et al., 2014; Zhang et al., 2015) to create masks over the RGB data. Both masks focus on the body and erase Master Program in Computer Science - UCSP 29
5.3. Experiments on complete IsoGD most of the background. Here, the C3D model showed that it can easily ignore different backgrounds, this is the reason why later on we mask everythin but the hands. Both saliency methos achieved 55.68% and 45.85% accuracy respectively. 7. We used OpenPose to get the positions of both wrists and elbows. Then, we used GCTW to align those features. First, we only used wrists positions and obtained 57.18% accuracy and when using wrists and elbows we obtained 56.43% accuracy. This shows that using the joint positions helps more that using the RGB image as they are.
Table 5.2: Results of multiple sample methods tested on the subset of the IsoGD. Method(#) Accuracy(%) 1 57.35 2 54.98 3 55.08 4 54.55 5 54.55 6 55.68 7 57.18
5.3
Experiments on complete IsoGD
The experiments with the C3D model were done using the same parameters as men-tioned in the experiments where we used a subset of IsoGD (100 classes). In this case, we use the whole IsoGD dataset, which means all 249 signs present on the IsoGD, which are 35878 videos in the train set and 6271 in the test set.
In Table5.3we can see the results of our proposed model over the intensity images of the whole dataset. Our strategy gained a total of 10% performance over intensity data.
As we can see in the Table 5.3, a good improvement of accuracy, is made by the extraction of silent frames. The reason for this, is that after the removal of silent frames, the dimension of the videos is drastically reduced. Leaving little space to improve by the alignment stage. We believe that if the gestures were to be longer, the alignment would show a bigger improvement of accuracy, but in the case of the IsoGD, the majority of the gestures are short and quick.
And the biggest improvement of accuracy is made by the re-training of our net-works, using as initial weights, the weights that were learned by the other C3D network. The reason for this is because we are using the important features that each model found in the previous training, and adding the new features found in the other type of data. This step showed good improvement with both depth and RGB data.
CHAPTER 5. Experiments
Table 5.3: Results of C3D model with the complete IsoGD. Intensity data.
Data Accuracy(%) Promotion(%)
Normal Sampling 49.66 0.00
Silent Frames 52.65 3.0
Hand Mask 53.07 0.4
GCTW 53.50 0.4
Re-training 59.73 6.2
Once we have the indices of frames selected with GCTWover the intensity data, we use those same indices over the depth data. In this case, we do not use the hand mask because the main reason of masking is to partially remove the background. And in depth images there is no problems with different backgrounds. And also here, the re-training showed to be the biggest improvement of performance. Results are shown in Table5.4.
Table 5.4: Results of C3D model with the complete IsoGD. Depth data.
Data Accuracy(%) Promotion(%)
Normal Sampling 56.06 0.0
Silent Frames 58.28 2.2
GCTW 58.92 0.6
Re-training 61.85 2.9
5.3.1
Fusion results on IsoGD
Table 5.5 shows the comparison of the different fusion strategies that we tested on IsoGD dataset. As illustrated, we used four strategies. The first three strategies, are just about changing the weights of RGB and depth data to 2:1, 1:1, 1:2 ratios respectively. Where the ratio 1:1 demonstrated to be the better one. This showed that both types of data should receive the same amount of importance at the moment of classification.
The last one, is about using a Fully Connected Network that takes as input the concatenation of RGB and depth vectors. This last method showed that it does not improve the results, but overfits, so the result is as near as possible to the results of depth data, since it has a higher accuracy than RGB data.
5.3.2
Comparison on IsoGD
Our proposed method obtained 65.02% accuracy on the IsoGD dataset, which would ranks us 5th, by a difference of 2.69% from the first place in the 2017 Chalearn LAP isolated gesture recognition challenge. In addition, our method is simpler than most of the state-of-the-art models. The comparison of the previously mentioned methods and Master Program in Computer Science - UCSP 31
5.3. Experiments on complete IsoGD Table 5.5: Results of fusion methods of depth and RGB results.
Fusion Method Test(%)
RGB C3D 59.73 Depth C3D 61.85 2:1 (RGB + Depth) 60.97 1:1 (RGB + Depth) 65.02 1:2 (RGB + Depth) 62.84 FCN (RGB + Depth) 61.83
ours is illustrated in Table 5.6. Compared to most of the methods, ours, reduces the number of models and obtains a fairly good accuracy.
The only team that resembles the number of models is Lostoy, which also used 2 C3D models for rgb and depth. Regretfully, they did not published a paper as far as we know, in Wan et al. (2017) there is a small description of their work. As well as in ChaLearn (2018) where they show the fact sheet and code, of every group that participated. They use the re-training by changing the learned weights of the depth and RGB models. And there was no further explanation as which type of sampling they used.
Table 5.6: Results of fusion methods of depth and RGB results.
# Team Test(%) Model Number
1 ASU(Miao et al., 2017) 67.71 7 (4*C3D+2*TSN+1*SVM)
2 SYSE ISEE 67.02 6 (5*VGG16+1*LSTM)
3 Lostoy 65.97 2 (2*C3D)
4 AMRL(Wang et al.,2017) 65.59 12 (8*CNN+4ConvLSTM) 5 XDETVP(Zhang et al., 2017) 60.47 3 (3*ConvLSTM)
6 Ours 65.02 2 (2*C3D)