Department for Work and Pensions
Research Report No 174
Corporate Document Services
A comparison of Child Benefit
packages in 22 countries
Jonathan Bradshaw and Naomi Finch
A report of research carried out by the University of York on behalf of the Department for Work and Pensions
© Crown Copyright 2002. Published for the Department for Work and Pensions under licence from the Controller of Her Majesty’s Stationery Office by Corporate Document Services, Leeds.
Application for reproduction should be made in writing to
The Copyright Unit, Her Majesty’s Stationery Office, St Clements House, 2-16 Colegate, Norwich NR3 1BQ.
First Published 2002.
ISBN 1 84123 506 7
Views expressed in this report are not necessarily those of the Department for Work and Pensions or any other Government Department.
iii
Contents
Acknowledgements ... xiii
The Authors ... xvi
Summary ... 1
1 Introduction and methods ... 15
1.1 Background ... 15
1.2 Objectives ... 16
1.3 Policy interest ... 16
1.4 Methods ... 17
1.5 Model family method ... 17
1.5.1 Income cases ... 18
1.5.2 Family types ... 18
1.5.3 Child benefit package ... 19
1.5.4 Problems with the model family method ... 20
1.6 Converting national currencies ... 21
1.7 Organisation of the report ... 22
2 The demographic and labour market context ... 23
2.1 Introduction ... 23
2.2 Demographic context ... 23
2.2.1 Population size and structure ... 23
2.2.2 Family demography ... 24
2.2.3 Lone parents and lone mothers – prevalence and type ... 25
2.3 Employment context and earnings ... 27
2.3.1 Workless households ... 28 2.3.2 Employment status ... 30 2.4 Earnings ... 32 2.4.1 Minimum wage ... 34 2.5 Conclusion ... 35
Contents
iv
Contents
3 Income tax, social security contributions and cash benefits for
families in employment ... 37
3.1 Introduction ... 37
3.2 Income tax ... 37
3.3 Significant changes in the tax benefit system since 1996 ... 38
3.4 Current tax benefits for families with children ... 40
3.4.1 Variation in tax benefits by age of child ... 42
3.4.2 Variation in tax benefits by family type ... 42
3.4.3 Variation by number of earners ... 42
3.4.4 Variation by hours worked ... 43
3.4.5 Who receives tax benefits? ... 43
3.5 Value of child tax benefits ... 43
3.6 Social security contributions ... 47
3.7 Future plans ... 49
3.8 Child cash benefits and child support ... 49
3.8.1 Significant changes in cash benefits and child support since 1996 ... 49
3.8.2 Current policy ... 50
3.8.3 Child support ... 55
3.9 Matrix analysis ... 58
3.10 Future changes ... 62
3.10.1 Non income-related child benefits ... 62
3.10.2 Income-related child benefits ... 62
3.10.3 Child Support ... 63
3.11 Conclusion ... 63
4 Housing costs, housing subsidies and local taxes ... 65
4.1 Introduction ... 65
4.2 Housing benefits ... 66
4.2.1 Significant changes in housing benefits since 1996 ... 66
4.2.2 Current housing benefits ... 67
4.3 Local taxes ... 72
4.4 Future changes ... 74
4.5 Conclusion ... 75
5 Childcare and education costs and benefits ... 77
5.1 Introduction ... 77
5.2 Pre-school childcare ... 79
5.2.1 Significant changes in childcare policy since 1996 ... 79
5.2.2 Current policy ... 79
5.3 The costs of pre-school childcare ... 85
5.4 Future policy ... 88
5.5 Out of school childcare ... 89
5.5.1 Significant changes in out of school childcare policy since 1996 ... 89
5.5.2 Current policy ... 89
v
5.6 Education costs and benefits ... 90
5.6.1 Significant changes in education costs and benefits affecting families and children since 1996 ... 90
5.7 Educational arrangements ... 90
5.7.1 Current education costs and benefits ... 90
5.8 Matrix analysis of the costs of education ... 92
5.9 Future changes ... 94
5.10 Conclusion ... 95
6 Health costs ... 97
6.1 Introduction ... 97
6.2 Significant changes in policies affecting families and children since 1996 ... 97
6.3 Current health costs ... 97
6.4 Matrix analysis ... 99
6.5 Future changes ... 101
6.6 Conclusion ... 102
7 Maternity leave, paternity leave, parental leave and leave to care for sick children ... 103
7.1 Introduction ... 103
7.2 Significant changes in leave to care for children since 1996 ... 103
7.3 Current statutory arrangements for maternity leave ... 104
7.4 Maternity allowances and maternity grants ... 108
7.4.1 Maternity allowances ... 108
7.4.2 Maternity grants ... 109
7.5 Statutory arrangements for paternity leave ... 110
7.6 Statutory parental leave ... 112
7.7 Statutory leave to care for sick children ... 115
7.8 Future changes ... 117
7.8.1 Parental leave ... 117
7.8.2 Paternity leave ... 117
7.8.3 Maternity leave, childcare leave and leave to care for sick children .... 117
7.8.4 Proposed plans ... 117
7.9 Conclusion ... 117
8 Social assistance ... 119
8.1 Introduction ... 119
8.2 Significant changes in social assistance since 1996 ... 120
8.3 Current policy ... 120
8.4 The level of social assistance ... 124
8.5 The implied equivalence scale in social assistance ... 128
8.6 Conclusion ... 130
vi
9 The structure and level of the child benefit package ... 133
9.1 Introduction ... 133
9.2 Structure ... 133
9.2.1 A large poor family ... 133
9.2.2 A small well-off family ... 135
9.2.3 An ‘average family’ Case 4 ... 137
9.2.4 A lone parent needing childcare ... 138
9.2.5 Social assistance case ... 140
9.3 The level of the child benefit package ... 141
9.3.1 Variation by family size ... 143
9.3.2 Variation by earnings ... 145
9.3.3 Variation by family type ... 147
9.4 Conclusion ... 150
10 Average marginal tax rates and notional replacement rates ... 155
10.1 Introduction ... 155
10.2 Average marginal rates ... 155
10.3 Replacement rates ... 159
10.4 Work tests for lone parents ... 161
10.5 Future changes ... 164
10.6 Conclusion ... 164
11 Explanations for variations in the level of the child benefit package ... 167
11.1 Introduction ... 167
11.2 Constructing a summary measure of the child benefit package ... 167
11.3 Seeking explanations for the variations observed ... 172
11.4 Level of national wealth (Gross Domestic Product per capita) ... 173
11.5 Social expenditure ... 174
11.6 Expenditure on family benefits and services ... 176
11.7 Priority for the elderly? ... 176
11.8 Do earnings matter? ... 177
11.9 Mothers’ employment rates ... 178
11.10 Women’s pay ... 179
11.11 Minimum wage ... 179
11.12 Prevalence of lone parents ... 180
11.13 Outcomes ... 180 11.13.1 Child poverty ... 180 11.13.2 Fertility ... 182 11.14 Conclusion ... 183 12 Conclusion ... 185 12.1 Introduction ... 185
12.2 The demographic and labour market context ... 185
12.3 Income tax, social security contributions and cash benefits ... 186
12.4 Housing costs, housing subsidies and local taxes ... 186
12.5 Childcare and education costs and benefits ... 186
Contents
vii
12.6 Health costs ... 187
12.7 Maternity leave, paternity leave, parental leave and leave to care for sick children ... 187
12.8 Social assistance ... 187
12.9 Explanations for variations in the level of the child benefit Package ... 188
12.9.1 Purchasing power parities rank ... 188
12.9.2 Percentage of average earnings rank ... 189
Appendix A Introduction and methods ... 191
Appendix B The demographic and labour market context ... 201
Appendix C Income tax, social security contributions and cash benefits for families in employment ... 207
Appendix D Housing costs, housing subsidies and local taxes ... 211
Appendix E Childcare and education costs and benefits ... 217
Appendix F Social assistance ... 221
Appendix G Explanations for variations in the level of child benefit package ... 227
References ... 237
Other research reports available ... 241
List of tables
Table 2.1 Population size and structure ... 24Table 2.2 Lone parents and lone mothers as a percentage of all families with children: most recent data ... 26
Table 2.3 Marital status of lone mothers ... 27
Table 2.4 Percentages of workless lone-parent and couple households with dependent children ... 29
Table 2.5 Employment status of married/cohabiting mothers and lone mothers of dependent children (%) ... 31
Table 2.6 Gender wage gap: Female full-time earnings as a proportion of male full-time earnings ... 33
Table 2.7 Minimum wages in £ ppps per month and ratio of adult minimum wages to mean and median full-time wages ... 35
Table 3.1 Characteristics of tax credits and allowances ... 40
Table 3.2 Level of income tax payable in £ ppp per month on different earnings levels: Couple + 2 children of school age (A negative amount is tax paid a positive amount is a tax benefit) ... 44
Table 3.3 Value of child tax benefits by family type and size: one earner half male earnings (Case 2), £ ppp per month ... 45
Table 3.4 Value of child tax benefits by family type and size: one earner average male earnings (Case 4), £ ppp per month ... 46
Table 3.5 Value of child tax benefits by family type and size: two earners average male, half average female earnings (Case 6), £ ppp per month ... 47
viii
Table 3.6 Level of social security contributions in £ ppp per month on different earnings
levels for a couple with two children ... 48
Table 3.7 Characteristics of non-income-related child cash benefits ... 52
Table 3.8 Characteristics of income-related child cash benefits ... 54
Table 3.9 Child support arrangements ... 56
Table 3.10 Child cash benefits by earnings. Couple + two school age children. £ ppp per month ... 59
Table 3.11 Cash benefits by family type and size. One earner on half average male earnings (Case 2) £ per month ppp ... 60
Table 3.12 Cash benefits by family type and size. One earner on average male earnings (Case 4) £ per month ppp ... 61
Table 3.13 Cash benefits by family type and size. Two earners average male plus half average female earnings (Case 6) £ ppp per month ... 62
Table 4.1 Supply and demand side housing subsidies ... 69
Table 4.2 Gross rents assumed (20% of average earnings) in £ ppps per month ... 70
Table 4.3 Net rent paid by earnings level: Couple plus two school age children ... 71
Table 4.4 Rent by family type and size. One earner half average male earnings (Case 2) Ratios Gross rent = 100 ... 72
Table 4.5 Local taxes for a couple plus two children by earnings, £ ppp ... 73
Table 4.6 Local taxes by family type. Earning half male earnings. Case 2. £ ppps per month ... 74
Table 5.1 Childcare and education arrangements ... 78
Table 5.2 The proportions of pre-school children using the most prevalent form of formal childcare ... 81
Table 5.3 Pre-school childcare arrangements for a child aged 2 years and 11 months ... 83
Table 5.4 Costs of full-time pre-school childcare per month. Most prevalent type of pre-school childcare in each country. After direct subsidies but before taxes and benefits. £ ppp ... 85
Table 5.5 Extra value of tax benefits and cash benefits for a pre-school child in childcare. Most prevalent type of childcare in each country. £ ppp per month ... 87
Table 5.6 Net costs of full-time childcare. Most prevalent type of childcare in each country. After direct and indirect subsidies and after taxes and benefits. £ ppp per month ... 88
Table 5.7 Education costs and benefits ... 91
Table 5.8 Education costs and benefits by earnings level. Couple + two school age children £ ppp ... 92
Table 5.9 Education costs and benefits by family type and size. One earner on half average male earnings (Case 2) £ per month ppp ... 93
Table 5.10 Education costs and benefits by family type and size. Two earners average male plus half average female earnings. Case 6. £ per month ppp ... 94
Table 6.1 Health costs for children ... 98
Table 6.2 Health costs for adults ... 99
Table 6.3 Actual total health costs, couple plus two children, £ per month ppp ... 100
Table 6.4 Health costs by family type and size. One earner average male earnings (Case 4), £ per month ppp ... 101
Contents
ix
Table 7.1 Statutory Maternity leave arrangements ... 106
Table 7.2 Maternity allowances ... 109
Table 7.3 Maternity grants ... 110
Table 7.4 Statutory paternity leave arrangements ... 111
Table 7.5 Statutory parental leave arrangements ... 113
Table 7.6 Statutory leave to care for sick children ... 116
Table 8.1 Social assistance for families with children ... 121
Table 8.2 Proportion of lone parents and couples with children receiving social assistance and the proportion of lone mothers who are employed ... 123
Table 8.3a Social assistance before housing and services, £ purchasing power parities ... 125
Table 8.3b Social assistance after housing costs, £ purchasing power parities ... 126
Table 8.3c Social assistance after housing costs and services, £ purchasing power parities ... 127
Table 8.4a Implied equivalence scale of social assistance before housing costs ... 129
Table 8.4b Implied equivalence scale of social assistance after housing and services ... 130
Table 9.1 Structure of the child benefit package for a couple plus 3 children with one earner on half average male earnings (Case 2) ... 134
Table 9.2 Structure of the child benefit package for a couple plus one child with two earners on average male and average female earnings (Case 7) ... 136
Table 9.3 Structure of the child benefit package for a couple plus two children with one earner on average male earnings (Case 4) ... 137
Table 9.4 Structure of the child benefit package for a lone parent plus one child with one earner on average female earnings (Case 5) ... 139
Table 9.5 Structure of the child benefit package for a couple plus one child on social assistance (Case 8) ... 140
Table 9.6a Value of the child benefit package. Couple plus two children, one earner male average earnings (Case 4) ... 141
Table 9.6b Value of the child benefit package. Couple plus two children, two earners average male and half average female earnings (Case 6) ... 143
Table 9.7a Variation in child benefit package by number of children. Ratio: Childless couple = 100. One earner average male earnings (Case 4). After tax benefits and cash benefits only ... 144
Table 9.7b Variation in child benefit package by number of children. One earner average male earnings (Case 4). Childless couple = 100. After taxes, cash benefits, housing costs and services ... 145
Table 9.8a Variation in the child benefit package by earnings (and number of earners). Couple plus two children. After taxes and cash benefits ... 146
Table 9.8b Variation in the child benefit package by earnings (and number of earners). Couple plus two children. After taxes, cash benefits, services and housing costs ... 147
Table 9.9a Child benefit package for a lone parent. Difference between the income of a lone parent with one child aged 7 and a single childless person on the same earnings. £ per month ppp ... 148
Table 9.9b Comparison of the child benefit package for a lone parent and couple on the same earnings. After taxes and cash benefits £ ppp ... 149
x
Table 9.9c Comparison of the child benefit package for a lone parent and couple on the same earnings. After taxes, cash benefits, services and
housing costs. £ ppp ... 150
Table 10.1 Marginal tax rates for a lone parent: percentage of extra earnings foregone in taxes and lost benefits in moving from one earnings level to another ... 156
Table 10.2 Marginal tax rates for couple + 2 children: percentage of extra earnings foregone in taxes and lost benefits in moving from one earnings level to another ... 157
Table 10.3 Marginal tax rates – impact of a partner starting work. Impact of childcare after taxes, benefits and services ... 158
Table 10.4 Replacement rates for couples one earner on half average earnings ... 159
Table 10.5 Replacement rates for lone parents on half average female earnings ... 160
Table 10.6 Work test for lone parents and employment rate for lone mothers with dependent children ... 162
Table 11.1 Ranking of the mean value of the child benefit package. All cases, £ ppps ... 168
Table 11.2 Ranking of the value of the child support package. All cases. Percentage of average earnings ... 169
Table 11.3 Ranking of the value of the child support package‘. Representative’ cases, £ppps ... 171
Table 11.4 Ranking of the value of the child support package. ‘Representative’ cases, as a percentage of average earnings ... 172
Table A.1 Example of model families matrix – July 2001 ... 196
Table A.2 Exchange rates and purchasing power parities ... 198
Table A.3 Conversion factors for July 2001 ... 199
Table A.4 National average earnings July 2001 ... 200
Table B.1 Family demographic indicators ... 201
Table B.2 Percentages of ILO unemployed ... 202
Table B.3 Overall mean monthly earnings, male and female mean monthly earnings in national currencies and £ purchasing power parities ... 203
Table B.4 Overall median monthly earnings, male and female median monthly earnings in national currencies and £ purchasing power parities ... 204
Table B.5 A summary of the minimum wage ... 205
Table C.1 Income tax payable by a childless couple as a proportion of gross earnings ... 207
Table C.2 Income tax and social security contributions payable by a childless couple as a proportion of gross earnings ... 208
Table C.3 Income tax, social security contributions and net local tax payable by a childless couple as a proportion of gross earnings ... 209
Table D.1 Assumed location and tenure ... 211
Table D.2 Proportion of all dwellings that are public/private rented ... 212
Table D.3 Eligibility for housing benefit ... 213
Table D.4 Rent by family type and size. One earner half male earnings £ per month ppp (Case 2) ... 214
Table D.5 Local tax arrangements ... 215
Table E.1 Proportion of school age children in out of school childcare ... 217
Table E.2 Out of school childcare arrangements ... 218
Contents
xi
Table E.3 Eligibility for allowances for 16-18 year olds ... 220
Table F.1 Income tax contributions of families on social assistance, £ ppps ... 221
Table F.2 Social security contributions of families on social assistance, £ ppps ... 222
Table F.3 Net rent as proportion of gross rent for families on social assistance (%) ... 223
Table F.4 Health charges on social assistance, £ ppps ... 224
Table F.5 School costs and benefits on social assistance, £ ppps ... 225
Table G.1 Ranking of the mean value of the child support package for lone parents, £ ppps ... 227
Table G.2 Ranking of the mean value of the child support package for lone parents, as % average earnings ... 228
Table G.3 Ranking of the mean value of the child support package for families on social assistance (Case 8), £ ppps ... 229
Table G.4 Ranking of the mean value of the child support package for families on social assistance, as % average earnings ... 230
Table G.5 Ranking of the mean value of the child support package for families on half average earnings (Cases 2 and 3), £ ppps ... 231
Table G.6 Ranking of the mean value of the child support package for families on half average earnings (Cases 2 and 3) , as % average earnings ... 232
Table G.7 Ranking of the mean value of the child support package for families on average earnings (Cases 4 and 5), £ ppps ... 233
Table G.8 Ranking of the mean value of the child support package for families on average earnings (Cases 4 and 5), as % average earnings ... 234
Table G.9 Ranking of the mean value of the child support package for double earner families (Cases 6 and 7), £ ppp ... 235
Table G.10 Ranking of the mean value of the child support package for double earner families (Cases 6 and 7), as % average earnings ... 236
List of figures
Figure 1 Cash benefit package after housing and services ... 2Figure 2 Cash benefits and tax benefits for children: Couple plus two aged 7 and 14. July 2001 ... 3
Figure 3 Cash benefits and tax benefits for children: Couple plus two aged 7 and 14. July 2001 ... 4
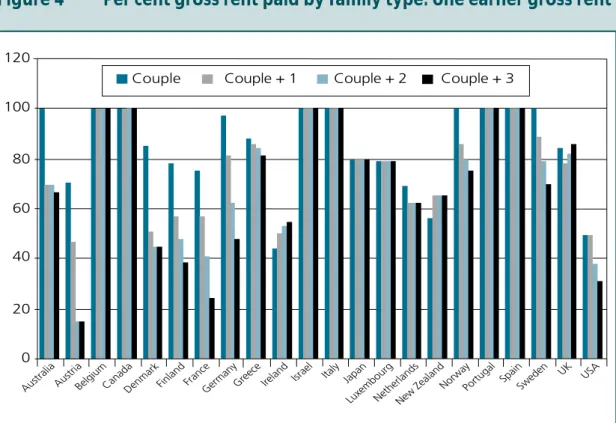
Figure 4 Per cent gross rent paid by family type: one earner gross rent ... 5
Figure 5 Net costs of full-time children ... 6
Figure 6 Social assistance ... 7
Figure 7 Social assistance implied equivalence ... 8
Figure 8 Structure of the child benefit package ... 9
Figure 9 Child benefit package by number of children. Childless couple=100 ... 10
Figure 10 Child benefit package by earnings ... 10
Figure 11 Child benefit package by family type at average earnings ... 11
Figure 12 Replacement rates at half average earnings ... 12
Figure 13 Marginal tax rates on moving from half average earnings of average earnings ... 12
xii
Figure 3.1 Cash benefits and tax benefits for children; couple + two aged 7 and 14 ... 63
Figure 3.2 Cash benefits and tax benefits for children; couple + two aged 7 and 14 ... 64
Figure 4.1 % gross rent paid by family type: one earner 50% average. Gross rent = 100 ... 75
Figure 5.1 Net costs of full-time childcare ... 95
Figure 8.1 Social assistance ... 131
Figure 8.2 Social assistance implied equivalence ... 131
Figure 9.1 Structure of the child benefit package ... 151
Figure 9.2 Child benefit package by number of children. Childless couple = 100 ... 152
Figure 9.3 Child benefit package by earnings ... 153
Figure 9.4 Child benefit package by family type at average earnings ... 154
Figure 10.1 Replacement rates at half average earnings ... 165
Figure 10.2 Marginal tax rates on moving from half average earnings to average earnings ... 165
Figure 11.1 Child benefit package by GDP per capita $ ppp ... 174
Figure 11.2 Child benefit package by social expenditure as % GDP ... 175
Figure 11.3 Child benefit package by social expenditure, 1997 ... 175
Figure 11.4 Child benefit package by expenditure on family benefits and services ... 176
Figure 11.5 Child benefit package by family benefits + services as % elderly benefits and services ... 177
Figure 11.6 Child benefit package by average earnings ... 177
Figure 11.7 Child benefit package by mothers’ employment rates ... 178
Figure 11.8 Child benefit package by gender pay ratio ... 179
Figure 11.9 Child benefit package by minimum wage ... 179
Figure 11.10 Lone parents’ child benefit package by prevalence of lone parents ... 180
Figure 11.11 Child benefit package by ‘absolute’ child poverty ... 181
Figure 11.12 Child benefit package by relative child poverty rate ... 181
Figure 11.13 Child benefit package by fertility rate, 2000 ... 182
Figure 11.14 Child benefit package after housing and services ... 183
Figure 12.1 Child benefit package after housing and services ... 188
Figure A.1 Impact of transfers on child poverty rates mid-1990s ... 193
Figure A.2 Expenditure on family benefits and family services: US $ ppp per child 1997 ... 194
Figure A.3 Expenditure on family benefits and family services: US $ ppp per child (fixed prices) ... 194
Contents
xiii
Acknowledgements
Acknowledgements
The project on which this report is based was funded by HM Treasury as part of the first round of the
Evidence Based Policy Fund. The Department for Work and Pensions (DWP) provided matching funding. Staff in DWP were responsible for managing the project and we are grateful to Elaine Squires, Jane Sweeting and especially Anja Nickenig who was our liaison officer. Our thanks are also due to the Inter-departmental Advisory Committee which included representatives from the Inland Revenue (IR), Social Exclusion Unit (SEU), Department for Education and Skills (DfES), HM Treasury and Cabinet Office as well as from DWP.
In the Social Policy Research Unit Julie Williams provided technical support for the analysis of the matrix data. Emese Mayhew and Lucy Bradshaw undertook vital work extracting data from the country matrices and checking and re-checking tables. Sally Pulleyn put the final touches to the manuscript.
However, the most important contribution was made by the national informants who completed a policy questionnaire, a model families matrix and then endured endless supplementary enquiries. The national informants were given an opportunity to check and comment on our interpretation of what they told us, but in the end any mistakes or misinterpretation are our responsibility. We are very grateful for the vital contribution they made to this project.
National Informants
The national informants were chosen because of their expertise in this field of social policy. They are mostly academics working in research centres or universities and come from a range of disciplines. Many of them have collaborated with us before on comparative studies of social protection.
xiv
Country Name Location Email
Australia Dr Tony Eardley SPRC, Sydney [email protected]
Austria Helmut Wintersberger and University of Vienna [email protected] Karl Woerister Federal Chamber of [email protected]
Labour, Vienna
Belgium Dr Karel Van den Bosch UFSIA [email protected] Canada Michael Mendelson Caledon Institute [email protected]
of Social Policy
Denmark Professor Peter Abrahamson University of [email protected]
and Copenhagen
Per Kampmann Ministry of Social Affairs
Finland Professor Veli-Matti Ritakallio University of Turku [email protected] France Antoine Math Institut de Recherches [email protected]
Economiques et Sociales (IRES)
Germany Professor Ilona Ostner University of Goettingen [email protected] Dr Sigrid Leitner [email protected] Dr Margit Schratzenstaller University of Giessen margit.w.schratzenstaller@
wirschaft.uni-giessen.de Greece Dr Theodoros Papadopoulos University of Bath [email protected] Ireland Professor Brian Nolan ESRI, Dublin [email protected]
and Brenda Gannon [email protected]
Israel Dr Asher Ben-Arieh and Hebrew University, [email protected] Dr John Gal Jerusalem [email protected] Italy Dr Yuri Kazepov University of Urbino [email protected]
Stefania Sabatanelli
Japan Dr Michi Tokoro Osaka City University [email protected] Luxembourg Fred Berger and Monique CEPS/ [email protected]
Borsenberger INSTEAD [email protected] Netherlands Dr Trudie Knijn and University of Utrecht [email protected]
Chrisje Couwenbergh
New Zealand Bob Stephens Victoria University [email protected] of Wellington
Norway Dr Anne Skevik and NOVA, Oslo [email protected]
Charlotte Koren [email protected]
Portugal Ana Cardoso CESIS, Lisbon [email protected]
xv
Country Name Location Email
Spain Gloria Trinidad University of [email protected] Computense,
Pedro Tamayo UNED, Madrid [email protected] Sweden Kenneth Nelson SOFI, Stockholm [email protected] UK Naomi Finch and Tina Davis SPRU, University [email protected]
of York
USA Professor Sheila Kamerman, Department of [email protected] Professor Alfred Kahn and Social Work, [email protected] Dr Shirley Gatenio University of Columbia [email protected]
xvi
The Authors
The Authors
Jonathan Bradshaw is Professor of Social Policy and Associate Director of the Social Policy Research Unit at the University of York.
1
Summary
Summary
Every industrial country has a ‘package’ of tax allowances, cash benefits, exemptions from charges, subsidies and services in kind, which assist parents with the costs of raising children. This study is an investigation of variations in the structure and level of this package in 22 countries as at July 2001.
Headline
Figure 1 presents the overall ranking of the average child benefit package paid to a ‘representative’ sample of families. Austria has a package which is considerably more generous than any other country. The UK comes seventh, equal to Belgium, in the league table. For the UK this is a substantial improvement over the ranking obtained in a similar study in 1992. It is a reflection of the efforts that the government has been making since 1997 to improve family benefits and services in pursuit of their objective to abolish child poverty. The negative child benefit package for some countries is because housing costs and charges for services cancel out the values of tax and cash benefits for children.
Methods
The data was obtained by national informants who provided data on family demography and labour supply and details of their tax benefits, cash benefits and services in their countries. They also completed a matrix, which simulated how families of varying types at varying earnings levels would be treated by the child benefit package in their country.
2
Summary
Figure 1
Cash benefit package after housing and service
Context
Policies that help parents with the costs of child rearing operate in the context of varying national family patterns, varying labour market conditions and variations in the level of earnings from employment. Chapter 2 of the report provides a contextual review including:
• An up to date picture of family demography including the age structure, and the rates of fertility, marriage, divorce, teenage births and births outside marriage and the prevalence of lone parents.
• A comparison of employment patterns including the number of workers per household, the labour supply of married women and lone parents, and the level of unemployment.
• A comparison of average earnings, their dispersion, minimum wages and the ratio of male to female earnings.
Generally, the Anglophone and Nordic countries have higher divorce rates and high proportions of lone parents and births outside marriage. They also have a high proportion of mothers in employment and the dual worker couple household is the norm. This suggests that in these countries, the male breadwinner family has weakened and women are able to form separate households and be economically independent from men. However, the shift towards greater female economic independence is only partial; the gender wage gap is significant among the Anglophone countries and the minimum wage is relatively low in the USA, UK and Canada.
In contrast, the Southern European countries, the Netherlands, Japan and Ireland have low divorce rates and low proportions of lone parents and out of marriage births. They also have low proportions of mothers in employment and the one-earner couple family prevails; women are still relatively economically dependent upon men. Nevertheless, in Italy and Greece, the gender wage gap is small and in Portugal, Italy and the Netherlands, the minimum wage is comparatively high relative to mean and median earnings.
3
Tax benefit and cash benefits for children
Chapter 3 examines what, in most countries, are the most important parts of the child benefit package - tax benefits and cash benefits, income-related and non-income-related. Countries use different mixes of these mechanisms for delivering help to families and the value of that help varies by family type and size, the age of the child and by earnings level. Figure 2 summarises the value of tax benefits and cash benefits for a couple plus two children for one earner on half average male earnings. Figure 3 is for the same family type but for two earners on average male and half average female earnings.
Figure 2
Cash benefits and tax benefits for children: Couple plus two
aged 7 and 14. July 2001
4
Figure 3
Cash benefits and tax benefits for children: Couple plus two
aged 7 and 14. July 2001
Summary
The figures show which countries employ cash benefits and/or tax benefits and the combined value of these. The UK comes second only to the USA at the low -earnings level. At the higher earnings level the UK comes sixth, below Luxembourg, Austria, Belgium, Germany, France and the USA.
Housing costs
The majority of countries (all but six) have a demand side subsidy or housing benefit scheme that reduces the gross rent paid by low-income households and in the majority of these housing benefit schemes the amount of rent reduction is greater when there are children in the household. So housing benefits are an important component of the child benefit package and the impact of housing costs and local taxes and the extent to which they are mitigated by benefits are explored in Chapter 4 -despite the difficulties inevitable in making assumptions about housing costs. It can be seen in Figure 4 that housing benefit systems made a substantial contribution to reducing housing costs for a low-income couple with two children in Australia, Austria, Denmark, Finland, France, Germany, Norway and Sweden and they make a smaller contribution in Greece, the Netherlands and the USA. Local taxes were not an important element of the package. Housing benefit did not help families in the UK because even at this low level of earnings the family were above the housing benefit threshold.
5
Figure 4
Per cent gross rent paid by family type: one earner gross rent
1 Net childcare costs here are represented as positive amounts. Norway shows a negative childcare costs
because of benefits paid for a pre-school child.
Summary
Childcare
The study also took account of the impact of services including the costs of pre-school childcare in Chapter 5. In most of the countries in this study pre-school childcare policy currently focuses upon access for children over the age of three - a childcare guarantee for the under-threes is still the exception. This is the case to a lesser extent for low-income lone parents, as can be seen in Figure 51 which shows the net costs of pre-school childcare for a lone parent with one pre-school child at low and average earnings and for a couple who are both earning average earnings. For two-earner couples, the cost of childcare falls heavily upon the parents and more than wipes out the value of the child benefit package for some families in some countries. Countries use a variety of different methods for helping parents with the costs of pre-school childcare. Only Ireland, Israel and Spain have no subsidy of any kind towards these costs. The level of help depends on income in many countries. For the better off couple the highest levels of net childcare costs are found in the UK, Ireland, New Zealand, the Netherlands and the USA.
Out of school provision for children with working parents has not been a policy priority for most of the countries in this study. However, demand is high and countries are beginning to acknowledge this, especially for the younger age groups. In many countries fees are being reduced in much the same way as for pre-school childcare.
The costs of schooling (and the benefits) where they exist do not have a major impact on the child benefit package. However for some countries it is worth taking them into account.
6
Figure 5
Net costs of full-time children
Summary
Health care
In Chapter 6 we explore the costs of a standard package of health care. Most countries have either free health care for children or they mitigate charges at low earnings levels. There are only two countries in which health charges represent a substantial drain on the child benefit package - the USA and the Netherlands. In Australia, Canada and Ireland they represent a lesser, yet significant, drain on the child benefit package.
Maternity leave, paternity leave, parental leave and leave to
care for sick children
Chapter 7 compares the arrangements for maternity leave, paternity leave, parental leave and leave to care for sick children. Whilst this has not been included in the matrix, it is an important part of the child benefit package and is closely linked to childcare policy for the under threes. It is important to look at the whole package of leave policy in order to understand its impact upon families. Leave policies can be designed either 1) to facilitate gender equity by supporting women's work outside the home and the reconciliation of paid work and childcare by protecting the well-being of the child(ren) whilst the parents are in the workforce or 2) to support family work and childrearing and create an incentive for women to leave the labour force when children are very young (Kamerman, 2000). Germany and Japan both have long paid parental leave that can be taken after the child has entered school but no paternity leave. Whilst parental leave is designed for both parents, in the majority of countries fathers do not generally take advantage of this – in Germany, 1.6 per cent of parents on parental leave were fathers (Mikrozensus, 1999) and in Japan only 0.4 per cent of fathers actually took parental leave (Ministry of Health and Welfare, 1999). Israel has no separate paternity leave; it is partially shared with the mother's maternity leave and only mothers are entitled to parental leave. In these countries, leave is in effect designed not to involve the father in family responsibility and instead to enable women to break completely with the labour force during child rearing. On the other hand, in countries such as Sweden and Denmark leave is relatively short and there exists a 'daddy quota'. In these countries, leave is designed to support the reconciliation of paid work and childcare by
7
protecting the wellbeing of the child. In countries such as the UK and the US, the state does not take a large role in balancing family and paid work. Although leave policy is improving in the UK and statutory parental leave now exists, parental leave is unpaid and, as yet, no paternity leave exists. The wellbeing of the child whilst the parents are in the workforce is, in these countries, still largely left to negotiation between employer and worker.
Social assistance
Chapter 8 compares the level of social assistance paid in our 22 countries and also explores the implied equivalence scales. We have found that there is considerable variation between countries in what they consider to be the appropriate level of their social assistance benefits and also in how they evaluate the relative needs of families of different sizes and types. It can be seen from Figure 6 that after housing costs and services the overall level of the social assistance package is highest for lone parents with one child in Ireland, Denmark, Norway, Austria and the UK and lowest in Portugal and Spain. For couples with three children it is highest in Luxembourg, Austria and Sweden and lowest in Spain and Italy.
Figure 6
Social assistance
Figure 7 compares the implied equivalence scales2 for these two family types and shows that for the lone parent with one child it is highest in Canada, Israel and Ireland and lowest in Italy and Portugal and for the couple with three children it is highest in Canada, Portugal and the USA and lowest in the Netherlands and Italy. For both family types the UK comes towards the middle of the distribution.
Summary
8
Figure 7
Social assistance implied equivalence
The structure and level of the child benefit package
In Chapter 9 we compare the structure and level of the child benefit package overall. In our previous study based on the situation in 1992, the main vehicle for delivering the child benefit package was non-income-related child benefits. At that time the contribution of income-related child benefits had grown in importance, but child tax benefits had diminished in importance, and were being employed by fewer countries – perhaps because they tended to be of most benefit to better off families in the countries that had them.
In this study (which includes more countries) non-income-related child benefit is still the most popular vehicle for delivering the child benefit package. Only seven countries do not have any non-income-related child benefits – Canada and Germany have abandoned theirs, and the Australian scheme which was effectively universal is no longer so except for lone parents. In addition to these New Zealand, Portugal, Spain and the USA lack a non-income-related child benefit.
One country, the UK, has abandoned its income-related child benefit and now 13 countries have income-related child benefits or social assistance for employed families.
The main shift has been towards using the income tax system to distribute resources to families with children. The Anglophone countries have all introduced or developed tax credits for children. For low-income families they are now an important element of the package. Out of all the countries, only Austria, Denmark, Finland, Ireland, Israel, Norway, Portugal and Sweden have no recognition of the needs of children in their income tax arrangements.
Housing benefits are an important component of the package at low-income levels in some countries. Education costs and health costs in most countries reduce the value of the package but only by modest amounts. As long as childcare costs are not involved, the child benefit package is a positive contribution to family incomes in most countries. Figure 1.8 presents a summary of the structure of the package for a couple with two school age children with one earner on average male earnings.
Summary
9
Figure 8
Structure of the child benefit package
However this is for just one family and the most important conclusion of the comparisons of the levels of the child benefit package is that they vary within and between countries by family size and type, by earnings and by whether the comparison is made of the tax and cash benefit system only or after housing and service costs and benefits. This is illustrated for selective cases in Figures 9 to 11. Figure 9 shows how the package varies by family size. France for example comes well down the league table in its child benefit for small families but is much more generous to families with three or more children. The UK in contrast is unusual in having a package that benefits one-child families relatively more generously.
10
Figure 9
Child benefit package by number of children.
Chidless couple=100
Figure 10 takes a standard family and shows how the child benefit package varies by earnings. The Anglophone countries have considerably larger packages for low-earning families, a number of countries have a standard amount regardless of earnings and France, Greece and Japan have packages that increase with earnings.
Figure 10
Child benefit package by earnings
Summary
11
Figure 11 shows how the package varies by family type. Luxembourg for example has the most generous child benefit package for couples with children at all family sizes and regardless of earnings but it does not have the most generous package for lone parents. Some countries are neutral to lone parents, including the UK, others favour lone parents over couples - Austria is most generous to lone parents and most of the Nordic countries are also. Others favour couples over lone parents including the continental EU countries, with the exception of the Netherlands.
Figure 11
Child benefit package by family type at average earnings
Overall, compared with other countries, the UK does comparatively well for small, low-earning families, lone parents not requiring childcare and families on social assistance. With regards to families on average earnings and dual earner families, the UK is ranked somewhere in the middle. The implications of these variations is that it is unsafe to take one or a few standard families to represent a country’s child benefit package.
Replacement rates3 and marginal tax rates4
The data on the tax benefit package for families in work and on social assistance is used in Chapter 10 to estimate replacement rates and marginal tax rates. Some countries have very high replacement rates and they do not tend to be the countries that are most anxious about incentives to work. It can be seen in Figure 12 that Australia, the UK, the USA and Canada have comparatively low replacement rates for couples. They are higher for lone parents who need childcare in Canada, Ireland New Zealand. However there are countries like Austria, Denmark, the Netherlands and Japan who are managing with very high replacement rates.
Summary
3 Here the proportion of net in-work income that would be "replaced" by social assistance.
4 The proportion of extra earnings that would be foregone in extra direct taxes, loss of income-related
12
Figure 12
Replacement rates at half average earnings
The countries which are most anxious about the impact of work incentives on labour supply do have comparatively high marginal tax rates at the lower end of the earnings distribution. This is because they rely more than other countries on income-related benefits and tax credits which are withdrawn as earnings increase. The loss of childcare benefits is a particular cause of high marginal tax rates for lone parents as can be seen in Figure 13.
Figure 13
Marginal tax rates on moving from half average earnings
to average earnings
13
Conclusion
Given the finding that there is considerable variation in the child benefit package by family type, number of children, level of earnings and whether the comparison is made before or after housing costs, and the costs and benefits of services, it was not easy to produce an overall comparison of the level of the child benefit package. In Chapter 11 a number of comparisons are presented using different permutations of families and the preferred ranking has been presented in Figure 1.
From this ranking we devised the following groupings of countries:
Leaders: Austria, Luxembourg, Finland.
Second rank: France, Sweden, Germany, UK, Belgium, Denmark Norway, Australia.
Third rank: Ireland, Israel, Canada, USA and Italy.
Laggards: New Zealand, Portugal, Spain, Japan, the Netherlands, and Greece.
The countries with the most generous overall child benefit package are not those countries which employ a substantial element of targeting, either through tax credits, or income-related benefits. They are the countries that deliver most, if not all of their value as a non-income-related child benefit.
The rankings that have been obtained bear little relationship to the rankings that would be inferred using Esping-Anderson’s (1991) regime types. The social democratic (Nordic) welfare states tend to come in the top half of the table but they are not the leaders and Denmark and Norway are well down the rankings. The liberal (Anglophone) welfare states are distributed throughout the rankings with the UK and Australia in the second rank. New Zealand is consistently towards the bottom of the rankings. The conservative (corporatist) countries tend to be found in the upper half of the table but the Netherlands is a big exception. Austria is something of an outlier with a considerably more generous child benefit package than any other country after housing costs and services. The southern EU countries are in the bottom half of the table but spread, with Italy somewhat above the others. Japan, our only representative of the Pacific Rim/Confucian model, is found towards the bottom.
We then undertook analysis which sought to explain the variation in the rankings. There is scope for further work on the association between the child benefit package and the characteristics of countries – both their inputs and their outcomes. There may also be potential for some multivariate analysis, though the number of countries is a constraint on this. It appears that it is not the level of the wealth of a nation, nor the character of its labour market, nor the level of earnings but rather its social expenditure and especially the share of its social expenditure going to families, as against the elderly, that determines the child benefit package. The level of the child benefit package achieved is also associated with success in reducing market-generated levels of child poverty and it is possibly also associated with higher fertility rates. Those countries that make most effort to transfer resources horizontally have the most generous child benefit packages. Nations make choices. The policies that they choose have an impact on the financial burdens born by parents raising children.
15
1 Introduction and methods
1.1
Background
Every industrial country has a package of tax benefits, cash benefits, exemptions from charges, subsidies and services in kind which assist parents with the costs of raising children. We know from previous work (see below) that the structure and level of the package varies between countries according to the income, type of family, number and ages of children, labour market status and by whether the comparison is made before or after childcare costs and housing costs. In the Social Policy Research Unit at the University of York we have undertaken a number of comparative studies of the structure and value of this package. The first was carried out by Bradshaw and Piachaud (1980) comparing the UK with the then nine countries of the European Community. This study was replicated and extended to 15 countries for the Department of Social Security in 1992 and published by them (Bradshaw et al., 1993). The most recent data is for 1996 and was collected for the European Union as part of the work of the European Observatory on National Family Policies (Ditch et al., 1995, 1996, 1998). Thus there has been no comparison of these policies since the election of the Labour Government in Britain in 1997.5 Since then the ending of child poverty has become a major government priority in the UK and a host of changes have been made to the level and structure of the package - including the introduction of Working Families’ Tax Credit, Childcare Tax Credit, real improvements in Child Benefit and Income Support for families with children and the Child Tax Credit (not yet in place). So how does the UK compare now? There are no existing sources of data on child benefit packages that provide what is needed to answer that question. This study is an attempt to answer that question as at July 2001.
This is a study of the child benefit package in 22 countries. The rationale for the choice of countries was that we wanted to include all our EU partners, then we added industrialised countries known to have a child benefit package and where we knew there were good national informants - Norway, USA, Canada, Japan, Australia and New Zealand. Israel was added because the national informant heard about the study and volunteered to provide the data. It would have been interesting to have included candidate EU countries and former Eastern bloc countries but resource constraints did not make that possible. We did not consider welfare state 'regimes' in determining which countries to include but the countries included cover the whole range of regimes types commonly described.
5 The Norwegian Research Council funded a comparison on policies for lone parents covering six countries
in 1999 (Norway, Sweden, Denmark, Australia, New Zealand and the UK) (Bradshaw, Terum and Skevik, 2000). DSS funded two comparative studies of housing benefits (Kemp, 1997; Ditch et al., 2001)
16
1.2
Objectives
The objectives of this research are:
1 To collect details of the components of the child benefit package in the EU countries, Norway, the USA, Canada, Japan, Australia, New Zealand and Israel.
2 To compare the structure of the package - including the contribution of tax benefits, income-related and non-income-income-related child benefits, housing benefits, childcare subsidies, health and education charges, social assistance and child support.
3 To compare the level of the package in terms of purchasing power parity and how the level varies with the number of children, the ages of children, family type, the employment status of parent(s), earnings, and housing costs.
4 To explore how the UK is doing now compared to other countries - in relation to structure, level, replacement ratios and marginal tax rates.
5 To seek to explain what factors influence variations in the child benefit package and what the outcomes of those variations are.
6 To learn lessons from abroad.
1.3
Policy interest
This study was funded as one of the first round of grants made by the HM Treasury (HMT) Evidence Based Policy Fund. One of the criteria for this funding was that the project was sponsored by another government department and matching funding was provided by the Department for Work and Pensions (DWP) on the grounds that child poverty is also their policy responsibility.6 Inland Revenue, now responsible for all the family tax credits and Child Benefit, also have an interest in this policy area as do the Department of Health (especially on Health Costs) and the Department for Education and Science (especially on Education Costs).
Why might they and others be interested in comparisons of child benefit packages? There are a variety of motives that come to mind.
• For national governments there is often the motive that they want to either: - learn lessons from abroad and/or
- compare how they are doing.
• For international bodies there is the question of whether and to what extent policies are converging or diverging to meet, for example, EU social inclusion objectives.
• For the academic community the motives range from the testing of hypotheses about the nature of welfare states, the drivers of welfare state effort, convergence theory, the impact of globalisation, the nature of policy borrowing, and other common preoccupations in the comparative literature.
6 DWP and HMT both have a Public Service Agreement target to reduce the number of children living in
low-income households by at least a quarter by 2004.
17
Then there is the general concern of commentators (see for example Esping-Anderson et al., 2001) that over the last 30 years or so industrial welfare states have restructured their efforts in favour of older people to the relative neglect of families with children. Associated with this, and perhaps most importantly of all, there is the hypothesis that the decline in fertility experienced by all industrial countries in the last three decades is somehow associated with the failure of the welfare states to share sufficiently with parents in the costs of child rearing. Certainly this is an issue of special concern in Japan, Italy and Spain. The generosity of the child benefit package is certainly not the only factor to influence fertility, nor perhaps the most important. But, as we argue in Chapter 11, on theoretical grounds it may be one factor.
1.4
Methods
There are broadly five ways in which to compare tax/benefit packages for families with children:
• International data bases.
• Micro-simulation models.
• Outcome studies.
• Analysis of National Accounts.
• Model family methods.
Each of the first four methods is discussed in Appendix 1.1 but in this study we will be using model family methods.
1.5
Model family method
The model family method is an attempt to make comparisons of the tax/benefit package controlling for some of the variation that exists. It has, as a premium, the aspiration to compare like with like. A number of studies using this method have been carried out at the University of York (Bradshaw et al., 1993; Eardley et al., 1996; Bradshaw et al., 1996; Kilkey, 2001; Ditch et al., 1995, 1996, 1998; Kemp, 1997) but we do not claim to have pioneered this method in comparative research. The OECD has been using the method for many years in its series now called Taxing Wages (OECD 2001a). The latest edition covers the situation in 1999. This collects information on the treatment of standard families7 by the tax/benefit system. Data is also collected by OECD on short-term unemployment benefits and on social assistance and used to derive replacement rates (see OECD, 1998). Although this report uses similar methods to OECD, it is more up-to-date and covers a wider range of family types, income levels and elements of the child benefit package.
In an effort to make comparisons between countries' benefit systems and to ensure that as far as possible like is being compared with like, national informants complete a set of matrices (see Appendix A.1 for an example of a matrix).
7 Their analysis covers a childless single person on two-thirds, average and one-and-two-thirds average
earnings; a lone parent at two-thirds average earnings; a childless couple at average and a third average and couples plus two children on average, average and a third average and average and two-thirds average earnings.
18
1.5.1
Income cases
There are eight sheets for each country representing different INCOME CASES as follows:
• Case1: One earner working 16 hours per week (64 hours per month) for the minimum wage in each country8.
• Case 2: One earner, half national average male earnings or the minimum wage (for a 35 hour week) if higher.
• Case 3: One earner, half national average female earnings or the minimum wage (for a 35 hour week) if higher.
• Case 4: One earner, average male earnings.
• Case 5: One earner, average female earnings.
• Case 6: Two earners, average male earnings and half average female earnings (or the minimum wage for a 35 hour week if higher).
• Case 7: Two earners, one on average male earnings and one on average female earnings.
• Case 8: No earners - receiving social assistance.
These choices are designed to cover a range of earning types and levels in each country. The cases cover average (and proportions of average) male and female earnings. It was decided not to take a 'rich' case in this study because the child benefit package is arguably of less importance at such a level of earnings. Case 7 represents the top end of the earnings distribution in this study.
1.5.2
Family types
On each sheet there are columns for different FAMILY TYPES as follows:
• Single (all adults assumed 35 years old).
• Couple (assume married).
• Lone parent (assume divorced) plus one child (aged 2 years and 11 months) receiving full-time, formal, not in school childcare of the most common form in the country. No childcare in the social assistance case.
• Lone parent plus one child (aged 7) at school, no childcare.
• Lone parent plus two children (aged 7 and 14) at school.
• Couple plus one child (aged 2 years and 11 months) receiving full-time, formal, not in school childcare of the most common form in the country. No childcare if there is a non-working spouse or in the social assistance case.
• Couple plus one child (aged 7) at school, no childcare.
• Couple plus two children (aged 7 and 14) at school.
• Couple plus three children (aged 7, 14 and 17) all at school.
8 In the UK tax/benefit system those working 16 hours or more are deemed to be in employment and
covered by in-work tax/benefits. Those working less than 16 hours are entitled to out-of-work benefits. Therefore 16 hours was chosen for Case 1. Also, some countries do not have a minimum wage and therefore 14 per cent of the national wage was assumed.
19
The data is collected on childless singles and couples so that we can calculate how much more (and in some countries less) lone parents and couples with children receive as a result of the tax benefit package. Data is collected on school age and pre-school age children to assess the costs of pre-school childcare. The 17 year old represents a child staying on at school after school leaving age. The number of children ranges from one child to three children. This represents the most common family types in most countries.
1.5.3
Child benefit package
There are 14 rows to each matrix with a row to record:
• gross earnings;
• income tax payable;
• employee social security contributions;
• income-related child benefit;
• non-means-tested child benefit;
• gross housing costs;
• net housing costs;
• gross local taxes;
• net local taxes;
• net childcare costs;
• health charges/benefits;
• education charges/benefits;
• guaranteed child support, and
• other.
The national informants completed the matrix according to a set of instructions, which included specification of the earnings levels, the size and type of dwellings, location in each country, type of childcare, standard packages of health and education and other instructions.
Housing costs
Housing costs vary with tenure, the age, size and location of the dwelling and with what supply side ('bricks and mortar') subsidies are available. In our early matrix method studies we asked national informants to provide a typical rent for the most prevalent form of rented accommodation in a given place for a dwelling of a given size. This produced widely varying housing costs - from a rent controlled private flat in Barcelona, Spain to an apartment in New York. The rents varied with household size but not income. In this study we decided to adopt the OECD method of taking rent as 20 per cent of average earnings. Thus gross rent does not vary with the size of the dwelling or income but is a consistent proportion of earnings in each country. Basically the problem of housing costs is not resolvable - any solution is arguably the least bad. The problem is that housing subsidies are an important part of the child benefit package. A number of countries move up or down the league table on the basis of whether their package is assessed before or after housing costs. Housing is discussed further in Chapter 4.
20
Net childcare costs
This is the charge that typically has to be paid for full-time formal childcare of the most common form in each country. Informants are asked to deduct any direct subsidy or allowance that a family would receive towards these costs. More detail is given in Chapter 5.
School costs
It is assumed that the seven old child is attending a public primary school and the 14 and 17 year-olds are attending a state secondary school. We assume that the children can walk to school so there are no transport costs. Occasional small voluntary contributions to school funds or charges for outings (such as going to a museum) are ignored. Only fees or costs that parents must pay for books or equipment are included. We assume that the parents have to pay for a midday meal at school or provide a packed lunch. The cash equivalent value of any free school meals is treated as a benefit. For the 17 year old any benefit payable to keep children on at school after statutory school leaving age is included. More details are given in Chapter 5.
Health costs
The baseline assumption is that health care is free at the point of demand and funded by tax and/or social security contributions. Included in the matrix are only health insurance premiums that are required to match this assumption and any costs that families have to pay for a standard package of health care. As far as charges are concerned we asked the informants to assume:
• no inpatient episodes;
• each member of the family visits the dentist for a check-up twice per year and has a cavity filled on one of these visits;
• each member of the family visits the general practitioner once per year and receives a prescription for a standard antibiotic.
The estimate of health costs is the charges payable after any rebates or deductions or refunds. More detail is given in Chapter 6.
Child support
This is only included (for the lone parent) if it is guaranteed i.e. underwritten by the state and paid regardless of whether the non-resident parent pays.
Other
Other is for items that are not included above. If social assistance is paid to low earners in employment it is inserted here.
1.5.4
Problems with the model family method
There is room to argue about these choices. They are designed to ensure that like is being compared with like but they inevitably mean that the model families are illustrative rather than representative. In each country the child benefit package has unique features but a decision has to be made for all countries and the type of decision made is inevitably driven by the interest of the funding country - in this case the UK. The health costs assumptions are perhaps particularly informed by the existence of the National Health Service in the UK, free at the point of demand. For other countries the
Introduction and methods
21
assumptions do present problems. Take for example Japan which is the most problematic of all for fitting into these assumptions (Tokoro, 2000):
• No other country spends as much as Japanese families do on after school schooling for their children. This private expenditure is very prevalent and reduces the living standards of Japanese families by an average of about £100 per child per month.
• In addition, Japan has a seniority wage system. Wages rise with experience and how long a person works for the company. Under the job for life arrangements and because of the tendency for people to work for the same employers, employee earnings in Japan effectively increase with age - perhaps more than in any other country. In other countries earnings rise with seniority or experience but not with age. A line worker in a Toyota plant in Japan will see his earnings rise with his length of service but this is not the case in the same factory in the UK.
• Earnings are also adjusted by employers after marriage and also often for the burdens of children. Thus there is a parallel child benefit package provided by the private sector, which certainly does not exist to the same extent in any other country.
• However companies also make contributions to other costs in Japan - many employers pay the whole of their employees’ commuting costs as well as a contribution to their housing costs. These hidden earnings subsidies are substantial.
• Further, in estimating earnings, we certainly need to (and do) take account of the very common system of bonuses paid commonly twice/three times a year and typically representing the equivalent of four months’ additional salary.
• Then in Japan there are big differences between the average earnings of men and women. These occur because of the highly segregated labour market for men and women not because of unequal pay for equal work.
• Finally, there are questions to be asked about the social assistance case in Japan. As in some other countries, social assistance is administered by welfare services, and although there are national scales of benefit, it is a highly stigmatised system and probably not taken up by many of those entitled to it, who prefer to rely on family help.
These are some of the criticisms that can be made of the model family matrix method (for others see Eardley, 1996). In the end it is a technique for making comparisons of social policies easier - for comparing like with like. The cases chosen are not representative - they are illustrative. However in Chapter 11 we produce a selected and weighted version of the model families in an effort to better represent the actual population mix that might be found in practice. The model family method seeks to show how the tax benefit system should work given the national arrangements that exist, rather than necessarily how it does work.
1.6
Converting national currencies
National informants provided data on their child benefit packages in national currencies. In order to make comparisons between countries it is necessary to convert national currencies to a common amount. There are two approaches to this: first to convert money amounts to a common currency; or second to express amounts as a proportion of gross average earnings in each country.
The first approach provides an absolute comparison and the second approach a relative comparison. Most of the analysis in this report will be based on a comparison using £ sterling purchasing power