Improving the
c
Ant-Miner
PBClassification
Algorithm
Matthew Medland, Fernando E. B. Otero and Alex A. Freitas School of Computing, University of Kent, Canterbury, Kent, UK
{mm443,F.E.B.Otero,A.A.Freitas}@kent.ac.uk
Abstract. Ant Colony Optimisation (ACO) has been successfully ap-plied to the classification task of data mining in the form of Ant-Miner. A new extension of Ant-Miner, calledcAnt-MinerPB, uses the ACO pro-cedure in a different fashion. The main difference is that the search in cAnt-MinerPBis optimised to find the best list of rules, whereas in Ant-Miner the search is optimised to find the best individual rule at each step of the sequential covering, producing a list of best rules. We aim to improvecAnt-MinerPB in two ways, firstly by dynamically finding the rule quality function which is used while the rules are being pruned, and secondly improving the rule-list quality function which is used to guide the search. We have found that changing the rule quality function has lit-tle effect on the overall performance, but that by improving the rule-list quality function we can positively affect the discovered lists of rules.
1
Introduction
Data mining is the automatic search for useful, usable, and preferably interesting patterns in data [3, 13]. These patterns are used by anyone with an interest in what their data holds—e.g., businessmen or scientists. There are multiple data mining tasks, of which classification is the most studied.
The classification task seeks to create a model that places objects (exam-ples) into groups. A class value (group name) is then assigned by analysing common traits (attributes’ values) between objects of that class. Classification problems can therefore be viewed as optimisation problems, where the intended outcome is to find the best model that represents the predictive relationships in the data. There are many different ways to represent these models, such as ‘black-box’ models produced by support vector machines (SVM) and artificial neural networks, which are difficult to interpret, and ‘white-box’ decision tree and classification rule models, which are more readily interpreted [11]. ‘White-box’ methods have the advantage of being easier to comprehend, and so they are used to provide further understanding of the data. This enhanced understanding leads to a greater degree of trust in the models produced and enables decision makers to make the best possible decisions.
Ant Colony Optimization (ACO) algorithms have successfully been applied to the classification task in the form of Ant-Miner [2, 10]. Ant-Miner seeks to extract a list of classification rules of the formIF antecedent THEN consequent
from a data set, where the antecedent is composed by predictor attribute-value conditions, and the consequent corresponds to the class value to be predicted.
Several extensions of Ant-Miner have been proposed in the literature and have been reviewed in [8]. The majority of these extensions maintain the overall structure of the algorithm—i.e., the algorithm employs an ACO-based procedure to create individual rules which are joined to create a complete classification model (list of rules). This strategy to produce a list of classification rules is known as sequential covering (or separate-and-conquer), where each rule is discovered individually. An improved strategy has recently been proposed in the c Ant-MinerPB algorithm [9], where an ACO-based procedure is used not to construct
individual rules, but a full list of rules. One of the main differences between the cAnt-MinerPB and Ant-Miner algorithms is that in cAnt-MinerPB the search is
performed and optimised to find the best list of rules, whereas in Ant-Miner (and its extensions) the search is performed and optimised to find the best individual rule at each step of the sequential covering, resulting in the list of best rules. In other words, in cAnt-MinerPB the search is governed by the quality of a
candidate list of rules, while in Ant-Miner the search is guided by the quality of an individual rule.
One of the main components of Ant-Miner is the rule quality function used to guide the search. The use of different rule quality functions in sequential covering algorithms has been studied in [5, 7] and in Ant-Miner algorithm in [12]. Improving the rule quality function of sequential covering algorithms tends to improve the overall performance of the algorithm. Although the search in cAnt-MinerPB is guided by the quality of a list of rules, the algorithm uses a
rule quality function to prune (i.e., remove irrelevant terms) from a candidate rule. Therefore, there are two quality functions involved in the search for the best list of rules incAnt-MinerPB: the rule quality function used during pruning and
the rule-list quality function used to guide the search (i.e., update pheromones). In this paper we propose to improve the search of thecAnt-MinerPB
algo-rithm by (1) allowing the algoalgo-rithm to dynamically choose a rule quality evalu-ation function for a candidate rule and (2) using a new rule-list quality function to guide the search. The extension (1) is possible since the rule quality function has a smaller role in cAnt-MinerPB—it is only used during pruning—and it is
not used as a criterion to compare different rules. A dynamic rule quality func-tion selecfunc-tion would not be possible in Ant-Miner, as the rule quality funcfunc-tion needs to be consistent throughout to ensure that the algorithm is comparing like-to-like. The extension (2) aims at preventing overfitting—the case where the list of rules is too tailored to the training set and has poor generalisation performance. We evaluate the effect of these extensions using 14 data sets from the UCI Machine Learning repository [4] in terms of both predictive accuracy and size of the discovered classification model.
The remainder of this paper is organised as follows. In Section 2 we discuss the differences in the search strategy of Ant-Miner andcAnt-MinerPBalgorithms.
In Section 3 we discuss our proposed improvements tocAnt-MinerPB. Then we
2
Background
Separate-and-conquer, also known as sequential covering, classification algo-rithms are data mining algoalgo-rithms that employ two steps to create a classifi-cation model. First, the algorithm classifies part of the dataset (conquer) and then removes the classified data from the dataset (separate). This process is re-peated until the number of unclassified examples falls below a set threshold. At each stage, the data which is classified depends on the classification rule cho-sen, and which classification rule is chosen depends on the quality of possible rules. To calculate this, a rule quality function is used and it is this function which determines the success of most sequential covering algorithms. There are multiple aspects of a rule which can affect its quality. For example, a rule may never misclassify an example (high consistency) but only cover a small subset of examples (low coverage). Deciding which rule quality function to use always has the problem of finding an effective trade-off between consistency and coverage.
The Ant-Miner algorithm follows a sequential covering strategy using an ACO procedure to create individual rules. First, a construction graph is created where each node is a value for a given attribute, with every attribute-value pair from the data set represented. Each ant then moves from a start node (with an empty rule) and stochastically chooses a vertex with a probability based upon the pheromone value and a heuristic value. The visited vertex is a rule term as a [attribute, value] pair. The ant will continue to add new terms until either all attributes have been used or adding another would decrease the number of covered examples below a predefined threshold. After a rule has been created, a pruning algorithm removes irrelevant terms from the newly created rule. Once every ant in the colony has traversed the graph, the best rule based on a quality function is selected and the pheromone levels are adjusted. The pheromone on the terms included in the best rule increase and the pheromone on the others (unused terms) decrease. After a rule has been created by the ACO procedure, all of the examples which it covers are removed from the data set and the next rule is created. The algorithm finishes once the training set has less than a predefined number of training examples remaining and the list of best rules is returned as the discovered classification model. Most of the proposed extensions of Ant-Miner follow this same strategy to create a list of rules [8].
cAnt-MinerPB is an ACO classification algorithm that employs a different
search strategy than Ant-Miner. Rather than searching for the list of best rules as Ant-Miner does,cAnt-MinerPBinstead searches for the best list of rules. This
change may sound minor, but it has a dramatic effect on the algorithm. In Ant-Miner each ant creates an individual rule, whereas in cAnt-MinerPB each ant
creates an entire list of rules. Once the best candidate list of rules has been created, the pheromones are updated which affects the lists that will be created in the future iterations. The best list of rules chosen throughout the execution of the algorithm is returned as the discovered classification model.
The high-level pseudocode ofcAnt-MinerPBis presented in Figure 1. At each
iteration, an ant in the colony starts with an empty list and the full training set. An ant then creates a rule, prunes the rule using the rule quality function,
Input: training examples
Output: best discovered list of rules 1. InitialisePheromones();
2. listgb← {};
3. m←0;
4. whilem <maximum iterationsandnot stagnationdo 5. listib← {};
6. forn←1tocolony sizedo 7. examples←all training examples; 8. listn← {};
9. while|examples|>maximum uncovereddo 10. ComputeHeuristicInformation(examples); 11. rule ←CreateRule(examples);
12. P rune(rule);
13. examples←examples−Covered(rule, examples); 14. listn←listn+rule;
15. end while
16. if Quality(listn)> Quality(listib)then
17. listib←listn;
18. end if 19. end for
20. U pdateP heromones(listib);
21. if Quality(listib)> Quality(listgb)then
22. listgb←listib;
23. end if 24. m←m+ 1; 25. end while 26. return listgb;
Fig. 1: High-level pseudocode of the cAnt-MinerPB algorithm [9].
and removes all of the covered examples from the training set. The ant then repeats these steps until the number of remaining examples lies below a prede-fined threshold. It is important to note that at no point are rules compared to each other, and that the only time the rule quality function is used is during the pruning stage. The list of rules created by the ant is then compared to the current best list of rules and if it is better than the current best, it replaces it as the current best. Once all ants in the colony have finished creating candidate list of rules, the pheromones are updated. This entire process repeats until ei-ther the maximum number of iterations has been reached or until the algorithm converges.
There is a clear difference in the search strategy between Ant-Miner (and its extensions) and cAnt-MinerPB algorithms. The search in Ant-Miner is guided
by the quality of the individual rules, as in (traditional) sequential covering algorithms. The best rule found is always used, regardless of how it affects the list of rules. The search in cAnt-MinerPB algorithm, however, is not concerned
by the quality of the individual rules as long as the quality of the complete list of rules is improving, since the entire list is created at once and the best list is chosen to guide the search. Therefore, the rule quality function has a smaller role—only used to decide whether or not to prune a rule—and the rule-list quality function guides the search.
3
Proposed Improvements to
c
Ant-Miner
PBThis paper presents two extensions of the cAnt-MinerPB algorithm in order
to improve the search for the best list of rules. The first extension consists of allowing the algorithm to dynamically choose the rule quality function to be used during the pruning procedure (per rule fashion), where different rules can be pruned using different rule quality functions. As has been previously studied [5, 7, 12], rule quality functions have different bias and capture different aspects of the rule (e.g., some might favour consistency over coverage). The second extension consists of using a pessimistic error rate rule-list quality function to evaluate a candidate list of rules and, consequently, to guide the search.
3.1 Dynamically choosing rule evaluation functions
IncAnt-MinerPB, ants find routes through a fully connected graph of all possible
rule terms (attribute-value pairs) in order to construct rules. Our initial approach to dynamically choose the rule quality function was based around adding extra vertices to the construction graph containing the candidate rule terms to repre-sent the available rule quality functions, resulting in one large graph. This simple approach had the benefits that it was an easy concept to grasp and it fits very nicely intocAnt-MinerPB with very few modifications to the existing algorithm.
However, we have found that using this approach, the same rules can be created by the pruning procedure but with different rule quality functions. This affected the convergence of the algorithm, since the choices of the rule quality functions were not unique and, consequently, there was no selective pressure towards a particular rule quality function. This meant that the algorithm would rarely converge.
These results led us to realise that the convergence tests had to purely rely upon the terms selected to create the rules. To enable this behaviour, we used two separate construction graphs: one purely consisting of different rule quality functions, and the other consisting of rule terms. When creating a rule, an ant will first visit the rule quality functions graph to select an evaluation function, and then visit the rule terms graph to create the rule.
This process can be implemented adding only a few lines to the algorithm presented in Figure 1. The first addition would be the creation of a rule qual-ity functions graph and initialise its pheromones (line 1). Next, each ant would choose the rule quality function before creating a rule (line 11), and then store the rule quality for later use in the pruning stage (line 12). The selection of the rule quality function is only based on pheromone levels, no heuristic informa-tion is used. Once the iterainforma-tion-best list of rules has been determined, the two pheromone matrices would be updated (line 20) to reflect the chosen rule quality functions as well as the list of rule terms used in the list of rules.
Though the rule quality functions and rule terms graphs are independent, the pheromones in cAnt-MinerPB are retained in sequence. In other words, the
first rule being chosen in a list has a list of pheromones which is saved and updated across iterations, as does the second and so forth. This means that the
IF petal-width <= 0.8 THEN Iris-setosa USING F-measure function IF petal-width > 1.75 THEN Iris-virginica USING Error-based function IF sepal-length <= 6.15 THEN Iris-versicolor USING M-Estimate function IF <empty> THEN Iris-virginica
Fig. 2: An example of a list of rules with associated rule quality functions. The default rule (with an empty antecedent) does not have a function associated.
first rule is now converging to the list of terms, which was affected by the choice of the rule quality function, both of which may be vastly different to the terms and quality function used by the second rule. Convergence is only determined by analysing the rule terms graph, since different rule quality functions can lead to the same rule and the choice of the rule quality function does not affect the quality of the list of rules (as long as they produce the same rules). Figure 2 presents an example of a list of rules with associated rule quality functions.
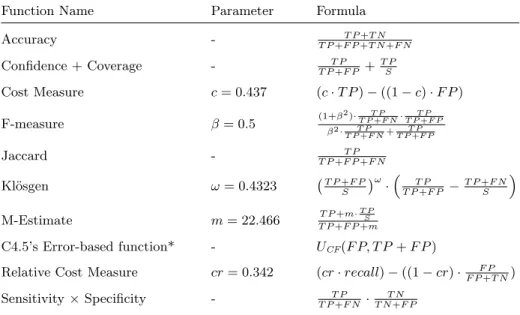
In order for our dynamic rule quality function selection process to be of any use we needed a wide selection of different rule quality functions. We have selected previously used rule quality functions described in [7, 12], as well as the original rule quality function used in cAnt-MinerPB (Sensitivity ×Specificity)
and a rule quality function based on C4.5’s error-based measure [11, p. 41]. The chosen functions can be found in Table 1. For the parametric quality functions, we have used their default parameter values [7] (shown in the ‘Parameter’ column in Table 1). In the function definitions we make use of a series of shorthands to condense the formulae. These are defined as below:
TP The number of examples covered by the rule that belong to the class pre-dicted by the rule (true positives).
FP The number of examples covered by the rule that do not belong to the class predicted by the rule (false positives).
TN The number of examples not covered by the rule that do not belong to the class predicted by the rule (true negatives).
FN The number of examples not covered by the rule that belong to the class predicted by the rule (false negatives).
S The total number of training examples (TP + FP + TN + FN).
3.2 Error-based Rule-List Function
After a candidate list of rules is created incAnt-MinerPB, its quality is measured
in terms of predictive accuracy in the training set. It is expected that a list of rules that perform well in the training set will also perform well in the test set (the set of unseen examples). However, the use of the predicted accuracy can lead to overfitting—the case where the list of rules created is too tailored to the training set and does not generalise well, i.e., it has a lower predictive accuracy
Table 1: The rule quality functions used in the dynamic selection process.
Function Name Parameter Formula
Accuracy - T P+F PT P++T NT N+F N Confidence + Coverage - T P T P+F P + T P S Cost Measure c= 0.437 (c·T P)−((1−c)·F P) F-measure β= 0.5 (1+β 2)· T P T P+F N·T PT P+F P β2· T P T P+F N+T PT P+F P Jaccard - T P T P+F P+F N Kl¨osgen ω= 0.4323 T P+F P S ω · T P T P+F P − T P+F N S M-Estimate m= 22.466 T P+m· T P S T P+F P+m C4.5’s Error-based function* - UCF(F P, T P+F P)
Relative Cost Measure cr= 0.342 (cr·recall)−((1−cr)· F P F P+T N)
Sensitivity×Specificity - T P
T P+F N · T N T N+F P
*The UCF function corresponds to the upper limit of the probability of an error (F P) over the
examples covered by a rule (T P+F P). More details can be found in [11, p. 41]
in the test set. In order to mitigate the possibility of overfitting, we propose the use of a function based on C4.5’s pessimistic error rate (UCF) to measure the
quality of a candidate list of rules, given by
1− L P r=1 (T Pr+F Pr)·UCF(F Pr, T Pr+F Pr) S , (1)
where F Pr andT Pr are the number of false positives and true positives of the
r-th rule, respectively, L is the number of rules in the candidate list and S is the number of training examples. According to (1), the quality of a list of rules corresponds to 1 minus the sum of the predicted errors (the number of examples classified by a rule times its associated UCF error rate [11, p. 41]) of the rules
divided by the number of examples in the training set—the lower the sum of predicted errors, the higher the quality of the list.
4
Results
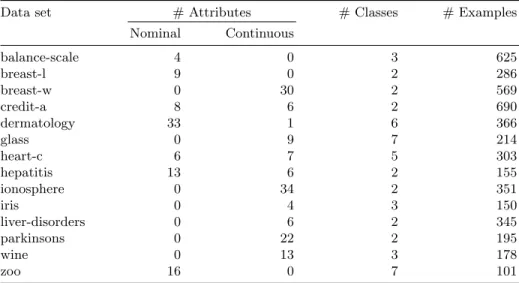
In order to evaluate the proposed extensions of thecAnt-MinerPBalgorithm, we
have selected 14 datasets from the UCI Machine Learning repository [4]. Table 2 presents a summary of the data sets used in our experiments. We have eval-uated four different variations ofcAnt-MinerPB: the originalcAnt-MinerPB; the
Table 2: Summary of the data sets used in the experiments.
Data set # Attributes # Classes # Examples
Nominal Continuous balance-scale 4 0 3 625 breast-l 9 0 2 286 breast-w 0 30 2 569 credit-a 8 6 2 690 dermatology 33 1 6 366 glass 0 9 7 214 heart-c 6 7 5 303 hepatitis 13 6 2 155 ionosphere 0 34 2 351 iris 0 4 3 150 liver-disorders 0 6 2 345 parkinsons 0 22 2 195 wine 0 13 3 178 zoo 16 0 7 101
cAnt-MinerPB with the proposed dynamic rule quality function selection
(de-noted with a ‘[D]’ marking); the cAnt-MinerPB with the proposed error-based
rule-list quality function (denoted with a ‘[E]’ marking); andcAnt-MinerPBwith
both dynamic rule quality function selection and error-based list quality func-tion (denoted with a ‘[D+E]’ marking). We carried out a tenfold cross-validafunc-tion procedure and thecAnt-MinerPB default parameters were used [9]:colony size
of 5,maximum number of iterations of 500 andevaporation factor of 0.90 (i.e., the evaporation rate is equal to 1−factor, therefore the pheromone values are decreased by 10% during evaporation). SincecAnt-MinerPBis a stochastic
algo-rithm, it was run 10 times for each of the cross-validation folds.
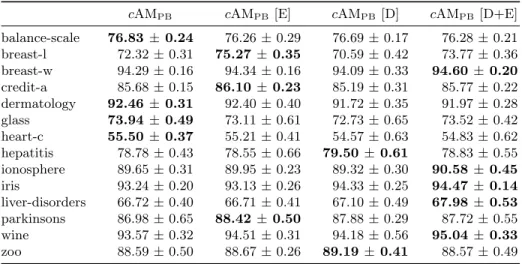
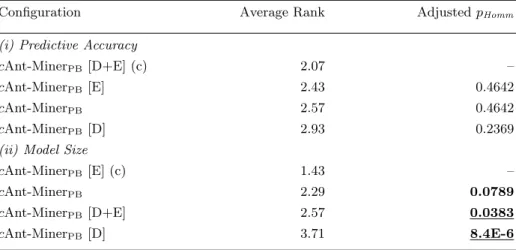
The results of our experiments are presented in Table 3, for predictive accu-racy, and Table 4, for the size of the discovered model (measured as the total number of terms in the list of rules). A value on those tables corresponds to the average value measured over the tenfold cross-validation. Table 5 presents the results of the non-parametric Friedman statistical test with the post-hoc Hommel’s test [1, 6]. The information presented in Table 5 corresponds to the average rank (first column), where the lower the rank the better the algorithm’s performance, and the adjustedpHomm value. Statistically significant differences
among the algorithm with the highest rank (the control ‘(c)’ algorithm) are de-termined by the pHomm value: if the p value is less than 0.1, the difference in
the rank is statistically significant at theα= 0.1 level; if thepvalue is less than 0.05, the difference in the rank is statistically significant at the α= 0.05 level.
The use of the dynamic rule quality function selection combined with the error-based rule-list quality function (cAnt-MinerPB [D+E]) led to an overall
improvement in predictive accuracy and achieved the highest average rank, al-though the differences are not statistically significant according to the Friedman
Table 3: Average predictive accuracy (average ±standard error) measured over tenfold cross-validation. The highest predictive accuracy for a given data set is shown in bold.
cAMPB cAMPB[E] cAMPB[D] cAMPB[D+E]
balance-scale 76.83 ±0.24 76.26±0.29 76.69 ±0.17 76.28±0.21 breast-l 72.32±0.31 75.27 ±0.35 70.59 ±0.42 73.77±0.36 breast-w 94.29±0.16 94.34±0.16 94.09 ±0.33 94.60± 0.20 credit-a 85.68±0.15 86.10 ±0.23 85.19 ±0.31 85.77±0.22 dermatology 92.46 ±0.31 92.40±0.40 91.72 ±0.35 91.97±0.28 glass 73.94 ±0.49 73.11±0.61 72.73 ±0.65 73.52±0.42 heart-c 55.50 ±0.37 55.21±0.41 54.57 ±0.63 54.83±0.62 hepatitis 78.78±0.43 78.55±0.66 79.50±0.61 78.83±0.55 ionosphere 89.65±0.31 89.95±0.23 89.32 ±0.30 90.58± 0.45 iris 93.24±0.20 93.13±0.26 94.33 ±0.25 94.47± 0.14 liver-disorders 66.72±0.40 66.71±0.41 67.10 ±0.49 67.98± 0.53 parkinsons 86.98±0.65 88.42 ±0.50 87.88 ±0.29 87.72±0.55 wine 93.57±0.32 94.51±0.31 94.18 ±0.56 95.04± 0.33 zoo 88.59±0.50 88.67±0.26 89.19±0.41 88.57±0.49
Table 4: Average number of terms (average ± standard error) measured over tenfold cross-validation. The lowest number of terms for a given data set is shown in bold.
cAMPB cAMPB[E] cAMPB [D] cAMPB[D+E]
balance-scale 12.64 ±0.03 12.66±0.05 15.45±0.16 14.32±0.13 breast-l 19.15±0.40 8.65 ±0.17 34.65±0.82 11.85±0.62 breast-w 8.55±0.12 8.03 ±0.19 11.90±0.21 9.50±0.28 credit-a 17.54±0.32 13.71 ±0.38 35.53±0.74 25.23±0.64 dermatology 44.47±0.63 43.93±0.63 42.39±0.66 41.89± 0.57 glass 10.73±0.14 9.99 ±0.15 13.24±0.25 12.61±0.22 heart-c 27.65±0.58 25.10 ±0.57 38.66±0.68 29.90±0.71 hepatitis 10.87±0.17 10.36 ±0.40 12.71±0.43 11.47±0.20 ionosphere 11.04±0.17 9.96 ±0.25 15.35±0.38 11.38±0.32 iris 4.92±0.08 4.17±0.13 5.04±0.11 4.13± 0.05 liver-disorders 11.78±0.08 11.49 ±0.12 29.66±0.30 23.70±0.50 parkinsons 7.02±0.11 5.96 ±0.08 7.94±0.15 7.00±0.15 wine 4.75±0.08 3.83 ±0.07 5.66±0.14 4.42±0.07 zoo 6.70 ±0.09 7.12±0.10 6.97±0.10 7.41±0.19
Table 5: Statistical test results according to the non-parametric Friedman test with the Hommel’s post-hoc test. Statistically significant differences at the α = 0.1 level are tabulated in bold and differences at the α = 0.05 level are underlined.
Configuration Average Rank AdjustedpHomm
(i) Predictive Accuracy
cAnt-MinerPB[D+E] (c) 2.07 –
cAnt-MinerPB[E] 2.43 0.4642
cAnt-MinerPB 2.57 0.4642
cAnt-MinerPB[D] 2.93 0.2369
(ii) Model Size
cAnt-MinerPB[E] (c) 1.43 –
cAnt-MinerPB 2.29 0.0789
cAnt-MinerPB[D+E] 2.57 0.0383
cAnt-MinerPB[D] 3.71 8.4E-6
test. The use of the error-based rule-list quality (cAnt-MinerPB [E]) had a
simi-lar predictive accuracy to the originalcAnt-MinerPB, achieving a similar average
rank. The use of the dynamic rule quality function (cAnt-MinerPB [D]) has not
led to an improvement in predictive accuracy, achieving the lowest average rank. In terms of the discovered model size, the use of the error-based rule-list qual-ity (cAnt-MinerPB [E]) led to a statistically significant improvement in the size
of the discovered lists, reducing the average number of terms in the lists. The use of the dynamic rule quality function selection (cAnt-MinerPB [D] andc
Ant-MinerPB [D+E]) resulted in longer lists and achieved the lowest rank.
The error-based rule-list function has shown significant improvement in terms of the size of the discovered lists of rules, without a drop in accuracy. This is a very useful finding as the cAnt-MinerPB algorithm suffered from increased
list size, which now can be avoiding by the use of the new error-based rule-list function. The dynamic rule quality function selection, however, has shown no significant gain in accuracy while performing much worse in terms of size.
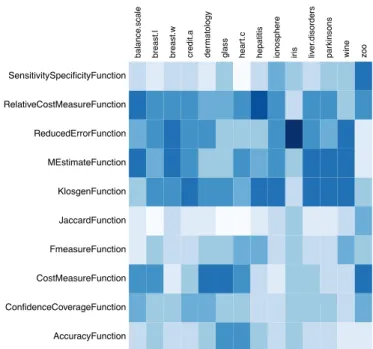
During the experiments using the dynamic rule quality function selection we monitored which rule quality functions were being chosen. The frequency of each rule quality function being chosen per dataset can be found in Figure 3. The top image (Figure 3a) shows the results when using the dynamic search alongside the traditional predictive accuracy rule-list function, whereas the bottom image (Figure 3b) shows the results when the proposed error-based rule-list function was used. In Figure 3a, it appears that four rule quality functions were being used more often quite consistently, except in the case of the zoo dataset, suggesting that the use of these functions can lead to improvements in the accuracy during
bala
nce
.scale
breast.l breast.w credit.a der
matol ogy glass hear t.c hepatitis iono sphere iris liver .di sorders par kin sons wine zoo AccuracyFunction ConfidenceCoverageFunction CostMeasureFunction FmeasureFunction JaccardFunction KlosgenFunction MEstimateFunction ReducedErrorFunction RelativeCostMeasureFunction SensitivitySpecificityFunction
(a) Using the predictive accuracy rule-list function.
bala
nce
.scale
breast.l breast.w credit.a der
matol ogy glass hear t.c hepatitis iono sphere iris liver .di sorders par kin sons wine zoo AccuracyFunction ConfidenceCoverageFunction CostMeasureFunction FmeasureFunction JaccardFunction KlosgenFunction MEstimateFunction ReducedErrorFunction RelativeCostMeasureFunction SensitivitySpecificityFunction
(b) Using the error-based rule-list function.
Fig. 3: Heatmaps showing the frequency at which different rule quality functions were chosen per dataset—the darker the colour the more often the rule quality function was used.
training and potentially overfitting. In Figure 3b, however, the pattern is much less clear and no rule quality function stands out.
5
Conclusion
We have found that the error-based rule-list evaluation function produces a sta-tistically significant improvement in terms of the size of the discovered lists, and that there is no detriment to the predictive accuracy. Our second finding was that the dynamic selection of rule quality functions did not yield any improve-ments. This leads us to believe that the characteristics of an individual rule quality function have little effect on the final quality of the discovered lists, and that any sensible rule quality function can be used.
We have shown that the dynamic selection of rule quality function (used purely for pruning) has little effect on the quality of the lists, therefore as a future research direction, it may be interesting to investigate the use of different pruning strategies within cAnt-MinerPB that are not necessary dependent on
the rule quality and more related to the quality of a list of rules.
References
1. Demˇsar, J.: Statistical Comparisons of Classifiers over Multiple Data Sets. JMLR 7, 1–30 (2006)
2. Dorigo, M., St¨uzle, T.: Ant Colony Optimization. The MIT Press (2004)
3. Fayyad, U., Piatetsky-Shapiro, G., Smith, P.: From data mining to knowledge discovery: an overview. In: Advances in Knowledge Discovery & Data Mining. pp. 1–34. MIT Press (1996)
4. Frank, A., Asuncion, A.: UCI Machine Learning Repository (2010), http://archive.ics.uci.edu/ml
5. F¨urnkranz, J., Flach, P.: ROC ‘n’ Rule Learning—Towards a Better Understanding of Covering Algorithms. Machine Learning 58, 39–77 (2005)
6. Garc´ıa, S., Herrera, F.: An Extension on ‘Statistical Comparisons of Classifiers over Multiple Data Sets’ for all Pairwise Comparisons. JMLR 9, 2677–2694 (2008) 7. Janssen, F., F¨urnkranz, J.: On the quest for optimal rule learning heuristics.
Ma-chine Learning 78, 343–379 (2010)
8. Martens, D., Baesens, B., Fawcett, T.: Editorial survey: swarm intelligence for data mining. Machine Learning 82, 1–42 (2011)
9. Otero, F., Freitas, A., Johnson, C.: A New Sequential Covering Strategy for Induc-ing Classification Rules with Ant Colony Algorithms. To appear in IEEE Trans. on Evolutionary Computation (2012)
10. Parpinelli, R., Lopes, H., Freitas, A.: Data Mining with an Ant Colony Optimiza-tion Algorithm. IEEE Trans. on EvoluOptimiza-tionary ComputaOptimiza-tion 6(4), 321–332 (2002) 11. Quinlan, J.R.: C4.5: Programs for Machine Learning. Morgan Kaufmann
Publish-ers Inc., San Francisco, CA, USA (1993)
12. Salama, K., Abdelbar, A.: Exploring Different Rule Quality Evaluation Functions in ACO-based Classification Algorithms. In: IEEE Symposium on Swarm Intelli-gence (SIS). pp. 1–8 (2011)
13. Witten, I., Frank, E., Hall, M.: Data Mining: Practical Machine Learning Tools and Techniques. Morgan Kaufmann, 3rd edn. (2011)
![Fig. 1: High-level pseudocode of the cAnt-Miner PB algorithm [9].](https://thumb-us.123doks.com/thumbv2/123dok_us/764686.2596732/4.918.203.713.168.565/fig-high-level-pseudocode-miner-pb-algorithm.webp)