©Universiti Malaysia Pahang
INFLUENCE OF WET-BULB GLOBE TEMPERATURE (WBGT) TOWARDS WORKERS’ PERFORMANCE: AN ANOVA ANALYSIS
A. R. Ismail1, M. H. M. Haniff2and B. M. Deros2 1Faculty of Mechanical Engineering, Universiti Malaysia Pahang,
22600 Pekan, Pahang, Malaysia Phone: +609-4242268, Fax: +609-4242202
Email: [email protected] 2
Department of Mechanical and Materials Engineering Faculty of Engineering and Built Environment
Universiti Kebangsaan Malaysia, 43600 UKM Bangi, Selangor, Malaysia
ABSTRACT
The aim of the study was to determine the effects Web-Bulb Globe Temperature (WBGT) on the operators’ performance at Malaysian automotive industry. One automotive assembly factory had been chosen as a subject for the study. The subjects were workers at the assembly section of the factory. The environment examined was the WBGT of the surrounding workstation area. One set of representative data, which is the WBGT (°C) and production rate were collected during the study. The production rate data were collected through experimental procedure by executing the motion and time study. Meanwhile the WBGT was measured using Quest Thermal Environment Monitor equiptment. The correlation and linear regression analysis were conducted in order to obtain the relationship between the effects of WBGT to the worker performance. The results from the correlation analysis revealed there is a weak negative relationship between the WBGT and productivity of the workers. The linear regression analysis further reveals that there is a linear equation model with negative slope to describe the relationship of WBGT and workers performance for the assembly section involved. The linear regression line obtained is Y = -13.3X + 425.
.
Keywords:WBGT, worker performance, ANOVA analysis
INTRODUCTION
Environmental ergonomics is concerned with how they interact with the environment from the perspective of ergonomics (Parsons, 2000). Ergonomics or human factors is the scientific discipline concerned with understanding of the interactions among humans and other elements of a system, and the profession that applies theory, principles, data and methods to design, in order to optimize human well-being and overall system performance (Dul and Weerdmeester, 2001). It also can be defined as the application of knowledge of human characteristics to the design of systems and people in systems operate within an environment (Parsons, 2000). Ergonomics, the applied science of equipment design intended to reduce operator fatigue or discomfort, has become an indispensable area of knowledge for today’s facility managers. As a result of the US Occupational Safety and Health Administration (OSHA) proposed ergonomic compliance program since 1999, facility managers in nearly every industry have to
ensure programs were in place in order to prevent complaints by employees (Roper and Yeh, 2007).
Numerous studies have found that human performance and productivity depend on the thermal environment (Srivanin and Mohamed, 2003). Humans can attempt to maintain their internal (core) temperature within an optimum range around 37ºC and if the body is subjected to thermal stress the thermoregulatory system responds by changing its state in a way which is consistent with maintaining core temperature within this range (Parsons, 2000). Wijewadane and Jayasinghe (2008) had conducted the study of thermal comfort temperature range for factory workers in warm humid tropical climates. The results from this study showed that the ability to operate factory buildings as free running will be very useful in the context of saving energy needed from providing adequate thermal comfort for workers in warm humid tropical climatic conditions. Morioka et al. (2005) conducted an occupational health study on workers exposed to cold environment in a cold storage warehouse. The results of the study revealed that the longer time spent inside the warehouse, the greater the change in blood pressure meanwhile the sublingual temperature significantly decreased at the end of the work shift and the effects of the work were greater in winter than in summer.
Hummelgaard et al. (2007) conducted a study of thermal comfort temperature range for factory workers in warm humid tropical climates. The results of this study indicated a higher degree of satisfaction with the indoor environment and a lower prevalence or intensity of symptoms among the occupants in the naturally ventilated buildings. Kampmann and Piekarski (2005) had investigated the assessment of the risk of heat disorders encountered during work in hot conditions in German hard coal mines. The finding from the study revealed that the recorded heat disorders represent early symptoms of more serious health impairments that could occur at the workplaces if workers were not allowed to stop working. Previous study done by Li et al. (2008) show that motivated people could maintain high performance for a short time under adverse (hot or cold) environmental conditions. However the room temperature affected task performance differentially, depending on the type of tasks. Parsons (2000) stated that the decrements in performance occur not only at high environmental temperatures but performance at vigilance tasks can be lowest in slightly warm environments. An increase in environmental stress can then increase performance. In addition, as the rate of chemical reactions in the body increase with temperature, a person's speed at both physical and mental tasks can be increased (Poulton, 1976). Previous research done by Gillberg et al. (2003) showed that the performance of experienced operators may not deteriorate during night shift in control room work of the present type, probably due to lower workload during the night, lack of monotony and processes being relatively inert and forgiving to minor operators errors. Oesman and Arifin (2007) had investigated on how to determine the optimal condition of the working environment using fuzzy logic method in small garment industry. The results of the study revealed that the optimal condition for small industry are temperature of 24ºC, noise 56 dB, illumination 300 lux and vibration 5 m/s2.
METHODOLOGY Selection of Location and Subjects
One automotive manufacturing company was selected as the location for the study. A line producing a product over a period of time and under the effects of sound pressure
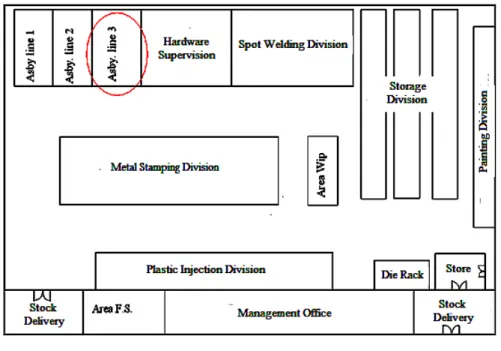
level was chosen. This criterion is essential to quantify the effects of the WBGT (°C) on the worker productivity based on output of assemblies among operators. The production line consisted of 10 woman operators whose task was to assemble an automotive part (a door check). Figure 1 shows the production line layout, while Figure 2 shows the work sequence on the production line. The standard production rate determined by the previous feasibility study to assemble a complete door check was 240 units for every hour of production.
Figure 1: Door Check Production Line
Figure 2: Production sequence for the complete assembly of door checks Data Gathering and Analysis
The inferential statistics (i.e., production rate and WBGT) were computed to generalize the relationships of production rate to WBGT. Further regression analyses were performed to obtain the relationship and thus test the hypotheses. The variables in this study were production rate and WBGT. A simple regression analysis was conducted to obtain the mathematical equation to present the effects of WBGT on the production rate
at that particular production line. The sample included 10 female operators whose ages were in the range of 20 – 30 years, comprised mostly of local citizens and non-degree holders who had been working with the organizations for less than 5 years. The majority of the respondents reported that they work for more than 48 hours per week. The WBGT was measured using Quest Thermal Environment Monitor equipment. The workers’ performance level was represented by the production rate. The quantities of assembled products were recorded every 30 minutes, and data was compared to WBGT level. The data finding were analysed by using simple linear regression and the followed by hypothesis testing. Finally ANOVA analysis was used in order to revealed the significant effect of environmental factors towards human performance. The hypothesis to prove in these particular study were as follows:
Ho:= 0(WBGT (°C) and production rate is not significant) Ha:0(WBGT (°C) and production rate is significant)
RESULTS AND DISCUSSION
The WBGT were taken to identify the effect of temperature on the worker performances. Table 1 shows the data of production rate, WBGT and the time taken for every 30 minutes. A graph was plotted to show the relationship between the production rate and the WBGT as shown in Figure 3. Based on the graph in Figure 3, we can note that the production rate were increases as we increase the WBGT. The coefficient of determination, R2, of 0.608 indicates that 60.8% of the production rate variation was due WBGT variation. The results for regression and ANOVA analysis were presented in Table 2.
Table 1: WBGT (°C), Production Rate and Time Data
Figure 3 shows that by increasing the WBGT will reduce the performance and production rate of the operators. The findings for WBGT are similar to the finding of Fisk and Rosenfeld (1997) where by increasing the air ventilation will significantly increase the performance of the operators. The production rate increases due to the WBGT which could be related to the attention and cognitive aspect of the operators, which has been studied by Staffan and Knez (2001). They found that the air temperature had a significant effect on cognitive performance.
Time Production Target (units) Production Rate (units) WBGT (°C)
09.05 – 09.35 120 119 22.98 09.35 – 10.05 120 123 23.19 10.05 – 10.35 120 121 23.13 10.35 – 11.05 120 115 23.25 11.05 – 11.35 120 121 23.15 12.05 – 12.35 120 124 22.86 12.35 – 01.05 120 108 23.25 02.10 – 02.40 120 112 23.82 02.40 – 03.10 120 106 24.06
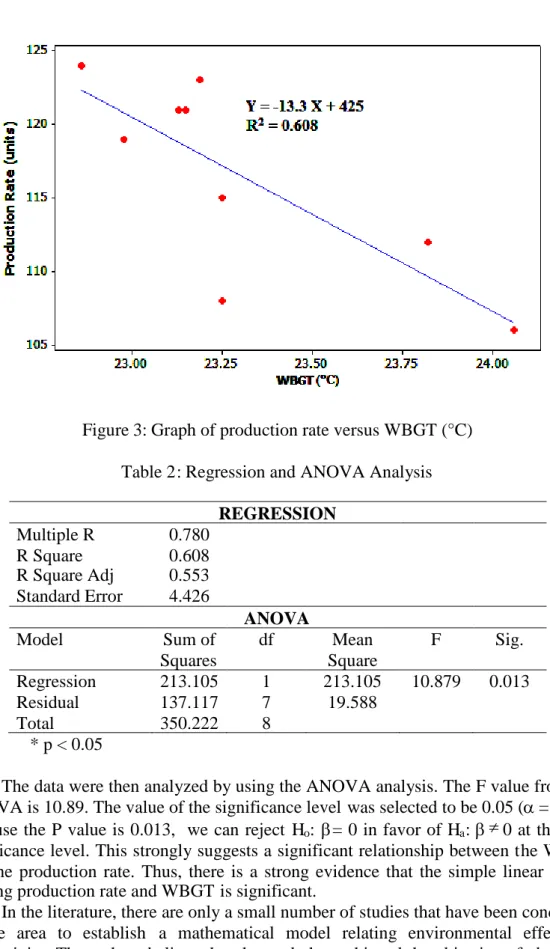
Figure 3: Graph of production rate versus WBGT (°C) Table 2: Regression and ANOVA Analysis
REGRESSION Multiple R 0.780 R Square 0.608 R Square Adj 0.553 Standard Error 4.426 ANOVA Model Sum of Squares df Mean Square F Sig. Regression 213.105 1 213.105 10.879 0.013 Residual 137.117 7 19.588 Total 350.222 8 * p < 0.05
The data were then analyzed by using the ANOVA analysis. The F value from the ANOVA is 10.89. The value of the significance level was selected to be 0.05 (= 0.05). Because the P value is 0.013, we can reject Ho: = 0 in favor of Ha:0 at the 0.05 significance level. This strongly suggests a significant relationship between the WBGT and the production rate. Thus, there is a strong evidence that the simple linear model relating production rate and WBGT is significant.
In the literature, there are only a small number of studies that have been conducted in the area to establish a mathematical model relating environmental effects to productivity. The authors believe that the study has achieved the objective of obtaining a mathematical model to quantitatively relate WBGT to production rate by inferential statistical analysis. Therefore, from this study, the authors expect that in each 30-minutes work cycle, an optimum production rate of 121 units can be achieved. The equation model will be useful for engineers as a guideline during the feasibilities study
of production lines to achieve optimum output. The obtained mathematical model is only applicable to the current conditions for the selected assembly workstation in the Malaysian automotive industry. From these results, it can be concluded that there is a significant effect of WBGT on production rate.
CONCLUSION
The results from the correlation analysis revealed there is a weak negative relationship between the WBGT and productivity of the workers. The linear regression analysis further reveals that there is a linear equation model with negative slope to describe the relationship of WBGT and workers performance for the assembly section involved. The linear regression line obtained is Y = -13.3X + 425. The results of the study indicate a significant relationship between WBGT (°C) and workers’ performance. However, to date, research on the relationship between workplace environmental factors and productivity or performance has been very limited and characterized by a short time perspective or by emphasis on survey methods, statistical analysis, satisfaction preferences measurements. This study was done to empirically confirm the previous perception studies based on the role of environmental factors in productivity. This study is expected to be beneficial to the automotive manufacturing industry in Malaysia. The research findings are restricted to the Malaysian workplace environment, where the awareness of productivity among workers is still low. The results may vary for tests carried out with different sample sizes or in different types of industries and countries. The study could be more extensive if the fraction of defects for the product were included in the analysis. Nevertheless, the authors believed the modeling of production rate as time series data is more than adequate to understand the affect of environmental factors on productivity.
ACKNOWLEDGEMENTS
The authors would like to express their deep gratitude to Universiti Kebangsaan Malaysia (UKM) and Ministry of Higher Education Malaysia for provided the financial support under project no. UKM-GUP-TK-08-16-059.
REFERENCES
Dul, J. and Weerdmeester, B. 2001. Ergonomic For Beginners. London: Taylor and Francis.
Fisk, W.J. and Rosenfeld, A.H. 1997. Estimates of improved productivity and health from better indoor environments. Indoor Air, 7: 158-172.
Gillberg, M., Kecklund, G., Goransson, B. and Akerstedt. T. 2003. Operator performance and signs of sleepiness during day and night work in a simulated thermal power plant. International Journal of Industrial Ergonomics, 31: 101-109.
Hummelgaard, J., Juhl, P., Sæbjörnsson, K.O., Clausen, G., Toftum, J. and Langkilde, G. 2007. Indoor air quality and occupant satisfaction in five mechanically and four naturally ventilated open-plan office buildings. Building and Environment, 42(12); 4051-4058.
Kampmann, B. and Piekarski, C. 2005. Assessment of the risks of heat disorders encountered during work in hot conditions in German hard coal mines. Elsevier Ergonomics Book Series, 3, 79-84.
Li, L., Lian, Z.W., Li, P. and Qian, Y. 2008. Neurobehavioral approach for evaluation of office workers' productivity: The effects of room temperature. Building and
Environment, .
Morioka, I., Ishii, N., Miyai, N., Yamamoto, H., Minami, Y., Wang, T. and Miyashita, K. 2005. An occupational health study on workers exposed to a cold environment in a cold storage warehouse. Elsevier Ergonomics Book Series, 3: 199-204.
Oesman, T.I. and Arifin, M. 2007. Temperature, Noise, Illumination and Vibration Analysis in Production Department at Small Garment Industry. International Conference on Ergonomics, pp. 219-223.
Parsons, K.C. 2000. Environmental ergonomics: a review of principles, methods and models. Applied ergonomics, 31: 581-594.
Poulton, E.C. 1976. Arousing environmental stresses can improve performance, whatever people say. Aviation Space Environment Medical, 47: 1193-1204. Roper, K.O. and Yeh, D.C. 2007. Ergonomics; Older workers; Employees;
Occupational health and safety. Journal of Facilities Management, 5(3):172-178. Srinavin, K. and Mohamed, S. 2003. Thermal environment and construction workers’
productivity: some evidence from Thailand. Building and Environment, 38: 339-345.
Staffan, H. and Knez, I. 2001. Effect of noise, heat, and indoor lighting on cognitive performance and self-reported affect. Journal of Environment Psychology, 21(3): 291–299.
Wijewardane, S. and Jayasinghe, M.T.R. 2008. Thermal comfort temperature range for factory workers in warm humid tropical climates. Renewable Energy, 33(9): 2057-2063.