2
2
0
0
1
1
4
4
P
P
r
r
o
o
j
j
e
e
c
c
t
t
T
T
r
r
a
a
f
f
f
f
i
i
c
c
F
F
o
o
r
r
e
e
c
c
a
a
s
s
t
t
i
i
n
n
g
g
H
H
a
a
n
n
d
d
b
b
o
o
o
o
k
k
This Project Traffic Forecasting Handbook offers guidelines and techniques on the Design Traffic Forecasting Process. This Handbook supplements the Project Traffic Forecasting Procedure Topic No. 525-030-120 by providing more guidance in producing the design traffic parameters AADT,K, D, and T.
This document is a continuation of FDOTs effort to develop an improved traffic forecasting procedure. In order to determine the actual method in use throughout the Districts, and to standardize these methodologies, a statewide survey was conducted by interviewing engineers and planners who produce or use traffic forecasts. A task team was formed to draft a compilation and explanation of the standardized design traffic forecasting methodologies. The result is this Project Traffic Forecasting Handbook. It represents a consensus approach to traffic forecasting.
The major past contributors of this handbook included: Bob McCullough, Emmanuel Uwaibi, Fawzi Bitar, Frank Sullivan, Joey Gordon, John Krane, Lap Hoang, Mike Tako, Susan Sadighi, Bruce Dietrich, Dennis Wood, Frank Broen, Imran Ghani, Jim Baxter, John Kuhl, Louis Reis, Rafael DeArazoza, Ward Swisher and special credit to Harshad Desai for helping the task team reach consensus.
Current contributors included: Rick Reel, Scott Friedman, Vidya Mysore, Terry Corkery, Diana Fields, Frank Tabatabaee, Vladimir Majano, District traffic and modeling staff, and distinct recognition to Douglas McLeod for his perseverance developing and implementing the standardized “K” Factor.
CHAPTER ONE – INTRODUCTION and OVERVIEW
1.1 PURPOSE ... 1-1
1.2 INTRODUCTION ... 1-1
1.3 AUTHORITY ... 1-3
1.4 REFERENCES ... 1-3
1.5 GLOSSARY ... 1-5
1.6 BACKGROUND ... 1-17
1.7 TRUTH IN DATA PRINCIPLE ... 1-20
1.8 PRECISION OF DATA ... 1-20
CHAPTER TWO – TRAFFIC DATA SOURCES and FACTORS
2.1 PURPOSE ... 2-22
2.2 BACKGROUND ... 2-22
2.3 TRAFFIC ADJUSTMENT DATA SOURCES ... 2-23
2.3.1 PERMANENT CONTINUOUS COUNTS ... 2-23
2.3.2 PERMANENT CONTINUOUS CLASSIFICATION COUNTS ... 2-23
2.3.3 PORTABLE SEASONAL CLASSIFICATION COUNTS... 2-24
2.4 SHORT-TERM TRAFFIC COUNTS... 2-26
2.4.1 PORTABLE AXLE COUNTERS ... 2-26
2.4.2 PORTABLE VEHICLE COUNTERS ... 2-26
2.4.3 SEASONAL ADJUSTMENTS ... 2-26
2.5 TRAFFIC ADJUSTMENT FACTORS ... 2-27
2.5.1 SEASONAL FACTOR (SF) ... 2-27
2.5.2 AXLE CORRECTION FACTOR... 2-27
2.6 AADT, K, D, & T ... 2-29
2.6.1 ANNUAL AVERAGE DAILY TRAFFIC (AADT) ... 2-30
2.6.2 K ... 2-31
2.6.2.1 STANDARD K FACTORS ... 2-32
2.6.3 D ... 2-33
2.6.3.1 DEMAND VOLUME ... 2-35
2.6.3.2 ESTABLISHING FORECAST YEARS ... 2-35
2.6.3.3 ACCEPTABLE D VALUES ... 2-40
2.6.3.4 ADJUSTING THE D FACTOR ... 2-40
2.6.3.5 ESTIMATING D EXAMPLE ... 2-41
2.6.4 PERCENT TRUCKS (T) ... 2-43
2.7 EXAMPLE OF ESTIMATION OF AADT ... 2-43
2.8 EXISTING TRAFFIC CONDITION INFORMATION ... 2-47
2.8.1 SEASONAL ADJUSTMENTS ... 2-47
2.8.2 FACTORS... 2-47
2.8.3 ROADWAY DATA... 2-48
2.9 LEVEL OF SERVICE (LOS) OPERATIONAL ANALYSIS ... 2-48
2.10 NUMBER OF LANES REQUIRED ... 2-48
3.1 PURPOSE ... 3-50
3.2 CORRIDOR AND PROJECT TRAFFIC FORECASTING ... 3-51
3.2.1 CORRIDOR TRAFFIC FORECASTING ... 3-51
3.2.2 PROJECT TRAFFIC FORECASTING ... 3-53
3.3 MODELING BACKGROUND FOR TRAFFIC FORECASTING ... 3-55
3.4 MODEL SELECTION... 3-56
3.4.1 REVIEW OF MODEL APPLICABILITY ... 3-56
3.4.1.1 AREAWIDE TRAVEL FORECAST MODEL ... 3-56
3.4.1.2 MODEL APPLICABILITY REVISION ... 3-57
3.4.1.3 PROJECT REFINEMENT ... 3-57
3.5 SUITABILITY OF OUTPUTS AND MODELS ... 3-57
3.5.1 CORRIDOR TRAFFIC DATA USABILITY ... 3-57
3.5.2 TRAFFIC MODEL AVAILABILITY ... 3-57
3.5.3 HISTORICAL TREND ANALYSIS ... 3-58
3.6 USE OF MODEL OUTPUTS IN TRAFFIC FORECASTING ... 3-59
3.6.1 MODIFY INTERIM & FORECAST YEAR NETWORK/LAND USE ... 3-59
3.6.2 EXECUTE THE MODEL STREAM ... 3-59
3.6.3 EVALUATE MODEL TRAFFIC OUTPUT ... 3-59
3.6.4 DOCUMENT THE TRAFFIC FORECAST ... 3-60
3.7 TRAFFIC FORECASTING BACKGROUND FOR MODELERS ... 3-60
3.8 GENERAL TRAVEL DEMAND MODEL ISSUES ... 3-61
3.8.1 TRAVEL DEMAND MODEL SECTION ... 3-61
3.8.2 TRAVEL DEMAND MODEL ACCURACY ASSESSMENT ... 3-62
3.8.2.1 EVALUATION OF BASE YEAR CONDITIONS ... 3-62
3.8.2.2 MODEL ACCURACY ASSESSMENT... 3-62
3.8.2.3 BASE YEAR MODEL REFINEMENTS ... 3-64
3.9 CONSISTENCY WITH THE ADOPTED MPO LONG RANGE
TRANSPORTATION PLAN(LRTP) AND/OR THE LOCAL GOVERNMENT
COMPREHENSIVE PLAN (LGCP) ... 3-65
3.9.1 CONSISTENCY WITH THE PLAN(S) ... 3-65
3.9.2 PLAN AMENDMENT/ALTERNATIVE ... 3-65
3.9.3 INCONSISTENCY DOCUMENTATION/NO PROJECT ... 3-66
3.10 DEVELOPMENT OF FUTURE YEAR TRAVEL DEMAND ... 3-66
3.10.1 EVALUATION OF FUTURE YEAR CONDITIONS... 3-66
3.10.2 REASONABLENESS CHECKS FOR FUTURE YEARS ... 3-66
3.10.3 ACCEPTABLE MODEL REFINEMENTS FOR FUTURE YEARS... 3-67
3.11 RESURFACING PROJECT TRAFFIC FORECASTING PROCEDURE .... 3-67
3.11.1 TRAVEL DEMAND MODEL ACCURACY ASSESSMENT ... 3-67
3.11.2 TRAVEL DEMAND FORECASTING MODEL ADJUSTMENT
PROCEDURES... 3-68
3.11.3 EXECUTING THE MODEL STREAM ... 3-68
3.11.4 DOCUMENTATION OF TRAFFIC FORECAST ... 3-68
3.12 TRAVEL DEMAND MODEL ACCURACY ASSESSMENT ... 3-68
3.12.1.1 PROJECT MODEL ACCURACY ASSESSMENT ... 3-68
3.12.1.2 BASE YEAR LAND USE ... 3-69
3.12.1.3 BASE YEAR NETWORK DATA ... 3-69
3.12.1.4 BASE YEAR COUNTS ... 3-69
3.12.1.5 BASE YEAR PROJECT MODEL EVALUATION CRITERIA ... 3-70
3.12.2 EXISTING YEAR MODEL REFINEMENTS ... 3-70
3.13 TRAVEL DEMAND FORECASTING MODEL ADJUSTMENT
PROCEDURES... 3-72
3.13.1 EVALUATION OF FUTURE YEAR CONDITIONS... 3-72
3.13.2 FUTURE YEARS LAND USE ... 3-72
3.13.3 FUTURE YEARS NETWORK ... 3-72
3.14 EVALUATE MODEL TRAFFIC OUTPUT ... 3-73
3.15 DOCUMENTATION OF TRAFFIC FORECAST ... 3-73
3.15.1 TURNING MOVEMENTS SCHEMATICS ... 3-73
3.15.2 CERTIFICATION ... 3-73
3.16 THE MODEL OUTPUT CONVERSION ... 3-76
3.17 PEAK SEASON CONVERSION FACTORS (PSCF) AND SEASON
FACTORS ... 3-76
3.18 CONVERTING DAILY TRAFFIC COUNTS TO PSWADT & AADT ... 3-78
3.19 MODEL OUTPUT CONVERSION FACTOR (MOCF) ... 3-78
3.20 CONVERTING PSWADT TO AADT ... 3-79
CHAPTER FOUR– FORECASTING WITHOUT A TRAFFIC MODEL
4.1 PURPOSE ... 4-82
4.2 INTRODUCTION ... 4-82
4.3 BACKGROUND ... 4-82
4.4 PROJECT TRAFFIC FORECASTING WITHOUT A MODEL ... 4-83
4.4.1 DATA ASSEMBLY ... 4-83
4.4.2 ESTABLISH TRAFFIC GROWTH TREND ... 4-84
4.4.3 DEVELOP PRELIMINARY TRAFFIC PROJECTION... 4-84
4.4.4 CHECK FORECAST FOR REASONABLENESS ... 4-84
4.4.5 DEVELOP PROJECT TRAFFIC FORECAST IN DETAIL ... 4-85
4.4.6 ANALYSIS OF PROJECTIONS ... 4-86
4.4.7 FINAL REVIEW AND DOCUMENTATION ... 4-86
4.5 AVAILABLE RESOURCES... 4-87
4.6 HENDRY COUNTY EXAMPLE ... 4-88
4.7 SUMMARY ... 4-90
5.1 PURPOSE ... 5-92
5.2 INTRODUCTION ... 5-92
5.3 DEVELOPMENT OF DIRECTIONAL DESIGN HOUR TRAFFIC VOLUMES
... 5-92
5.4 USE OF DESIGN HOUR TRAFFIC VOLUMES ... 5-93
5.5 PRACTICAL EXAMPLE ... 5-93
5.5.1 EXAMPLE 1 – DEVELOPMENT OF DDHVs FROM MODEL PSWADTs
... 5-93
CHAPTER SIX – ESTIMATING INTERSECTION TURNING MOVEMENTS
6.1 PURPOSE ... 6-96
6.2 INTRODUCTION ... 6-96
6.3 BACKGROUND ... 6-97
6.4 TURNS5-V2014 BACKGROUND ... 6-98
6.5 TURNS5-V2014 METHODOLOGY ... 6-99
6.5.1 OPTIONS FOR FUTURE TRAFFIC GROWTH ... 6-99
6.5.2 OPTION 1 – FSUTMS MODEL TRAFFIC AVAILABLE? ... 6-99
6.5.3 OPTION 2 – SPECIFY GROWTH RATES FOR EACH PROJECT YEAR
... …6-99
6.6 MENU OPTIONS ... 6-101
6.6.1 FILE FOLDERS ... 6-102
6.6.2 MAIN MENU OPTIONS ... 6-102
6.6.3 PRINTING OPTIONS ... 6-104
6.7 DATA INPUT SHEET ... 6-106
6.7.1 DATA INPUT PAGE 1 ... 6-106
6.7.2 DATA INPUT PAGE 2 ... 6-107
6.7.3 DATA INPUT PAGE 3 ... 6-108
6.7.4 PROGRAM OUTPUTS ... 6-109
6.8 TURNS5-V2014 SPREADSHEET ... 6-112
6.8.1 SUMMARY EVALUATION ... 6-112
6.9 METHODS IN THE NCHRP255 REPORT ... 6-113
6.10 H. J. VAN ZUYLEN METHOD ... 6-113
6.11 TMTOOL ... 6-114
6.12 MANUAL METHOD ... 6-115
6.13 SUMMARY ... 6-116
CHAPTER SEVEN – EQUIVALENT SINGLE AXLE LOAD FORECAST
7.1 PURPOSE ... 7-118
7.2 BACKGROUND ... 7-118
7.2.1 PROJECTIONS ... 7-121
7.2.2 ACCUMULATIONS ... 7-121
7.2.3 TRAFFIC BREAKS ... 7-121
7.3 TRUCK FORECASTING PROCESS ... 7-123
7.3.2 TRUCK GROWTH FACTOR (PERCENT OF GROWTH)... 7-123
7.3.3 PROJECT TRAFFIC FORECAST ... 7-124
7.3.4 TYPE OF PROJECT ... 7-124
7.3.5 NEW CONSTRUCTION PROJECT ... 7-124
7.3.6 RESURFACING AND RECONSTRUCTION PROJECTS ... 7-124
7.3.7 HISTORICAL DATA AVAILABILITY ... 7-124
7.3.8 HISTORICAL TREND ANALYSIS ... 7-124
7.3.8.1 LINEAR GROWTH ... 7-125
7.3.8.2 EXPONENTIAL GROWTH ... 7-126
7.3.8.3 DECAYING EXPONENTIAL GROWTH ... 7-127
7.3.9 PERCENT TRUCKS (T) ... 7-128
7.3.10 FUTURE TRUCK VOLUMES ... 7-129
7.4 DESIGN REQUIREMENTS ... 7-131
7.4.1 ESAL
DEQUATION ... 7-131
7.4.2 DIRECTIONAL DISTRIBUTION FACTOR (D
F) ... 7-132
7.4.3 LANE FACTOR (L
F) ... 7-132
7.4.4 LOAD EQUIVALENCY FACTOR (E
For E
80) ... 7-134
7.5 STEPS FOR PRODUCING 18-KIP ... 7-135
7.6 SUMMARY ... 7-144
APPENDIX
APPENDIX A – Central Office and District Planning and Modeling Contacts ... A-1
APPENDIX B – FHWA Letter - Use of Standard K-Factors for Traffic Forecasting ... B-1
APPENDIX C – Example of District Two Manual Method – Balancing Turning
Movement Volumes ... C-1
1.1 Traffic Forecasting Process ... 1-20
2.1 Florida’s Traffic Monitoring Sites used in 2010 ... 2-25
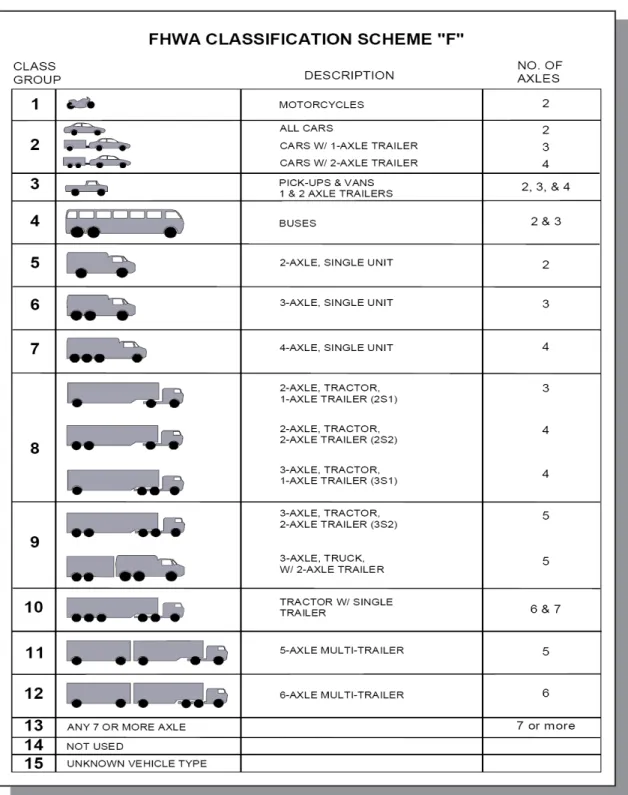
2.2 FHWA Vehicle Classification Scheme “F” ... 2-26
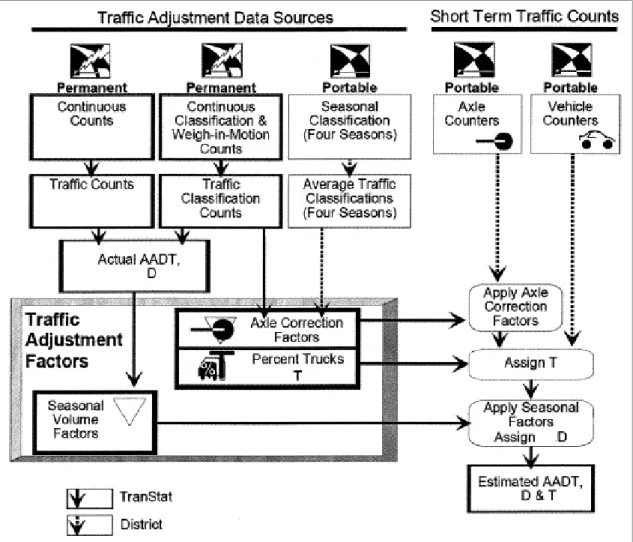
2.3 Processes used to Estimate AADT, D, & T ... 2-27
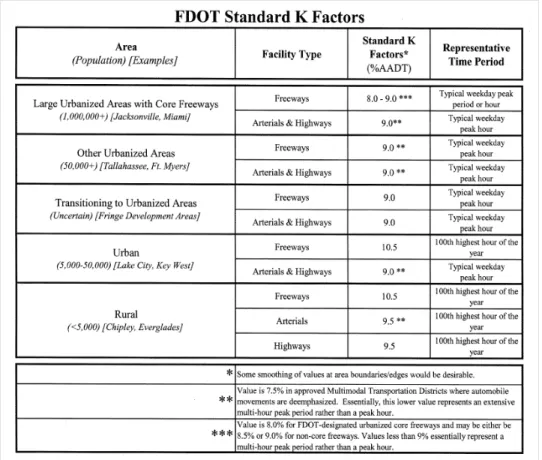
2.4 FDOT Standard K Factors ... 2-33
2.5 Traffic Volume Directional Distribution, US-192, Site 110470 ... 2-35
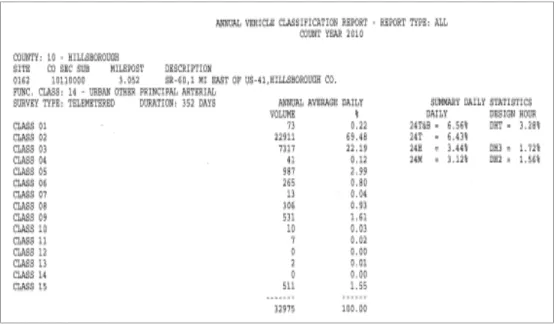
2.6 Example of an Annual Vehicle Classification Report (Site 100162) ... 2-37
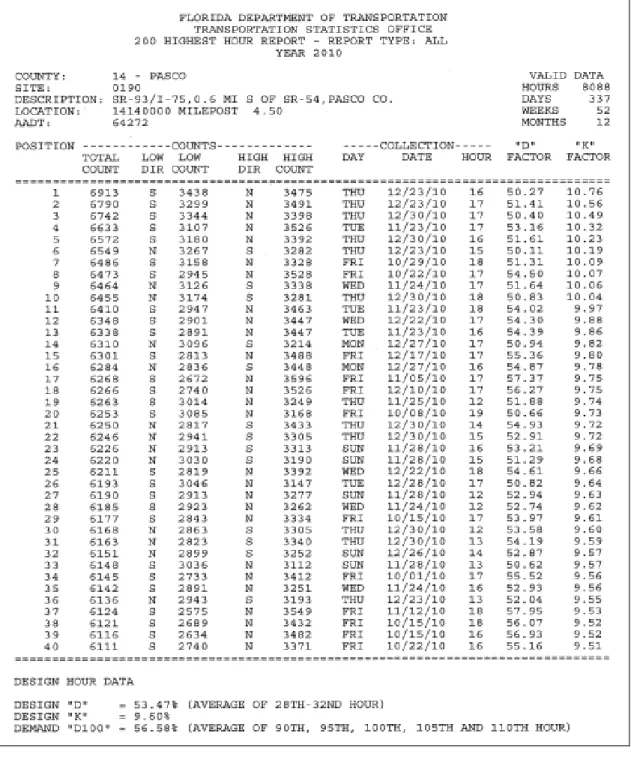
2.7 Hours 1 - 40 for Site 140190 from the 2010 200
thHighest Hour Report ... 2-39
2.8 Hours 45 - 200 for Site 140190 from the 2010 200
thHighest Hour Report ... 2-40
2.9 Recommended D-Factors (D) for Traffic Forecasting ... 2-41
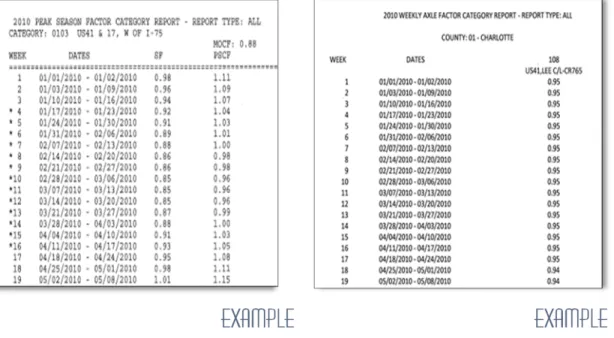
2.10 Peak Season Factor Category Report ... 2-46
2.11 Weekly Axle Factor Category Report ... 2-46
2.12 Volume Factor Category Summary Report ... 2-47
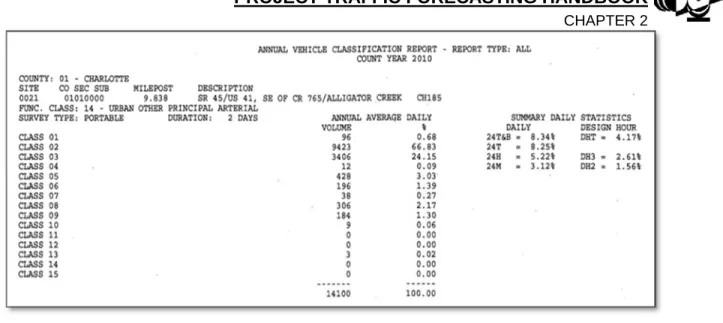
2.13 Annual Vehicle Classification Report ... 2-48
3.1 Corridor Traffic Forecasting Process ... 3-54
3.2 Project Traffic Forecasting Process ... 3-56
3.3 Traffic Assignment Accuracy Levels (VOC) ... 3-65
3.4 Traffic Assignment Accuracy Levels (RMSE) ... 3-66
3.5 PTF Certification Statement ... 3-77
3.6 18-KIP ESAL Certification Statement... 3-78
3.7 Peak Season Factor Category Report – 4600 Bay Recreational ... 3-80
3.8 MOCF Report ... 3-82
3.9 Peak Season Factor Category Report ... 3-83
6.1 TURNS5-V2014 Main Menu ... 6-104
6.2 TURNS5-V2014 ”Enter Data” Page 1 ... 6-106
6.3 TURNS5-V2014 “Enter Data” Page 2 ... 6-108
6.4 TURNS5 -V2014 Input Sheet ... 6-110
6.5 TURNS5-V2014 Initial Turning Volumes Summary ... 6-111
6.6 TURNS5-V2014 Design Hour Turning Movements ... 6-112
6.7 TURNS5-V2014 Input TMCs Compared to DHVs... 6-112
7.1 ESAL Forecasting Process ... 7-121
7.2 Printout from ESAL-V02.xls Spreadsheet Program ... 7-123
7.3 Truck Trend Analysis (example) ... 7-124
7.4 Linear Growth Example ... 7-126
7.5 Exponential Growth Example ... 7-127
7.6 Decaying Exponential Growth Example ... 7-128
7.7 Regression Analysis Example for Future Years ... 7-131
7.8 Equivalency Factors for Different Types of Facilities ... 7-133
7.9 COPES Chart ... 7-134
7.10 18-KIP Request Memorandum (example) ... 7-137
7.11 Example from the Traffic Classification Report ... 7-138
7.12 72-Hour Classification Count Request Memorandum ... 7-138
7.13 Trend Projection... 7-139
7.15 Trend Projection Results ... 7-141
7.16 Estimating AADT from a 72-Hour Count ... 7-142
7.17 Estimating the D Factor ... 7-142
7.18 Traffic Classification Report for Site 102028 ... 7-143
7.19 Data Input Sheet for ESAL-V02.xls ... 7-144
7.20 Report Printout for ESAL-V02.xls ... 7-145
CHAPTER 1
CHAPTER ONE
INTRODUCTION AND OVERVIEW
1.1 PURPOSE
This handbook offers guidelines and techniques on the Project Traffic Forecasting Process for use by FDOT staff and consultants providing traffic parameters required by project design. This handbook may be used by local governments and other agencies to review highway projects. This handbook provides instructions for Corridor Traffic Forecasting, Project Traffic Forecasting and Equivalent Single Axle Loading (ESAL) Forecasting.
1.2 INTRODUCTION
This handbook supplements the Project Traffic Forecasting Procedure Topic No. 525-030-120 and consists of seven Chapters with three Appendices:
Chapter 1
Introduction and Overview
This chapter describes general guidelines, references, definitions, and techniques to be used in the Project Traffic Forecasting Process. In addition, it also outlines the forecasting processes which include Corridor, Project and Equivalent Single Axle Load (ESAL).
Chapter 2
Traffic Data Sources and Factors
This chapter describes the different types of traffic counters in operation, the current traffic data collection methodologies used in the State of Florida, the estimation and tabulation of Seasonal Factors (SF), axle correction factors (ACF), estimates ofAnnual Average Daily Traffic (AADT), K and Standardized K, Directional Design Volume Factor (D), and Percent Trucks (T) for the current year.
Chapter 3
Forecasting with Travel Demand Models
This chapter provides guidance in the application of models to develop traffic projections for route specific (PD&E) studies, corridor studies and resurfacing type projects. This chapter also provides an overview of modeling for traffic engineers and an overview of traffic forecasting requirements for modelers.
CHAPTER 1
Chapter 4
Forecasting without a Traffic Model
This chapter provides a description of the appropriate methods of performing trend analysis and examination of local land use plans, and other indicators of future growth in the project traffic forecasting process.
Chapter 5
Directional Design Hourly Volumes
This chapter describes the appropriate methods for converting model volume outputs to Annual Average Daily Traffic (AADT) volumes and then into Directional Design Hourly Volumes (DDHVs), which are used in the evaluation of roadway points, links and facility analyses.
Chapter 6
Estimating Intersection Turning Movements
The purpose of this chapter is to provide a method for balancing turning movement volumes at intersections. The TURNS5-V2014 spreadsheet is explained and reviews of other techniques are summarized.
Chapter 7
Equivalent Single Axle Load Forecast
This chapter describes the guidelines and techniques of forecasting Equivalent Single Axle Load (ESAL) volumes for use in pavement design.
Appendix A
Central Office and District Planning and Modeling Contacts
Appendix B
FHWA Letter - Use of Standard K-Factors for Traffic Forecasting
Appendix C
CHAPTER 1
1.3 AUTHORITY
Sections 20.23(4)(a) and 334.048(3); Florida Statutes (F.S.).
1.4 REFERENCES
Sections 334.03(25); 334.046(1) and (2); 334.063; 334.17; 334.24; and 338.001(5); (F.S.).
Project Traffic Forecasting Procedure, Florida Department of Transportation, Topic No. 525-030-120, April 17, 2012.
General Interest Roadway Data Procedure, Florida Department of Transportation, Transportation Statistics Office, Topic No. 525-020-310, December 9, 2013.
Florida Traffic Information & Highway Data DVD (2013), Florida Department of Transportation,Transportation Statistics Office.
Quality/Level of Service (Q/LOS) Handbook, 2013, Florida Department of Transportation, Systems Planning Office.
Transportation Impact Handbook, Florida Department of Transportation, Systems Planning Office.
FSUTMS-Cube Voyager Version 6.1.0, Florida Department of Transportation, Systems Planning Office.
FSUTMS-Cube Framework Phase II, Model Calibration and Validation Standards, October 2, 2008.
Roadway Plans Preparation Manual, Volume 1: Design Criteria and Process, Florida Department of Transportation, Roadway Design Office, Topic No. 625-000-007; and Volume 2: Plans Preparation and Assembly, Topic No. 625-000-008.
Manual on Uniform Traffic Studies, Florida Department of Transportation, Traffic Engineering Office, Topic No. 750-020-007, January 2004.
Flexible Pavement Design Manual, Florida Department of Transportation, Pavement Management Office, Topic No. 625-010-002.
Rigid Pavement Design Manual, Florida Department of Transportation, Pavement Management Office, Topic No. 625-010-006.
CHAPTER 1
1.4 REFERENCES - continued
A Policy on Geometric Design of Highways and Streets, American Association of State Highway and Transportation Officials (AASHTO), 5th Edition.
Highway Capacity Manual (HCM 2010), Transportation Research Board.
Traffic Forecasting for Pavement Design, Harshad Desai, et. al., Federal Highway Administration, Washington, D.C., FHWA-TS-86-225, 1988.
Traffic Monitoring Guide, Federal Highway Administration (FHWA), September 2013
ITE Trip Generation Manual, 9th Edition.
National Cooperative Highway Research Program (NCHRP) Report 187, “Distribution of Assigned Volumes Among Available Facilities”, Transportation Research Board (TRB).
National Cooperative Highway Research Program (NCHRP) Report 255, “Highway Traffic Data for Urbanized Area Project Planning and Design”, Transportation Research Board (TRB).
National Cooperative Highway Research Program (NCHRP) Report 277, “Portland Cement Concrete Pavement Evaluation System (COPES)”, M. L. Darter, J. M. Becker, M. B. Snyder and R. E. Smith, Transportation Research Board (TRB), September 1985.
FDOT uses the latest version of each reference listed. These documents can be obtained from the Office of Maps and Publications, (850) 414-4050 or through DOT INFONET under Maps and Publications Internet and Forms and Procedures Intranet.
CHAPTER 1
1.5 GLOSSARY
Terms in this handbook are used as defined in the most recent editions of the Highway Capacity Manual (HCM 2010), A Policy on Geometric Design of Highways and Streets (AASHTO), and the Project Traffic Forecasting Procedure. Modeling terms which are used in Travel Demand Forecasting Models (Chapter 3) are followed by (MODEL). The following terms are defined to reflect their meaning in this Project Traffic Forecasting Handbook:
ACTION PLAN — A document identifying low cost, short-term, and major capacity improvements necessary to bring a controlled access facility to Strategic Intermodal System/Florida Intrastate Highway System (SIS/FIHS) standards within 20 years.
ADJUSTED COUNT — An estimate of a traffic statistic calculated from a base traffic count that has been adjusted by application of axle, seasonal, or other defined factors. (AASHTO)
AADT ANNUAL AVERAGE DAILY TRAFFIC — The total volume of traffic on a highway segment for one year, divided by the number of days in the year. This volume is usually estimated by adjusting a short-term traffic count with weekly and monthly factors. (AASHTO)
AAWDT ANNUAL AVERAGE WEEKDAY TRAFFIC — The estimate of typical traffic during a weekday (Monday through Friday) calculated from data measured at continuous traffic monitoring sites.
AREA OF INFLUENCE — The geographical transportation network of state and regionally significant roadway segments on which the proposed project would impact five percent or more of the adopted peak hour level of service maximum service volume of the roadway, and the roadway is, or is projected to be, operating below the adopted level of service standard in the future.
ARTERIAL — A signalized roadway that serves primarily through-traffic and provides access to abutting properties as a secondary function, having signal spacings of two miles or less and turning movements at intersections that usually does not exceed 20 percent (%) of the total traffic.
ADT AVERAGE DAILY TRAFFIC — The total traffic volume during a given time period (more than a day and less than a year) divided by the number of days in that time period. (AASHTO)
CHAPTER 1
1.5
GLOSSARY - continued
ACF AXLE CORRECTION FACTOR — The factor developed to adjust vehicle axle sensor base data for the incidence of vehicles with more than two axles, or the estimate of total axles based on automatic vehicle classification data divided by the total number of vehicles counted. (AASHTO)
BASE COUNT — A traffic count that has not been adjusted for axle factors (effects of trucks) or seasonal (day of the week/month of the year) effects. (AASHTO)
BASE DATA — The unedited and unadjusted measurements of traffic volume, vehicle classification, and vehicle or axle weight. (AASHTO)
BASE YEAR — The initial year of the forecast period.
BASE YEAR (MODEL) — The year the modeling system was calibrated, from which projections are made.
CALIBRATION (MODEL) — An extensive analysis of a travel demand forecasting model based on census, survey, traffic count and other information.
CAPACITY — The maximum sustainable hourly flow rate at which persons or vehicles can be expected to traverse a point or uniform section of a lane or roadway during a given time period under prevailing roadway, environmental, traffic and control conditions. (HCM 2010)
CORE FREEWAY — A conceptual term defining a freeway (major, through, non-toll) routed into or through a large urbanized area’s core area (central business districts). The Standard K value may change on this Core Freeway as it passes through the urbanized area. (FDOT)
CORRIDOR — A broad geographical band that follows a general directional flow connecting major origins and destinations of trips and that may contain a number of alternate transportation alignments.
CORRIDOR TRAFFIC FORECASTING — The process used to determine the required number of lanes within a corridor to meet anticipated traffic demands.
CHAPTER 1
1.5 GLOSSARY - continued
CORRIDOR TRAFFIC STUDY — The long range system data forecast that includes projected link volumes and other data necessary to determine the number of lanes needed on a particular roadway and that includes the analysis of transportation alternatives for the corridor.
COUNT — The data collected as a result of measuring and recording traffic characteristics such as vehicle volume, classification, speed, weight, or a combination of these characteristics. (AASHTO)
COUNTER —-Any device that collects traffic characteristics data. FDOT utilizes Continuous Count, Classification and Weigh-In-Motion (WIM) Counters, Portable Axle Counters, and Portable Vehicle Counters. (see TTMS, PTMS) CUTLINE — A cutline is similar to a screenline; however, it is shorter and crosses corridors rather than regional flows. Cutlines should be established to intercept travel along only one axis. (MODEL)
DTV DAILY TRUCK VOLUME — The total volume of trucks on a highway segment in a day.
DAMAGE FACTOR — (see Load Equivalency Factor).
DEMAND VOLUME — The traffic volume expected to desire service past a point or segment of the highway system at some future time, or the traffic currently arriving or desiring service past such a point, usually expressed as vehicles per hour.
DESIGN HOUR — An hour with a traffic volume that represents a reasonable value for designing the geometric and control elements of a facility. (HCM 2010)
DESIGN HOUR FACTOR — The proportion of the AADT that occurs during the design hour. (see also K-FACTOR) (HCM 2010)
DHT DESIGN HOUR TRUCK — The percent of trucks expected to use a highway segment during the design hour of the design year. The adjusted, annual design hour percentage of trucks and buses (24T+B).
CHAPTER 1
1.5 GLOSSARY - continued
DHV DESIGN HOUR VOLUME — The traffic volume expected to use a highway segment during the design hour of the design year. The Design Hour Volume (DHV) is related to AADT by the “K” factor.
DH2 — The adjusted, annual design hour medium truck percentage. The sum of the annual percentages of Class Groups 4 and 5 (see Figure 2.2), adjusted to 24 hours.
DH3 — The adjusted, annual design hour heavy truck percentage. Is DHT minus DH2, or the sum of the adjusted annual
percentages of Class Groups 6 through 13 (see Figure 2.2).
DESIGN PERIOD — The number of years from the initial application of traffic until the first planned major resurfacing or overlay. (AASHTO)
DESIGN YEAR —- Usually 20 years from the Opening Year, but may be any time within a range of years from the present (for restoration type projects) to 20 years in the future (for new construction type projects). The year for which the roadway is designed.
DRI DEVELOPMENT OF REGIONAL IMPACT — Any development which,
because of its character, magnitude, or location, would have a substantial effect upon the health, safety, or welfare of citizens of more than one county.
(F.S. 1993 LAND AND WATER MANAGEMENT)
DDHV DIRECTIONAL DESIGN HOUR VOLUME — The traffic volume expected to use a highway segment during the design hour of the design year in the peak direction.
CHAPTER 1
1.5 GLOSSARY - continued
D DIRECTIONAL DISTRIBUTION — The percentage of total, two-way peak hour traffic that occurs in the peak direction.
D — The proportion of traffic based on the median (average) for the design hour of the design year traveling in the peak direction. D is often used in calculating the level of service for a roadway.
DF — Directional distribution factor for ESALD equation. Use 1.0 if one-way traffic is counted or 0.5 for two-way. This value is not to be confused with the Directional Factor (D) used for planning capacity computations.
ESAL EQUIVALENT SINGLE AXLE LOAD — A unit of measurement equating the amount of pavement consumption caused by an axle or group of axles, based on the loaded weight of the axle group, to the consumption caused by a single axle weighing 18,000 lbs. (AASHTO)
ESAL FORECASTING PROCESS — The process required to estimate the cumulative number of 18-KIP ESALs for the design period; used to develop the structural design of the roadway.
FACTOR — A number that represents a ratio of one number to another number. The factors used in this handbook are K, D, T, Design Hour Factor, Peak Hour Factor and Seasonal Factor. The Load Equivalency Factor adjusts pavement damage calculations.
FDOT FLORIDA DEPARTMENT OF TRANSPORTATION
FHWA FEDERAL HIGHWAY ADMINISTRATION
FIHS FLORIDA INTRASTATE HIGHWAY SYSTEM — A system of existing and future limited access and controlled access facilities that have the capacity to provide high-speed and high-volume traffic movements in an efficient and safe manner.
FM FINANCIAL MANAGEMENT SYSTEM
CHAPTER 1
1.5 GLOSSARY - continued
FSUTMS FLORIDA STANDARD URBAN TRANSPORTATION MODEL
STRUCTURE — The standard model for projecting traffic flow in the State of Florida.
FTP FLORIDA TRANSPORTATION PLAN — A statewide, comprehensive transportation plan, to be annually updated, which is designed to establish long range goals to be accomplished over a 20-25 year period and to define the relationships between the long range goals and short range objectives and policies implemented through the Work Program.
FORECAST PERIOD — The total length of time covered by the traffic forecast. It is equal to the period from the base year to the design year. For existing roads, the forecast period will extend from the year in which the forecast is made, and thus must include the period prior to the project being completed as well as the life of the project improvement.
FREEWAY — A fully access-controlled, divided highway with a minimum of two lanes (and frequently more) in each direction. (HCM 2010)
HIGHWAY — A term that includes roads, streets, and parkways and all appurtenances.
HCM HIGHWAY CAPACITY MANUAL
HOV HIGH OCCUPANCY VEHICLE —Any vehicle carrying two or more passengers.
IJR INTERCHANGE JUSTIFICATION REPORT — The documentation
submitted through FDOT to FHWA to determine if a new interchange on an interstate is allowed.
IMR INTERCHANGE MODIFICATION REPORT — The documentation
submitted through FDOT to FHWA to determine if modification to an existing interchange on an interstate is allowed.
INTERMEDIATE YEAR — Any future year in the forecast period between the base year and the design year, typically halfway between the opening year and the design year.
CHAPTER 1
1.5 GLOSSARY - continued
K-FACTOR— The ratio of the traffic volume in the study hour to the Annual Average Daily Traffic (AADT). (seealsoStandard K)
Lf LANE FACTOR — Value calculated by a formula that accounts for the proportion of vehicles that use the design lane (commonly the outside lane ) of a divided roadway. The percentage of vehicles driving in the design lane is dependent on the directional number of lanes, and the AADT. Lane Factor is used to convert directional trucks to the design lane trucks. Lane factors can be adjusted to account for unique features known to the designer such as roadways with designated truck lanes.
See COPES equation: (Section 7.4.3)
LF = (1.567 - 0.0826 x Ln(One-Way AADT) - 0.12368 x LV)
LOS LEVEL OF SERVICE — A quantitative stratification of a performance measure or measures that represent quality of service, measured on an A-F scale, with LOS A representating the best operating conditions from the traveler’s perspective and LOS F the worst. (HCM 2010)
LINK — The spatial representation of the transportation system, which may or may not constitute a one-to-one correspondence to the actual major components of the transportation system being modeled. There are three primary attributes which describe a link: facility type, area type, and the number of lanes. (MODEL)
LOAD EQUIVALENCY FACTOR — The ratio of the number of repetitions of an 18,000 pound single axle load necessary to cause the same degree of pavement damage as one application of any axle load and axle number combination. A Load Equivalency Factor is commonly referred to as a damage factor.
LGCP LOCAL GOVERNMENT COMPREHENSIVE PLAN — The plan (and
amendments thereto) developed and approved by the local governmental entity pursuant to Chapter 163, F.S., and Rule Chapter 9J-5, Florida Administrative Code, and found in compliance by the Florida Department of Community Affairs.
CHAPTER 1
1.5 GLOSSARY - continued
LONG RANGE PLAN — A document with a 20-year planning horizon required of each Metropolitan Planning Organization (MPO) that forms the basis for the annual Transportation Improvement Program (TIP), developed pursuant to Title 23 United States Code 134 and Title23 Code of Federal Regulations Part 450 Subpart C.
MASTER PLAN — A document identifying both short-term and long-term capacity improvements to limited access highways (Interstate, Turnpike and other expressways) consistent with policies and standards to meet SIS/FIHS standards. Master Plans shall also identify potential new or modifications to existing interchanges.
MPO METROPOLITAN PLANNING ORGANIZATION
MOCF MODEL OUTPUT CONVERSION FACTOR — The MOCF is used to
convert the traffic volumes generated by a travel demand forecasting model (PSWADT) to AADT. The MOCF is the average of the 13 consecutive weeks during which the highest weekday volumes occur and when the sum of Seasonal Factors (SF) for those 13 weeks are the lowest. MOCF used in validation to convert AADT to PSWADT for the base year model network should be used for adjusting future year model volume. Note: Currently, there are several model outputs throughout the State that require conversion from PSWADT to AADT using MOCF (see page 3-80).
MADT MONTHLY AVERAGE DAILY TRAFFIC — The estimate of mean traffic volume for a month, calculated by the sum of Monthly Average Days of the Week (MADWs) divided by seven; or in the absence of a MADW for each day of the week, divided by the number of available MADWs during the month. (AASHTO)
MADW MONTHLY AVERAGE DAYS OF THE WEEK — The estimate of traffic volume mean statistic for each day of the week, over the period of one month. It is calculated from edited-accepted permanent data as the sum of all traffic for each day of the week (Sunday, Monday, and so forth through the week) during a month, divided by the occurrences of that day during the month. (AASHTO)
CHAPTER 1
1.5 GLOSSARY - continued
MSF MONTHLY SEASONAL FACTOR — A seasonal adjustment factor derived by dividing the AADT by the MADT for a specific TTMS count site.
OPENING YEAR — One year beyond the scheduled beginning of construction as defined in the Adopted Five Year Work Program for a project. This is normally provided by the project manager.
PD&E PROJECT DEVELOPMENT & ENVIRONMENT/ENVIRONMENTAL PHF PEAK HOUR FACTOR — The hourly volume during the analysis hour
divided by the peak 15-min flow rate within the analysis hour; a measure of traffic demand fluctuation within the analysis hour. (HCM 2010)
PEAK HOUR-PEAK DIRECTION — The direction of travel (during the 60-minute peak hour) that contains the highest percentage of travel.
PEAK SEASON — The 13 consecutive weeks of the year with the highest traffic volume.
PSCF PEAK SEASON CONVERSION FACTOR — Used to convert a 24-hour count representing the average weekday daily traffic to PSWADT.
PSWADT PEAK SEASON WEEKDAY AVERAGE DAILY TRAFFIC — The average weekday traffic during the peak season. FSUTMS traffic assignment volume represents Peak Season Weekday Average Daily Traffic (PSWADT) projections for the roads represented in the model highway network. For Project Traffic Forecasting Reports, the PSWADT should be converted to AADT using a MOCF. Note: Currently, there are several model outputs throughout the State that require conversion from PSWADT to AADT using MOCF.
p/d PEAK-TO-DAILY RATIO — The highest hourly volume of a day divided by the daily volume.
PERMANENT COUNT — A 24-hour traffic count continuously recorded at a permanent count station.
CHAPTER 1
1.5 GLOSSARY - continued
PERMANENT COUNT STATION — Automatic Traffic Recorders that are permanently placed at specific locations throughout the state to record the distribution and variation of traffic flow by hours of the day, days of the week, and months of the year from year to year. (see TTMS — Telemetered Traffic Monitoring Site)
PTMS PORTABLE TRAFFIC MONITORING SITE — Automatic Traffic
Recorders that are temporarily placed at specific locations throughout the state to record the distribution and variation of traffic flow.
PROJECT TRAFFIC — A forecast of the design hour traffic volume for the design year. Project Traffic Forecasting projections are required by FDOT for all design projects.
PROJECT TRAFFIC FORECASTING (PTF) — The process to estimate traffic conditions used for determining the geometric design of a roadway and/or intersection and the number of 18-KIP ESALs that pavement will be subjected to over the design life.
RCI ROADWAY CHARACTERISTICS INVENTORY — A database maintained by the Transportation Statistics Office (TranStat) which contains roadway and traffic characteristics data for the State Highway System, including current year traffic count information such as AADT and the traffic adjustment factors, K, D, and T.
SCREENLINE — An imaginary line which intercepts major traffic flows through a region, usually along a physical barrier such as a river or railroad tracks, splitting the study area into parts. Traffic counts and possibly interviews are conducted along this line as a means to compare simulated model results to field results as part of the calibration/validation of a model. (MODEL)
SF SEASONAL FACTOR — Parameters used to adjust base counts which consider travel behavior fluctuations by day of the week and month of the year. The Seasonal Factor used in Florida is determined by interpolating between the Monthly Seasonal Factors for two consecutive months. (AASHTO)
CHAPTER 1
1.5 GLOSSARY - continued
SERVICE FLOW RATE — The maximum directional rate of flow that can be sustained in a given segment under prevailing roadway, traffic, and control conditions without violating the criteria for LOSi. (HCM 2010)
STANDARD K — A conceptual “design” term defining factors within a rural, transitioning, urban or urbanized area that are based on a ratio of peak hour volume to annual average daily traffic (K). Multiple standard K factors may be assigned depending on the area type and facility type and applied statewide.
SIS STRATEGIC INTERMODAL SYSTEM — Facilities, including appropriate components of all modes, and services of statewide or interregional significance that meet high levels of people and goods movement, generally supporting the major flows of interregional, interstate, and international trips. Both “Strategic Intermodal System” and “Emerging SIS” are a formal part of “The SIS”.
TARGET YEAR — The final year of the forecast period; i.e., the design year, or the future year for which roadway improvements are designed.
Tf T-FACTOR — Truck Factor; the percentage of truck traffic during the peak hours.
T24— The percentage of truck traffic for 24 hours (one day). (Categories 4-13, see Figure 2.2)
24T+B 24-HOUR TRUCK + BUS PERCENTAGE — The adjusted, annual 24-hour percentage of trucks and buses (Categories 4 through 13, see Figure 2.2).
24T 24-HOUR TRUCK PERCENTAGE — The adjusted, annual 24-hour
percentage of trucks (Categories 5 through 13, see Figure 2.2).
TAZ TRAFFIC ANALYSIS ZONE — The basic unit of analysis representing the spatial aggregation for people within an urbanized area. Each TAZ may have a series of zonal characteristics associated with it which are used to explain travel flows among zones. Typical characteristics include the number of households and the number of people that work and/or live in a particular area. (MODEL)
CHAPTER 1
1.5 GLOSSARY - continued
TRAFFIC BREAK — A continuous section of highway that is reasonably homogenous with respect to traffic volume, vehicle classification, and general physical characteristics (e.g., number of through lanes), with beginning and ending points at major intersections or interchanges. Traffic breaks are determined through engineering judgment by the Districts and are recorded in the Roadway Characteristics Inventory (RCI).
TCI TRAFFIC CHARACTERISTICS INVENTORY — A database maintained by TranStat which contains both historical and current year traffic count information including AADT and the traffic adjustment factors, K, D, and T.
TPO TRANSPORTATION PLANNING ORGANIZATION
TRAFFIC VOLUME COUNT — Any short-term count taken by a portable axle counter on a roadway.
TranStat TRANSPORTATION STATISTICSOFFICE — The FDOT Central Office in Tallahassee that monitors and reports statistical traffic information for the State Highway System.
TTMS TELEMETERED TRAFFIC MONITORING SITE — Automatic Traffic Recorders that are permanently placed at specific locations throughout the state to record the distribution and variation of traffic flow by hour of the day, day of the week, and month of the year, from year to year, and transmit the data to the TranStat Office via wireless communication.
TRUCK — Any heavy vehicle described in FHWA Classification Scheme F (see Figure 2.2), Classes 4-13; i.e., buses and trucks with six or more tires. Class 14 is available for state definition of a special truck configuration not recognized by Scheme F. At the present time, only Classes 1-13 (Classes 1-3 are motorcycles, automobiles, and light trucks) are used in Florida.
VALIDATION (MODEL) — An analysis of a travel demand forecasting model based on traffic count and other information. A validation is usually less extensive than a calibration.
CHAPTER 1
1.5 GLOSSARY - continued
VHT VEHICLE HOURS OF TRAVEL — A statistic representing the total number of vehicles multiplied by the total number of hours that vehicles are traveling. The VHT is most commonly used to compare alternative transportation systems. In general, if alternative “A” reflects a VHT of 150,000 and alternative “B” reflects a VHT of 200,000 it can be concluded that alternative “A” is better in that drivers are getting to their destinations quicker. (MODEL)
VMT VEHICLE MILES OF TRAVEL — A statistic representing the total number of vehicles multiplied by the total number of miles which are traversed by those vehicles. The VMT is used on a region-wide basis as a measure of effectiveness to compare system performance to other urbanized areas. (MODEL)
v/c
VOLUME TO CAPACITY RATIO — Either the ratio of demand volume to capacity or the ratio of service flow volume to capacity, depending on the particular problem situation. This is one of the six factors used to determine the level of service.WIM WEIGH-IN-MOTION — The process of estimating a moving vehicle's static gross weight and the portion of that weight that is carried by each wheel, axle, or axle group or combination thereof, by measurement and analysis of dynamic forces applied by its tires to a measuring device. (AASHTO)
WPA WORK PROGRAM — The five-year listing of all transportation projects planned for each fiscal year by FDOT, as adjusted for the legislatively approved budget for the first year of the program.
WPI WORK PROGRAM ITEM (First 6-digits of FPI)
1.6 BACKGROUND
Project Traffic Forecasting estimates are needed for Planning and Project Development and Environmental (PD&E) studies and construction plans which lead to construction, traffic improvements, and pavement design projects. A Project Traffic Report is routinely developed as part of most Project Development and Environmental Studies. Primary components of the report are supporting documentation related to the Project Traffic Forecasting Process and highway capacity and level of service (LOS) analyses.
CHAPTER 1
FDOT’s Roadway Plans Preparation Manual requires Project Traffic and its major parameters to be posted on the Typical Section sheets. This handbook supplements the information described in the Project Traffic Forecasting Procedure, Topic No. 525-030-120.
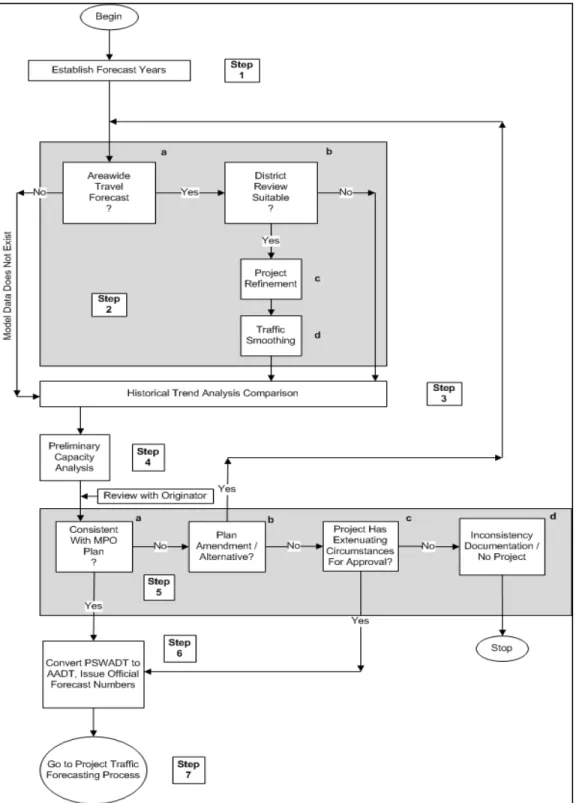
The Project Traffic Forecasting Procedure describes in detail the three forecasting processes which include Corridor, Project and Equivalent Single Axle Load (ESAL). Figure 1.1 outlines the relationship between Corridor Traffic Forecasting, Project Traffic Forecasting, and ESAL processes.
Corridor projects usually require the development of travel projections which are used to make decisions which have important capacity and capital investment implications. The traffic forecasting is required before establishing a new alignment or widening of an existing facility. The Corridor Traffic Forecasting Process is further detailed in Chapter 3 of this handbook.
The Project Traffic projections are commonly used to develop laneage requirements for intersection designs, and to evaluate the operational efficiency of proposed improvements. Project Traffic Forecasting is also required for reconstruction, resurfacing, adding lanes, bridge replacement, new roadway projects, and major intersection improvements. This process differs from Corridor Traffic Forecasting in that it is site specific and covers a limited geographic area. Further details may also be found in Chapter 3 of this handbook.
The Equivalent Single Axle Loading (ESAL) Forecasting Process is necessary for pavement design for new construction, reconstruction, or resurfacing projects. Truck traffic and damage factors are needed to calculate axle loads expressed as ESALs. The ESAL Forecasting Process is detailed in Chapter 8 of this handbook.
The four major types of construction projects are Preservation (resurfacing), Intersection Operational Improvements (add turns lanes), Roadway Capacity Improvements (add through lanes) and New Alignment Projects. Traffic operations projects such as signal
CHAPTER 1
timing, signal phasing and other non-construction type projects are not covered under this procedure.
Construction projects require both the Project Traffic Forecasting Process and the Equivalent Single Axle Load (ESAL) Process to be performed. Preservation Projects, which are usually resurfacing projects, only require the ESAL process to determine the appropriate Load Equivalency Factor for the pavement to be laid. Traffic Operation Improvements, such as improving shoulders or turn lanes and restriping roads are not covered under this procedure.
Corridor Traffic Forecasting and Project Traffic Forecasting projects require forecasts of Annual Average Daily Traffic (AADT) and Design Hour Volumes (DHV). AADT and DHV are related to each other by the ratio commonly known as the K-factor.
The overall truck volume and AADT are related to each other by the T-factor. The total impact of truck traffic on pavement design is expressed in units of ESALs, which represent truck axle weights converted into 18,000 pound (18-KIP) loads carried by a single, four-tire axle. The metric equivalent is 80,000 newtons .
CHAPTER 1
Traffic Forecasting Process
Figure 1.1
Traffic Forecasting Process
CHAPTER 1
1.7 TRUTH IN DATA PRINCIPLE
In accordance with the principle of “Truth-in-Data” principle for making project traffic forecasts is to express the sources and uncertainties of the forecast. The goal of the principle is to provide the user with the information needed to make appropriate choices regarding the applicability of the forecast for particular purposes. For the designer of the project, this means being able to compensate for uncertainty of, for example, projections of total pavement loading by using a reliability design factor. For the producer of the traffic forecast, it means clearly stating the input assumptions and their sources, and providing the forecast in a form that the user can understand and use.
1.8 PRECISION OF DATA
To reflect the uncertainty of estimates and forecast volumes (AADT, DHV and DDHV) should be rounded according to the current AASHTO rounding standards (AASHTO Green Book - A Policy on Geometric Design of Highways and Streets, 6th Edition, 2011).
Forecast Volume
Round to Nearest
0 to 999
10
1,000 to 9,999
100
>=10,000 1,000
CHAPTER 1
CHAPTER 2
CHAPTER TWO
TRAFFIC DATA SOURCES AND FACTORS
2.1 PURPOSE
Traffic data is the foundation of highway transportation planning and is used in making numerous decisions. Since accurate traffic data is a very crucial element in the transportation planning process, understanding and implementing the process accurately can lead to better design decisions. This chapter describes the following:
Types of traffic counting equipment used Traffic data collection methods used in Florida Seasonal Factors (SF)
Axle Correction Factors (ACF)
Annual Average Daily Traffic (AADT) Design Hour Factor (K)
Directional Distribution Factor (D) Truck percentages (T)
Estimating AADT
Existing Traffic Condition Information
2.2 BACKGROUND
The Florida Department of Transportation (FDOT) collects and stores a broad range of traffic data to assist highway engineers in maintaining and designing safe, state-of-the-art, and cost effective facilities. Traffic data is collected by the Central Office, Districts, local governments, and consultants. The traffic data collection efforts include traffic volume and vehicle classification counts, speed surveys, and truck weight and configuration measurements. TranStat is responsible for collecting, processing, and storing traffic data from the permanent count locations throughout the State of Florida. The Districts, using road tubes, permanent loop sensors, or other devices, are responsible for collecting traffic data throughout the District, editing the data and uploading the traffic data to the mainframe.
CHAPTER 2
2.3 TRAFFIC ADJUSTMENT DATA SOURCES
The continuous count and classification program is designed to collect vehicular and classification traffic counts 24 hours a day throughout the year. The portable seasonal classification program is designed to collect classification counts for a short term (24 to 72 hours). The various types of traffic monitoring sites used in Florida during 2011 are presented in Figure 2.1. In 2011, FDOT collected traffic count and traffic factor information at 12,416 sites throughout Florida.
2.3.1 Permanent Continuous Counts
The TranStat staff collects traffic data through permanently installed traffic counters located throughout the state. These Telemetered Traffic Monitoring Sites (TTMSs) continuously record the distribution and variation of traffic flow by hours of the day, days of the week, and months of the year from year to year and transmit the data daily to TranStat via wireless communications. Florida’s continuous count program has been expanded from the original 10 sites in 1936, to 278 sites. Presently, FDOT is working with local jurisdictions to obtain the data from their continuous counters and thus Florida will have over 350 permanent counters in operation. The permanent counters provide the user with day-to-day traffic information throughout the year. The traffic information collected is used to produce the AADT, K, and D for each permanent counter location.
Permanent traffic counters use inductive loops to detect vehicles and record the traffic volumes for each hour. A single loop is required to collect traffic volume data. Two loops are required to collect speed data. Two loops and an axle sensor are required to collect vehicle classification data, and one loop with two weight sensors (piezo or bending plate) are required to collect vehicle weight data.
There are several count sites throughout the state that have non-intrusive traffic counters that use microwave and magnetic sensors to collect volume counts.
2.3.2 Permanent
Continuous Classification Counts
FDOT has approximately 249 permanent continuous classification counters. The TranStat staff collects classification data based on the classification of the vehicle according to FHWA Scheme F (see Figure 2.2). In addition, TranStat has a Weigh-in-Motion (WIM) count program which collects vehicle classification and truck weights. These classification counts are collected daily and are used to produce AADT, K, D, and T.
CHAPTER 2
TRAFFIC MONITORING SITES IN FLORIDA
Figure 2.1 Florida’s Traffic Monitoring Sites Used in 2011to collect Traffic Counts and Adjustment Factors
2.3.3 Portable Seasonal Classification Counts
FDOT has approximately 4,150 locations where portable seasonal classification counts are performed. These Portable Traffic Monitoring Sites (PTMSs) are automatic traffic recorders that are temporarily placed at specific locations throughout the state to record the distribution and variation of traffic flow. Toll data is also collected to supplement volume counts. Seasonal classification counts are used to develop the axle correction factors and truck percentages during the year. These counts are performed one or more times a year (24-hour or 48-hour each) as deemed necessary to capture the seasonal truck variation. The classification counts will be used to estimate the axle correction factor and determine the percentage of trucks.
CHAPTER 2
CHAPTER 2
2.4 SHORT-TERM TRAFFIC COUNTS
These counts are primarily performed by the Districts, local agencies and consultants who are responsible for reporting counts using various portable traffic counting devices. These counts are collected using axle counters and/or vehicle counters.
Portable traffic counters frequently use rubber hoses that record by sensing the number of axles. These counters are small enough to be transported, contain a power source, internal clock, and may be easily secured to a telephone pole, fence post, sign post, tree, etc. All counters utilize electronic storage and require special software and/or hardware to download the collected data. The downloaded data can be transferred directly to a computer or may be printed in a report format. Another type of portable unit adheres to the road surface in the middle of a lane and uses magnetic vehicle detectors rather than axle sensors and records bumper to bumper length and speed in a variety of length and speed groups. The unit requires a special computer to download the data. Other technologies are continually being developed and tested.
2.4.1 Portable Axle Counters
Portable Axle counters are those that have a single rubber hose to sense axles. These counters simply divide the number of axles by two to derive a count.If the counting device measures the “number of axles,” an axle correction factor is assigned to the specific count location based on the trucking characteristics of that location. The axle correction factor is applied to the count and then the count is seasonally adjusted to produce AADT.
2.4.2 Portable Vehicle Counters
Examples of Portable Vehicle counters include microwave, magnetic, video, inductive loops, and vehicle classifiers. If the counting device counts the “number of vehicles,” the count site will not require an axle correction factor.
2.4.3 Seasonal Adjustments
All short-term counts must be adjusted to reflect the seasonal changes in traffic volumes. TranStat determines the Seasonal Factor Category using traffic data collected from permanent count locations. The Districts assign a Seasonal Factor Category to each short-term traffic count site. The basic assumption is that seasonal variability and traffic characteristics of short-term and permanent counts are similar.
CHAPTER 2
2.5 TRAFFIC ADJUSTMENT FACTORS
The two traffic adjustment factors, Seasonal and Axle Correction, are calculated by the TranStat Office and can be accessed through either the Traffic Characteristics Inventory (TCI) database or the Florida Traffic Online (FTO) application. Both TCI and FTO contain current and historical information. The continuous counts and the seasonal classification counts provide the necessary information to establish traffic adjustment factors. In the absence of any continuous counts within a county, TranStat borrows seasonal factors from adjacent counties and develops seasonal factors for those counties. These adjustment factors are later applied to the short-term counts to estimate AADT, K, D, and T.
2.5.1 Seasonal Factor (SF)
The Monthly Seasonal Factor (MSF) for a particular month in a particular location is derived from the Annual Average Daily Traffic (AADT) for a location divided by the Monthly Average Daily Traffic (MADT) for a specific month at that count site:
Weekly Seasonal Factors (SF) are developed by interpolating between the monthly factors for two consecutive months. The Seasonal Factors are calculated for each week of the year for each permanent count station and printed in a Peak Season Factor Report. Figure 3.7 shows an example of a Peak Season Factor Report showing the SF. The SF and Axle Correction Factors are used to convert ADT to AADT.
2.5.2 Axle Correction Factor (ACF)
The Axle Correction Factors are determined by using the data from continuous and portable classification counts following the guidelines as described in the FHWA Traffic Monitoring Guide.
CHAPTER 2
TRAFFIC COUNTS, SEASONAL FACTORS, AXLE
CORRECTIONS, AND ESTIMATED AADT, D, & T
* Traffic Adjustment Factors are assigned to each Short Term Traffic Count for every Section Break of the State Highway System
Figure 2.3
Process Used to Estimate AADT, D, & T
Actual AADT, D, and T data are measured at continuous counters. At all other locations, the AADT, D, and T are estimated. The data collected at the continuous count stations are used to develop the traffic adjustment factors: Axle Correction Factors, Percent Trucks, and Seasonal Volume Factors. These adjustment factors are applied to short-term traffic counts taken by portable axle and vehicle counters to estimate AADT, D, and T for every section break of the State Highway System.
CHAPTER 2
2.6 AADT, K, D, & T
For Project Traffic Forecasting purposes, the data collected on Florida's road system is used to measure the values identified as AADT, D, and T. AADT, and D are critical numbers which determine the geometric design of a road. T is the critical value for pavement design.
Throughout Florida, there are approximately 300 Telemetered Traffic Monitoring Sites (TTMSs) that collect data 365 days a year. For these TTMS sites, actual AADT, D and T are measured. This information provides a statistical basis for estimating AADT, D, and T for all other traffic counts where short-term traffic counts are obtained.
The Project Traffic Forecasting methodology uses information available from the following sources:
Traffic Characteristics Inventory (TCI) Database
Roadway Charateristics Inventory (RCI) Database (Feature 331) Florida Traffic Online Application (FTO)
Florida Transportation Information (FTI DVD) Annual Vehicle Classification Report (FTI DVD) 200th Highest Hour Traffic Count Report (FTI DVD)
CHAPTER 2
2.6.1 Annual Average Daily Traffic (AADT)
The Annual Average Daily Traffic (AADT) is the estimate of typical daily traffic on a road segment for all days of the week, Sunday through Saturday, over the period of one year. AADT is determined by dividing the total volume of traffic on a highway segment for one year by the number of days (365 days, except Leap Year which has 366 days) in the year. The AADT is the best measure of the total use of a road, because it includes all traffic for an entire year.
Average Daily Traffic (ADT) is obtained by a short-term traffic count. Short-term traffic counts are commonly referred to as “raw counts” or simply “traffic counts.” ADT is typically a 48-hour traffic count collected on Tuesday, Wednesday, and on Thursday. However, ADT can be based on the simple average of any short-term traffic count at least 24 hours long. 24-hour and 48-hour traffic counts are often taken to measure ADT and converted to AADT for traffic forecasting projects. For traffic forecasts, the Seasonal Adjustment Factor (SF) and Axle Correction Factor (ACF) should be used to convert ADT to AADT.
When the ADT is multiplied by the Seasonal Factor and Axle Correction Factor assigned to that site, it will provide a statistically accurate count for the entire year at that site known as AADT.
The following process ensures that data is consistent with design traffic criteria. AADT data are based on site specific counts, if available, and the Department's traffic count program. D is based from the median (average) of the200th Highest
Hour Traffic Count Report and T is based on the site specific classification counts, if available, and the Annual Vehicle Classification Report. K, D, and T values are available from the Department's Roadway Characteristics Inventory (RCI) and Traffic Characteristics Inventory (TCI) databases. If traffic counts for the project site are not available, obtain 24-hour (urban) or 48-hour (rural) classification counts to determine hourly traffic volume distribution and T factor. This will allow the identification of the peak hour of the day and the peak direction during that peak hour.Obtain existing turning movement counts from intersection studies or other resources during the identified peak hour.If these are not available, collect turning movement counts for major signalized intersections only using the procedure for Summary of Vehicle Movements described in the FDOT Manual on Uniform Traffic Studies, Topic No. 750-020-007.
CHAPTER 2
2.6.2 K
K is the proportion of AADT occurring in an hour. The K-Factor is critical in traffic forecasts because it defines the volume of traffic for which the road is designed to handle.
The K-factor is The Design Hour Factor. It is the ratio of the AADT that occurs during the design hourfor the design year. FHWA requires that K be used for all traffic projections used for design projects. It is important to know that the K-factor is descriptive; i.e., it represents the ratio of two numbers (as stated above). K values have been established statewide and should not be computed by using a mathematical equation. K is used to determine the Design Hour Volume (DHV). Traffic projections are expressed as AADT and Design Hour Volume (DHV). AADT and DHV are related to each other by the ratio commonly known as K, as expressed in the equation:
Capacity analysis focuses on the traffic monitored at an intersection or along a highway during a particular peak hour. The amount of traffic occurring during this hour is called the Design Hour Volume (DHV). K is the ratio of the DHV to the AADT.DHV is derived by multiplying the AADT by K (for the design year). The K-factors have been established statewide to represent typical conditions found around the state for area type and facility type during the weekday peak hour for areas with more than a population of 50,000. For the areas of less than a population of 50,000, the K-factors approximate the 100th highest hour of the year. The magnitude of the K-factor is directly related to the variability of traffic over time. Rural and recreational travel routes which are subject to occasional extreme traffic volumes generally exhibit the highest K-factors. The millions of tourists traveling on Interstate highways during a holiday are typical examples of the effect of recreational travel periods. Urban highways, with their repeating pattern of home-to-work trips, generally have lower K-factors.
CHAPTER 2
2.6.2.1 STANDARD K FACTORS
FDOT has decided to replace the K30 factors with Standard K factors. This has occurred because it has been widely recognized that roadways in urbanized areas cannot be cost effectively designed based on the 30th highest hour demand volumes. Another issue that impacts the use of the K factors is the relationship between demand traffic volumes and measured traffic volumes.
Standard K factors have been established statewide by using the data measured at the continuous count sites. The Standard K factors are based on area type and facility type with consideration to typical peak periods of the day.
For example, on freeways throughout the seven largest urbanized areas in Florida, the peak analysis period is used. For other facilities, the use of a typical peak hour is generally used. Standard K Factors for design analyses are not directly applicable for the Turnpike, other toll roads, and managed lanes. The recommended Standard K factors are reflected in the following Figure 2.4.
CHAPTER 2 Initially, Standard K factors should be used for analyses of points (signalized
intersections, interchange ramp terminals). The factors determined from the standard K process should be viewed as approach volumes to these points. Point analyses frequently involve balancing traffic flows and ensuring appropriate operational performance. For example, although it is appropriate for planning and preliminary engineering analyses to generally exclude sub-hourly traffic flow considerations (setting the PHF = 1.0), it is appropriate to use a lower PHF for operational analyses at points where capacity constraints may exist. In the design of left turn bays at signalized intersections or interchange ramp terminals, it would be appropriate to consider peak 15-minute flows if left turning vehicles may back up into through lanes, or operational concerns exist about vehicles backing up on freeway ramps/mainlines, respectively.
Special considerations exist in urban and urbanized areas; both are addressed in the footnotes of Figure 2.4. In the state’s largest urbanized areas, FDOT has designated “core” freeways; major, non-toll freeways going into/through the urbanized core areas (I-4 in the Orlando area). As these freeways pass through an urbanized area, the standard K factors generally range from 8.0% to 9.0%, depending upon proximity to the central core or central business district. Standard K factors for these freeways are set and typically updated decennially as part of the urban/urbanized area boundary process. A 7.5% K factor is applicable for state arterials and highways in approved Multimodal Transportation Districts, where secondary priority is given to auto vehicle movements. Essentially, this lower factor represents the promotion of a multi-hour peak period rather than a single peak hour analysis. Intersecting roadways that are non-state maintained will use the same K factor as the project roadway on the state highway system unless other values are derived from special counts.
2.6.3 D
The Directional Distribution (D) is the percentage of the total, two-way design hour traffic traveling in the peak direction. D, directional distribution, is an essential parameter used to determine the Directional Design Hour Volume (DDHV). The DDHV should be the basis of geometric design.
A highway with a high percentage of traffic in one direction during the design hour may require more lanes than a highway having the same AADT but with a lower percentage. This percentage of traffic in one direction is referred to as Directional Distribution (D).
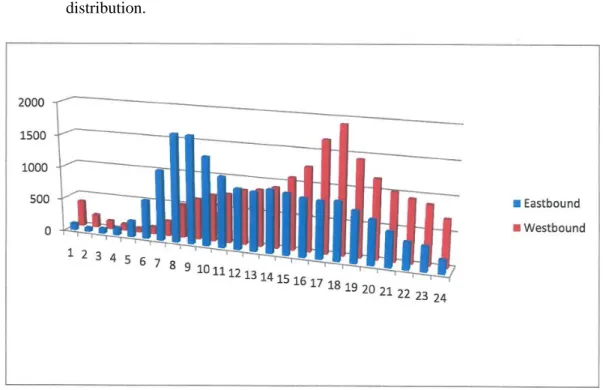
During any particular hour, traffic volume may be greater in one direction than the other. An urban route, serving strong directional demands into the city in the morning and out of it at night, may display an imbalance in directional flows. Figure 2.5 illustrates the directional distribution on US 192 in Lake County.
CHAPTER 2 Directional distribution is an important factor in highway capacity analysis. This
is particularly true for two-lane rural highways. Capacity and LOS vary substantially based on directional distribution because of the interactive nature of directional flows on such facilities. Queuing, slowness of traffic, land use impact and capacity are some of the considerations which affect the directional distribution.
Figure
2.5
Traffic
Volume
Directional
Distribution,
US
‐
192,
Site
110470
Although there is no explicit consideration of directional distribution in the analysis of multilane facilities, the distribution has a dra