Supporting Information
Structural and Biochemical Characterization of a Copper-Binding mutant of the
organomercurial lyase MerB: Insight into the key role of the active site aspartic acid in
both Hg-carbon bond cleavage and metal binding specificity
.
.
Haytham Wahba
†,§, Lauriane Lecoq
†, Michael Stevenson
||, Ahmed Mansour
†, Laurent
Cappadocia
†, Julien Lafrance-Vanasse
†, Kevin J. Wilkinson
‡, Jurgen Sygusch
†, Dean E. Wilcox
||,
and James G. Omichinski*
,††
Département de Biochimie et Médicine Moléculaire and
‡Département de Chimie, Université de
Montréal, Montréal, QC, Canada
§
Faculty of Pharmacy, Beni-suef University, Beni-suef, Egypt
||Department of Chemistry, Dartmouth College, Hanover, NH, U.S.A.
*Correspondence:
James G. Omichinski, Département de Biochimie et Médicine Moléculaire, Université de Montréal C.P. 6128 Succursale Centre-Ville, Montréal, QC H3C 3J7 Canada. E-mail: [email protected]; Telephone: 514-343-7341
Inventory of supporting information:
Figure S1 related to Figure 1: Sequence alignment of MerB.
Figure S2 related to Figure 1: UV-visible absorption spectra of
B. megateriumMerB2 and
E.
coli
MerB mutants.
Figure S3 related to Figure 2: Copper is bound in crystals of D99S MerB.
Figure S4 related to Figure 3: Comparison of the active site of the MerB D99S-Cu and MerB
D99S-Hg complexes.
Figure S5 related to Figure 4: Structure of
B. megateriumMerB2-Hg complex.
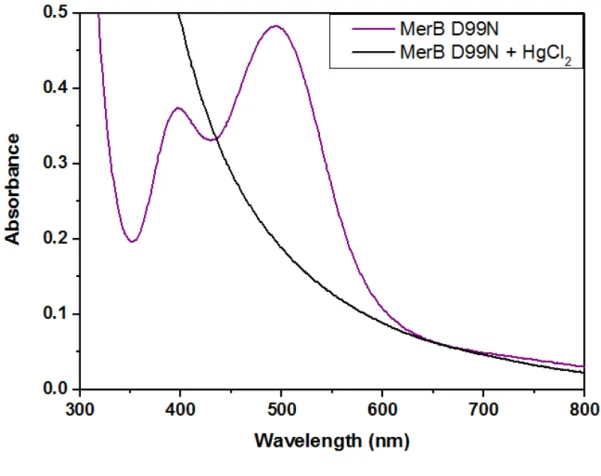
Figure S6 related to Figure 5: UV-visible absorption spectra of MerB D99N variant.
Supporting Figures:
Figure S1. Sequence alignment of MerB. Eight representative MerB sequences were taken from the ClustalW alignment and the alignment highlights the conservation within residues 85-107 of E. coli MerB including C96 and D99. The two residues are conserved in all known MerB sequences with an exception of four variants that contain a serine instead of an aspartic acid residue in the equivalent of the D99 position in E. coli MerB.
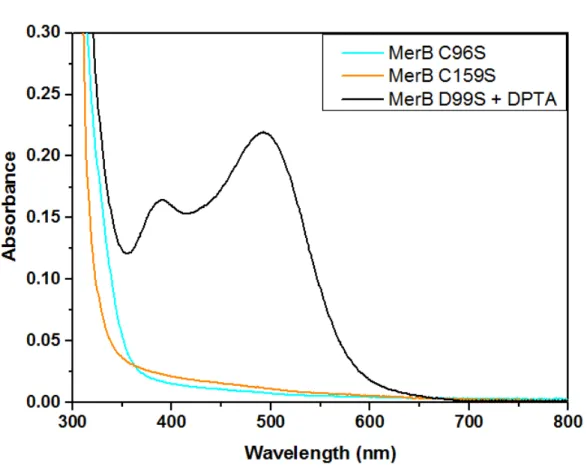
Figure S2. UV-visible absorption spectra of E. coli MerB mutants. The UV-vis spectra were taken with 0.5 mM solutions of MerB C96S (cyan), MerB C159S (orange) and MerB D99S after treatment with 5mM DTPA (black).
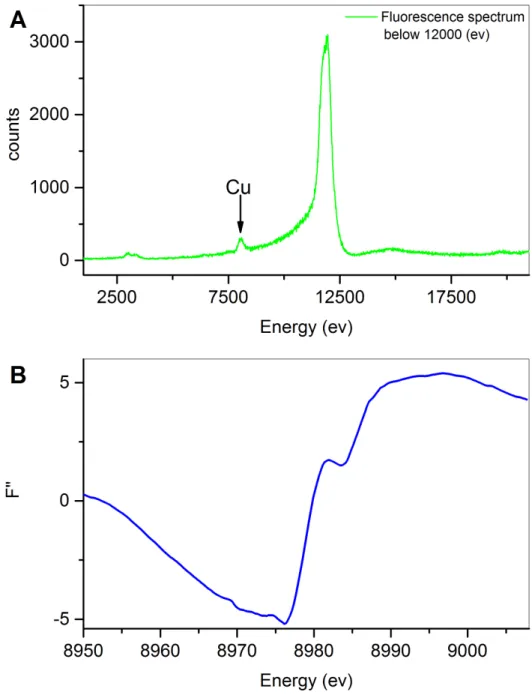
Figure S3. Copper is bound in crystals of MerB D99S. A) The fluorescence spectrum below 12000 (ev) shows the presence of copper in crystals of MerB D99S. B) The X-ray fluorescent spectra showing the edge for copper.
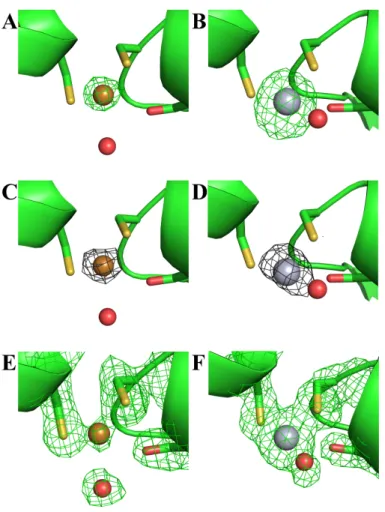
Figure S4. Comparison of the active site of the MerB D99S-Cu and MerB D99S-Hg complexes. A close-up of the Fo-Fc simulated annealing omit map of the active site displaying the positive density for the Cu and Hg ions in the MerB D99S-Cu complex (A) and the MerB D99S-Hg complex (B). The positive electron density (green mesh) in A and B is contoured at 3σ. In C and D, a close-up of the anomalous difference map (dark grey mesh) of the active site contoured at 3σ showing the anomalous peak for the Cu and Hg ions in the MerB D99S-Cu complex (C) and MerB D99S-Hg complex (D). The anomalous peak height for copper is 7.1 (data collected at Cu edge, wavelength 1.37Å) and 16 for mercury (data collected at 1.07Å). In E and F, close up of the Fo-Fckick omit map (green mesh) of the active site of the MerB D99S-Cu complex (E) and the MerB D99S-Hg complex (F) contoured at 2σ. The occupancies of C96, S99 and C159 as well as that of the ions and bound water molecules were set to zero prior to calculating the Fo-Fc map. Phenix map was used to generate the kick omit map calculation. The backbone of MerB D99S is displayed in ribbon form (green) and the side chains of the three active site residues are displayed in stick form with the sulfur atoms (yellow) of C96 and C159 and the oxygen atom (red) of S99. The copper (copper) and mercury (grey) ions are represented as spheres. A molecule of
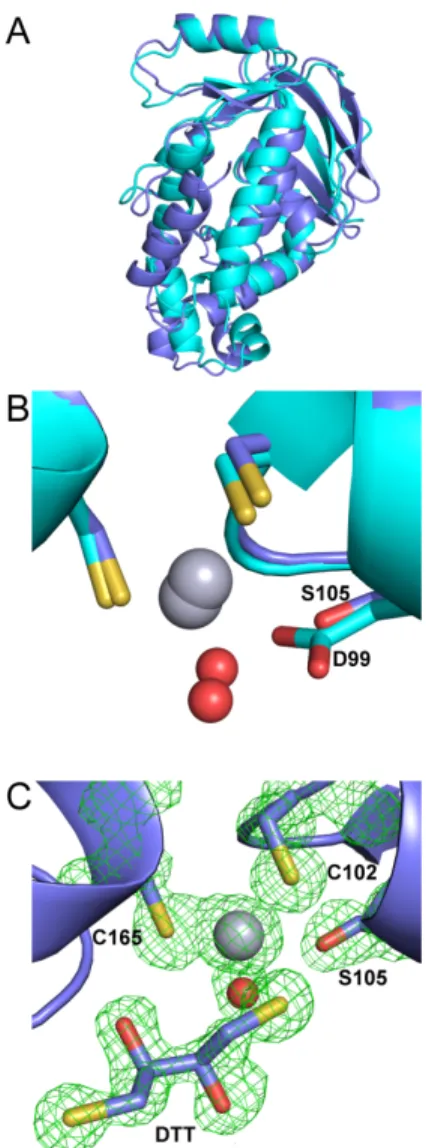
Figure S5. Structure of B. megaterium MerB2-Hg complex. A) Overlay of the structure of the B.
megaterium MerB2-Hg complex (blue) with the structure of the E. coli MerB-Hg complex (aqua; PDB
entry 3F0P). B) Overlay of active site of the B. megaterium MerB2-Hg complex with the active site of the MerB-Hg complex. The backbone of B. megaterium MerB2 (blue) and E. coli MerB (aqua) are displayed in ribbon form, and the side chains of the three active site residues are displayed in stick form with the sulfur atoms (yellow) of C102 and C165 and the oxygen atom (red) of S105. The mercury (grey) ion and the bound water (red) molecule are represented as spheres. C) Close up of the Fo-Fc kick omit map (green mesh) of the active site of the B. megaterium MerB2-Hg complex contoured at 3 σ. The occupancies of C102, S105 and C165 as well as that of the Hg ion and the bound water molecules were set to zero prior to calculating the Fo-Fc map. The backbone of B. megaterium MerB2, the key elements of the active site are
Figure S6.UV-visible absorption spectra of MerB D99N variant. UV-vis spectra were taken with 0.5 mM solutions of MerB D99N (violet) and MerB D99N following addition of HgCl2 (black).
Figure S7NMR spectra of MerB D99N. Comparison of the 2D 1H-15N HSQC spectra of 15N-labeled