doi:https://doi.org/10.15407/fm24.03.442 © 2017 — STC “Institute for Single Crystals”
The novel method for LAI inversion using Lidar
and hyperspectral data
Zuowei Huang
1, Feng Liu
2,Guangwei Hu
11
School of Architecture and urban planning, Hunan University
of Technology , Zhuzhou 412008,China
2
School of Geosciences and Information-Physics,Central South
University,Changsha 410083,China
Received January 25, 2017
For inversion of Leaf area index (LAI) in large scale, it is of great significance to integrate space-borne Lidar and optical remote sensing data effectively. In order to improve the estima-tion precision of leaf area index, an analyzing method based on Lidar and hyperspectral data was proposed. Through the processing of Lidar (Light Identification Detection and Ranging) and hyperspectral data, the LAI estimation model was established based on statistic analysis method in the study area. The results showed that the Lidar and hyperspectral data joint inver-sion model which considers the optical remote sensing of biophysical parameters can provide good estimates of LAI inversion, shows high accuracy (R2=0.8948, RMSE=0.2120),which reveals the great potential to enhance the accuracy of LAI estimation by using Lidar and hyperspectral data.
Keywords: LAI, Lidar, Hyperspectral data, Spectral unmixing, data inversion
В целях повышения точности оценки индекса площади листа (LAI) был предложен метод анализа, основанный на лидарных и гиперспектральных данных. Посредством обработки LIDAR данных и гиперспектральных данных была разработана модель оценки LAI на основе метода статистического анализа. Результаты показали, что модель инверсии совместных данных LIDAR и гиперспектральных данных, которая учитывает оптическое дистанционное зондирование биофизических параметров, может обеспечить хорошие оценки инверсии LAI и обеспечивает высокую точность (R2 = 0,8948, RMSE = 0,2120). Данная методика показывает возможности для улучшения точности оценки LAI с использованием LIDAR гиперспектральных данных. Новий метод оцінки індексу площі листа з використанням лідальних та гіперспектральних даних. Zuowei Huang, Feng Liu,Guangwei Hu
В цілях підвищення точності оцінки індексу площі листа (LAI) запропонувався метод аналізу, який базується на лідальних та гіперспектральних даних. За допомогою обробки LIDAR даних і гіперспектральних даних була розроблена модель оцінки LAI на основі методу статистичного аналізу. Результати показали, що модель інверсії спільних даних LIDAR і гіперспектральних даних, яка враховує оптичне дистанційне зондування біофізичних параметрів, може забезпечити хороші оцінки інверсії LAI, забезпечує високу точність (R2 = 0,8948, RMSE = 0,2120). Дана методика показує можливості для поліпшення точності оцінки LAI з використанням LIDAR гіперспектральних даних.
1. Introduction
As we all know ,The forest resource is one of the most important natural resources, and plays an important role in the sustainable development of mankind [1]. Leaf area index (LAI) is defined as the single-side leaf area per unit ground area, which is an important bio-logical parameter reflecting crop growing, pro-viding structured quantitative information for describing the procedure of matter and energy exchange on plant canopy surface [2,3].
Light Detection And Ranging (LIDAR) is a new emerging active remote sensing technol-ogy in recent years, which has developed very rapidly in the world. Lidar can measure both the vertical and horizontal structure of forested areas effectively with high precision and it can accurately estimate tree height, canopy closure and above-ground biomass [4,5]. Considering their ultra narrowband design, the spectral re-sponses of hyperspectral sensors are more sen-sitive than wide-band multi-spectral data, thus enabling the efficient estimation of canopy bio-physical parameters and chemical parameters well, Therefore, these sensors can be success-fully used for LAI inversion[6-8].Considering the topography and complex canopy charac-teristics of high-coverage forests,tree species mapping using optical remote sensing data re-mains difficult [9-10]. The traditional methods of forest parameters measurement have some limitations in large scale. Due to the direct measurement capability with high precision on the forest vertical structure.Lidar technology shows unsurpassed advantages in the measure-ment over this parameters [11]. Lidar sensor measures a target by actively transmitting an electromagnetic wave of a certain wavelength. These signals can penetrate the leaves of a can-opy as well as tree trunks to reach the ground. The sensor receives a certain amount of light through reflection and scattering [12,13].The distance from the sensor to ground samples can be calculated by measuring the time delay between the laser return pulses of the ground samples relative to the main wave to measure the surface fluctuation, and then obtain the vertical information of it [14]. Therefore,Lidar data are often used for the inversion of forest vertical structural information in forestry [15].
One of the most significant issues in remote sensing image processing fields is developing methods for dealing with mixed pixels [16]. Meanwhile, in many remotely sensed image application fields, land surface parameters are needed to be estimated in the sub-pixel level [17]. However, due to the limitations of spatial resolution and the complexity and diversity of the various types of surface features, images,
in addition to pure pixel, there may exist a mix-ture that contains a variety of surface feamix-tures pixel, and thus can not achieve the accuracy of remote sensing applications [18]. Endmember extraction is the most important and compli-cated procedure in spectral unmixing especial-ly. Spectral unmixing can acuqire the appropri-ate endmembers and abundances according to minimizing the Residual Sum of Squares [19].
Based on the physical structure of the ground component, this study developed the linear mixture model for LAI estimation. It could not only deal with the difficulty of Spec-tral discrimination (such as “the same thing with different spectrum, and the same spec-trum but different thing”), but also was simple, feasible, and general [20]. Two main methods which establish the relationships between LAI and satellite observed spectral canopy reflec-tance are widely used for LAI retrieval from re-mote sensing data, including vegetation index-based empirical regression method and physi-cal model-based method [21,22] .Lefsky, et al. (2001) pointed out that in spite of the laser ra-dar being sample data, it will greatly enhance the forestry measurement by integrating other grid remote sensing data owing to the very high precision [23].
2 Study Method 2.1 Theoretical principle of LAI
Lidar launches a pulse in a short time. When meeting obstacles, the pluse will return. If the return energy is larger than the thresh-old of the system, the system will record it as one point. Point cloud intensity is influenced by many factors, such as reflectance of the target, target-sensor distance, scanning zenith angle, and atmospheric condition. The base prin-ciple is shown in Fig.1, (a) is multiple echo of point cloud. Fig.1 (b) is full waveform diagram. Fig.1 (c) is digital waveform diagrams.Relative to the discrete point cloud data, the waveform
Fig.1 The schematic diagram of multi-echo and full waveform
data can stored all the echoes returned laser pulses, which play an increasingly important role in the later analysis.
In order to evaluate the precision of leaf area index (LAI), reflectance data were collected with ASD at two sampling sites, vegetation in-dices were applied to regress against LAI, can-opy reflectance were transformed with wavelet analysis, and extracted wavelet energy coeffi-cient were applied in regression model for LAI estimation. transforming the point cloud into grid, when there have multiple points, using the max value as the pixel-value. then getting 0.8 m resolution DSM. After extracting valid waveforms data, smoothing filtering was real-ized by using a gauss filter which width was the same as the laser pulse width . The background noises in the beginning and end of phase were estimated using the histogram method (Sun,et al., 2008) and the features parameters (mean value and standard deviations) were also calcu-lated. Then the waveform was fitted effectively by Levenberg Marquardt nonlinear method, and the wave peak position of the ground and forest canopy was determined by gauss wave decomposition (Dong, 2008)
The vertical structural information obtained by Lidar data, which helps in removing the in-terferences of forest gaps and other non-forest pixels as well as in extracting the canopy sub-sets. In addition, training samples can be eas-ily extracted at a certain tree height of differ-ent species in the spectrum space. Therefore, based on the canopy subsets as well as the com-bined spectral differential and curve matching techniques, an automatic extraction method of training samples is realized. DEM is gener-ated using TIN interpolation method with the ground point data classified. Then, the eleva-tion values of vegetaeleva-tion points are normalized by DEM to remove the terrain elevation, so that the height values of vegetation points are the heights relative to the ground.
2.2 Mixed pixel decomposition
Mixed pixel decomposition is the most effec-tive method to solve the mixed pixel problem, LSMM is one of the mixed decomposition model that been applied most extensively,it mainly includes four parts (Fig.2): Data Preprocessing, Endmember Extraction, Abundance Estima-tion and Accuracy Assessment, which can be described as by using linear mixed model:
x A Si i AS i p = + = + =
å
1 ε ε (1)where p is the number of the endmembers, A is the endmember matrix of n´m , its every col-umn is endmember vector of image, called end-member spectral set, S is the component ratio
of endmember composition for every pixel, Ai and Si is the i-th endmember and mixing pro-portion, respectively, and ε represents the ran-dom noise term. In terms of the physical signif-icance, Eq.(1) expresses that in hyperspectral image, any pixel vector can be expressed as a combination of n-dimension component ratio by
n-dimension endmember vector, its mathemat-ical meaning is a product of matrix A consist-ing of m Ч n dimension endmember vector and vector s consisting of m-dimension component ratio. There are two constraints for the abun-dance vector : non-negativity constraints (ANC, Abundance Non negativity Constraint, si ≥ 0,
i = 1,2,..., p) and as a Constraint.
How to dynamically optimize endmember spectral set A needs to solve three problems: (1) Confirm the principle ofthe most probable vector in image; (2) selecting the algorithm of the endmember vector; (3) Adaptively obtain the principle of the number of endmember vec-tors. The algorithm is shown as below:
1.Estimate or assign the number of endmem-bers within the image data: For a predefined number of endmember p, Using the dimension reduction methods, Principal Component Anal-ysis (PCA) was applied on the original hyper-spectral image data to reduce the dimensions from N to p−1;
2. Exhaustion search: for any monomer is com-posed by pixel spectral vector (number p),Select the pixels randomly as the initial endmembers, and calculate the simplex volume V1 that com-posed of these initial endmembers. The math-ematical definition of the volume is :o
Fig.2. The processing of Mixed pixel decomposi-tion
V A A A p A A A p p ( , ,..., ) ( ) ! det ... ... ' ' ' 1 2 1 2 1 1 1 1 1 = = -é ë ê êê ù û ú úú (2) Where Ai(i = 1,2,...p) is the p–1 dimensional column vector for the i-th endmember. Look-ing for the monomer volume biggest vector sets
{A A*, *,...,A*}
p
1 2 , its expression can be present-ed as below: { , ,..., } arg max , ,..., ( , ,..., ) * * * A A A A A A V A A A p p p 1 2 1 2 1 2 = =
{
}
ì í ïïïï î ïïï ü ý ïïï þ ïïï (3) 3. Estimating the candidate endmember set E at a certain probability level, Initialization the endmember by selecting p endmembers ran-domly from E; Evaluate an image pixel by re-placing one pixel in the represent endmember set with the image pixel P1, producing a“trial enemember” set and calculate the new simplex volume V2. If V2>V1,replace the candidate ene-member with P1;At kth iteration, calculating the volume of the simplex defined by the following formula using the estimated endmember. 4.Iterating for maximization the volume of the simplex, Replace the other candidate enemem-bers with the pixel P, Execute the procedures (2) and (3) for all the other pixels repeatedly The simplex volume composed of the result endmembers is the largest one, and its ver-texes correspond to the endmembers. This pro-cess was repeated until no replacements were made.The above method, which can eliminate the correlation between the bands of Hyperspectral Image and increase the quality of endmembers, was employed to convert the Hyperspectral Im-age into principal components. According to the relationship between vegetation cover percent and LAI, we can extract LAI from the remote sensing imagery successfully. Moreover, the canopy model of multiple scattering was ap-plied to estimate the accurate LAI.
3 Study area and data 3 .1 Study area
The study area is the Longhui district lo-cated near Shaoyang City (Fig.3), Hunan Prov-ince in China, 6.5km from the city center, be-longs to the low mountain hilly terrain, with a typical hilly landscape and a significant tem-perate continental monsoon climate. The cli-mate in this region can be described as windy in spring, having high temperature and con-centrated rainfall in summer, cool in autumn.
The altitude is about 260-550m, and annual average relative humidity is 80% ,The frost-free period reaches 310-330d. The study area is about 9648Ha, Rich natural resources as well as complex and diverse vegetation community types are found in the region, which mainly composed of artificial forest and secondary natural forest. is dominated by red pine, Pinus sylvestris, Camellia oleifera, barley, and yellow pineapple, etc. Few roads stretching and resi-dents living here. the spatial distribution of the crown structure has important significance in forestry, it using ground-based light detection points cloud for crowns in the field. Five sam-ple areas of footprint in the study area were se-lected. Due to the foundations lidar instrument was heavily and hard to taken, these sample sites were all near the roads. Measurement was accomplished in two different directions (every 180°) in the 60 m Lidar footprint
3.2 Data acquisition
The Lidar data was acquired on May 31, 2015. The laser scanner is LiteMapper-5600, is developed by the German company IGI. with laser wavelength of 1550nm, and laser pulse length of 3.0 ns, and laser beam divergence of 0.5mrad. The hyperspectral data collected by the AVIRIS was acquired on August 23,2015 at the same district, it covers the spectral region from 0.4-2.5μm in 224 bands with a 10nm band width and a 20m spatial resolution. To improve the unmixing performance, we removed the low SNR bands, the abundance of the pixel in the data was created randomly, and in the mean-time, the abundances of each pixel fulfill the ANC and ASC was replaced by the pixels whose maximum abundance was larger than 0.8 with a mixture made up of all endmembers of equal abundances. To simulate possible errors and
sensor noise, it added zero-mean Gaussian noise to the mixture data. The image data was converted into the reflectance data using the ATREM method, the remnant error was mini-mized using the EFFORT method.
3.3 Data processing
Data processing flow is shown in Fig.4. Lidar data processing includes filtering classification, isolating laser surface topography subsets and distinguishing laser point data subsets of dif-ferent features from the point cloud data. This paper separated ground and non-ground points from the point cloud product through filtering methods such as iteration, isolated points and threshold with a Terrascan. A Digital Eleva-tion Model (DEM) was created by performing a Triangulated Irregular Network ( TIN) interpo-lation operation using the point cloud product that was already separated as ground points. point cloud data contain some noises, noise is commonly isolated points, it is detrimental for the subsequent inversion and it need to remove the noise points before processing. Noisy points can be divided into three categories accord-ing to their three-dimensional characteristics: isolated points are these points that no other point cloud points in their neighborhoods. Ex-treme high points, the Lidar points far higher from the nearby rough surface, usually caused by reflections of birds, low altitude airships or planes. Extreme low points, which are obviously lower than their adjacent ground Lidar points, are caused by multiple reflection of laser pulse
or system errors. The existence of extreme low points can lead to significant errors when inter-polating DEM or DSM ,a Digital Surface Model ( DSM) was generated by interpolating the first return points. CHM elevation-normalized data were obtained by conducting a grid difference calculation between DSM and DEM.
Method for LAI acquisition uses the Yao method (Yao, et al., 2010). the DSM of laser point cloud in study area is get. According the forest growth, we chose the sample from the other fields with similar growth conditions, and then measured the leaf area by SunScan to determine LAI Each sample has precise GPS positioning data. SunScan does not wait for the special weather conditions and it can work prop-erly in most light conditions. Hand-held termi-nal PDA is simple with large storage,which can meet the needs of large data measurement. Since the sensor using a wireless transmitting and receiving technology, it makes the mea-surement more convenient, quick access to the large area of forest region LAI. Wireless trans-mission range 250 m, the vegetation coverage of 100 to 200m, greatly improve the efficiency of forest LAI. The aircraft attitude maintenance was supported using GPS equipment of aircraft navigation, inertial measure unit (IMU) and global positioning system (GPS) of airborne la-ser radar.GPS synchronous obla-servation of high precision dynamic dual-frequency GPS receiv-er, the sampling frequency is 2HZ. GPS base station within 10 km radius of the surface. The track amendment, the aircraft’s pitch, the con-Fig.4 Data processing flow
trol of roll and lateral roll were able to achieve a high precision.
In the study area, numerous forest gaps are highly covered by low shrubs and grass, the spectrum characteristics of which are similar to certain forest pixels. The spectrum matching between the training and reference samples will be affected inevitably while the classifi-cation accuracy will be decreased when these pixels are mistakenly selected as the training samples. In addition, some similar objects have different spectra. The Hyperspectral image was then masked with three dimensional verti-cal structural information derived from Lidar, Therefore,the mutual interferences of the forest gaps and the tree species spectra with different heights were eliminated, and the extraction ac-curacy of the training samples correspondingly increased.
4 Algorithm and model
In the study, the plots are selected based on the LiDAR data coverage. According to the methods above, four circular plots data were collected, a few forest variables were calculated based on the investigated data. retrieve the fractional cover of forest by the grid. The test samples are used to validate and evaluate the accuracy of the models, and the best estimation model is selected. The LAI is inversed based on the best model. The experiment confirmed that Hyperspectral remote sensing images could express the spatial distribution and growth by estimating and monitoring LAI accurately and quickly within a large area. In study area, Pixel unmixing results is shown in Fig.5
For most of plants, the leaf area increases with the plant height during the vegetation growth. For different species and varieties of crops, the relationships of conversion between crop height , fraction of coverage and LAI was
proposed by Zhang (1996). Data classification and extraction of vegetation and ground point under different scales of a number of ground points and vegetation points. Finally calculate the laser radar penetration index and inversion calculation on LAI. The sampling data, LPI were calculated for each sample under various scales, LPI is laser penetrate index:
L k I I k LPI = -1 = -1 0 ln( ) ln( ) (4)
Where L stand for the leaf area index, I stands for the canopy light intensity, I0 is above the canopy light intensity, k is the extinction light coefficient, depending on the direction of the leaf inclination Angle and the beam of light, light beneath the canopy is available. LPI in-stead of I/I0, (1/LPI) containing the intercept of the regression analysis with the measured LAI,
Table1�� ����ela����� ��� ������ �e������ a���� ���el�� �ea����e�� ����� ����ela����� ��� ������ �e������ a���� ���el�� �ea����e�� �������ela����� ��� ������ �e������ a���� ���el�� �ea����e�� ���
LAI H50th H90th Hmean Hmax Hmin fgap LPI intensity
LAI 1.00 H50th –0.14 1.00 H90th –0.22 0.37 1.00 Hmean 0.19 0.12 -0.23 1.00 Hmax 0.24 0.17 –0.25 0.09 1.00 Hmin –0.25 0.16 –0.26 0.06 0.15 1.00 fgap –0.31 0.28 0.06 –0.38 –0.14 0.25 1.00 LPI –0.52 0.29 0.09 0.63 –0.05 –0.23 –0.08 1.00 intensity 0.43 0.16 0.08 -0.33 –0.18 –0.29 0.13 0.45 1.00 Fig.5.
inversion model based on the statistic analysis of the feature variables.
Found by different types of statistical regres-sion models, these models have highest estima-tion accuracy is 90 percent in all models, the exponential regression model is the best model, using the model to invert maize leaf area index of the area and analysis its growth and space distri-bution. It is feasible to quantitative estimate the LAI values in a wide range fast and accurately us-ing Hyperspectral remote sensus-ing image.
The feature variables of LiDAR include: can-opy height model (CHM), intensity ,the mean height (Hmean), the maximum height (Hmax), the minimum height (H min), the percentile of the canopy height distributions (H25th, H50th, H90th) and LPI. In order to establish the optimal mod-el of LiDAR-LAI prediction, it smod-elect a high cor-relation between LAI and LiDAR parameters, and extract the LiDAR vertical structure pa-rameters of the same location. and the mea-sured LAI values for correlation analysis, if the correlation coefficient absolute value is greater than 0.3, then select it as the input parame-ters, the Correlation of LiDAR metrics and field measured LAI results are shown in Table1.
According to the results of correlation analy-sis in table 1, then select the fgap ,intensity, LPI,
H90th as input variables for LiDAR-LAI estima-tion model. By the prior knowledge, LPI is in-versely proportional to LAI, The value is larg-er, the smaller the leaf area index, according to the penetration index Formula, vegetation canopy echo is large, forest canopy structure is complex, the smaller the LPI. LAI is larger, therefore the LPI is negatively correlated with LAI; The greater the of fgap vegetation, namely Coverage is lower, the smaller LAI; the inten-sity is larger Area, the larger LAI. the inteninten-sity of point cloud was positively related with LAI.
The above four LiDAR parameters as vari-ables, multiple regression model is established. Through regression analysis with the above
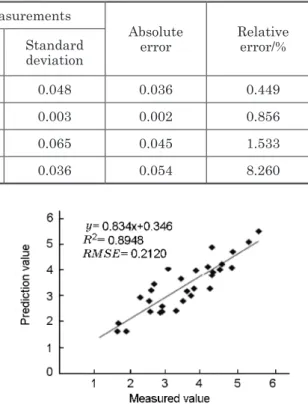
four LiDAR parameters, the inversion model was constructed by the regression model is de-picted as: LAI I f LPI pap = + - -- + 5 34 4 34 0 05 1 78 0 03 . . . . . H90th (5) Based on LiDAR_Pro,TerraScan,matlab200 9a,Erdas Imagine9.2,The system runs on Win-dows7 operating system. In order to quantita-tively evaluate the LAI result, contrasting the simulated data for the classic model, tests them in the same conditions, aiming to evaluate the results. It carries on the regression analysis and the measured LAI, calculate the value of cor-relation coefficient (R2) and root mean square error (RMSE), High R2 indicates the high cor-relation between variables and independent variables. Through the above inversion meth-od, Prediction results for prediction samples of the this model and Linear model is shown in Fig.6 ,it can be seen that the inversion result of forest coverage was consistent with the veg-etation distribution in Based on LiDAR_Pro,T erraScan,matlab2009a,Erdas Imagine9.2,The system runs on Windows7 operating system. In order to quantitatively evaluate the LAI result, contrasting the simulated data for the classic model, tests them in the same conditions, aim-ing to evaluate the results. It carries on the regression analysis and the measured LAI, cal-culate the value of correlation coefficient (R2) and root mean square error (RMSE), High R2 indicates the high correlation between vari-ables and independent varivari-ables. Through the above inversion method, Prediction results for prediction samples of the this model and Lin-ear model is shown in Fig.6 ,it can be seen that the inversion result of forest coverage was con-sistent with the vegetation distribution in the study area. Comparisons of LAI between those derived from Lidar and field measurements ( Table.2), it is showed that the LAI of Lidar and Fig.6 Prediction results for prediction samples of the this model and Linear model
filed data agree well, and only that the 3th plot has a relative large error. The retrieval error of fractional cover will transfer to LAI. Results show that based on airborne and spaceborne LiDAR data LAI inversion accuracy is higher than that of the corresponding optical remote sensing inversion accuracy.
Based on LiDAR_Pro,TerraScan,matlab200 9a,Erdas Imagine9.2,The system runs on Win-dows7 operating system. In order to quantita-tively evaluate the LAI result, contrasting the simulated data for the classic model, tests them in the same conditions, aiming to evaluate the results. It carries on the regression analysis and the measured LAI, calculate the value of cor-relation coefficient (R2) and root mean square error (RMSE), High R2 indicates the high cor-relation between variables and independent variables. Through the above inversion method, Prediction results for prediction samples of the this model and Linear model is shown in Fig.6 ,it can be seen that the inversion result of for-est coverage was consistent with the vegetation distribution in the study area. Comparisons of LAI between those derived from Lidar and field measurements ( Table.2), it is showed that the LAI of Lidar and filed data agree well, and only that the 3th plot has a relative large error. The retrieval error of fractional cover will transfer to LAI. Results show that based on airborne and spaceborne LiDAR data LAI inversion ac-curacy is higher than that of the corresponding optical remote sensing inversion accuracy.
from Lidar and field measurements (Ta-ble.2), it is showed that the LAI of Lidar and filed data agree well, and only that the 3th plot has a relative large error. The retrieval error of fractional cover will transfer to LAI. Results show that based on airborne and spaceborne LiDAR data LAI inversion accuracy is higher than that of the corresponding optical remote sensing inversion accuracy.
In order to evaluate the reliability of this in-version method, using leave-one-out cross-vali-dation method, predicted LAI was evaluated by using 30 measured LAI data, it was showed that the determination coefficient is 0.8948,the
Tab. 2 Comparisons of LAI between those derived from Lidar and field measurements Plots
Lidar results Field measurements
Absolute
error Relative error/% Average dev`iationStandard Average Standard deviation
1 0.324 0.256 0.046 0.048 0.036 0.449
2 0.342 0.036 0.678 0.003 0.002 0.856
3 0.257 0.132 0.633 0.065 0.045 1.533
4 0.323 0.022 0.418 0.036 0.054 8.260
root mean square error is 0.2120 towards mea-sured value and predicted values(Fig.7), it found that the results of forest LAI joint inver-sion model was consistent with the distribution of forest type map. Hence, these results can be better applied to the quantitative inversion of LAI parameters.
5 Conclusion
LAI is a critical parameter in process-based models of vegetation canopy response to global environmental change, for numerous studies of interaction of atmosphere and vegetation, rap-id, reliable and objective estimations of LAI are essential. It is feasible to quantitative estimate the LAI values in a wide range fast and accu-rately using Hyperspectral remote sensing im-age. The study about monitoring food crops us-ing remote sensus-ing in theories and applications is promoted, and the basic theories of monitor-ing and assessmonitor-ing LAI are supplied by it. In the case that remote sensing becoming more popular, the LiDAR technology has increas-ingly being used in the forestry as a new means of remote sensing. Many researchers have fo-cused on LAI estimation using LiDAR data and explored the method of LAI retrieval based on LiDAR data and Hyperspectral data. In the future, Lidar will have extensive applications for precision agriculture and other agricultural production. In subsequent studies,other
tech-Fig.7 The relationship of measured value and Predicted value
niques for feature extraction will be tested to increase the LAI retrieval value, Results show that retrieving fractional cover and LAI with high accuracy and resolution is possible using the Lidar data and Hyperspectral data. In the future, Lidar will have extensive applications for precision agriculture and other agricultural production.
Acknowledgment
This work is supported by Natural Science Fund of Hunan Province(2017JJ2072)
References
1�� Jianxi Huang, Yuan Zeng, Andres Kuusk et al.,
Int. J. Rem. Sens., 32(22), 7591, 2011.
2. Zhiqiang Xiao, Shunlin Liang, Jindi Wang, et al., Rem. Sens. Environ., 115, 97, 2011
3. Sprintsin M, Cohen S, Maseyk K, et al., Agric For Meteorol, 151(5), 565, 2011.
4. Majasalmi T, Rautiainen M, Stenberg P, et al.
Agric For Meteorol, 154/155(3), 38, 2012. 5. Kauwe M G, Disney M I, Quaife T, et al., Rem.
Sens. Environ., 115(2), 767, 2011.
6. Gonzalez-Sanpedro M C, Toan T L, Moreno J, et. al., Rem. Sens Environ, 112(3): 810, 2008.
7. Zhang L P and Huang X., J. Rem. Sens., 13(4), 559, 2011.
8. Zhong J Q and Wang R S. J. Rem. Sens., 27(10): 2055, 2006.
9. Bruzzone L, Chi M, Marconcini M. A,, IEEE Trans. Geoscie. Rem. Sens., 44(11), 3363, 2006. 10. Chen Chong, Zhu Yanjun, Li Xianfeng, et al.
Acta Agricul. Univ. Jiangxiensis, 33(3), 508, 2011.
11. Brantley S T, Zinnert J C, Young D R., Rem. Sens Environ, 115(2), 514, 2011.
12. Cheng Q, Huang J F, Wang R C and Tang Y L,
Trans. Chinese Soc. Agricult. Eng., 19(5),104, 2013.
13. Clevers J G P W., Rem. Sens Environ, 29(1), 25, 2012.
14. Morsdorf F, Frey O, Meier E, et al., Int. J. .Rem. Sens.,29(5), 1387, 2008.
15. Pang Y, Zhao F, Li Z Y, Zhou S F, Deng G, Liu Q W and Chen E X., J. Rem. Sens., 12(1), 152, 2008.
16. Zeng Q H, Mao J H, Li X H and Liu X F. 2008.
Geomat.Inform. Scienc. Wuhan Univ.,33(1), 25, 2008.
17. Zhang Y, Meng Q Y, Wu J L, Zhao F., Spectr. Spectr.Anal.,31 ( 10 ), 2789, 2011.
18. Zeng Q H, Mao J H, Li X H, Liu X F., Geom.. Inform. Scien. Wuhan Univ., 33(1), 25, 2008.. 19. Madugundu R, Nizalapur V, Jha C S., Int J Appl
Earth Obs Geoinf, 10(2), 211, 2008.
20. Potithep S, Nagai S, Nasahara K N, et al., , Ag-ric For Meteorol, 169(2), 148, 2013.
21. Zarate-Valdez J L, Whiting M L, Lampinen B D, et al., Comput Electron Agr, 85(1), 24, 2012. 22. Luo Shezhou, Cheng Feng, Wang Fang, et al.
Rem. Sens. Techn. Appl., 27(5), 740, 2012. 23. Heiskanen J, Rautiainen M, Korhonen L, et al.