MULTI-OBJECTIVE RELIABILITY BASED DESIGN OF COMPLEX
ENGINEERING STRUCTURES USING RESPONSE SURFACE
METHODS
LUIS CELORRIO¹, EDOARDO PATELLI² ¹Mechanical Engineering Department, University of La Rioja
C/ San José de Calasanz 31, 26004 Logroño, Spain
[email protected], www.unirioja.es
²Institute for Risk and Uncertainty, University of Liverpool Peach Street, Chadwick Building, Liverpool L69 7ZF, UK
Key words:Multi-objective optimization under uncertainty; Surrogate model; Decision Maker; OpenCossan.
Abstract. Extensive research contributions have been carried out in the field of Reliability-Based Design Optimisation (RBDO). Traditional RBDO methods deal with a single objective optimisation problem subject to probabilistic constraints. However, realistic problems in engineering practice require a multi-criteria perspective where two or more conflicting objectives need to be optimised. These type of problems are solved with multi-objective optimization methods, known as Multi-Objective Reliability Based Design Optimization (MORBDO) methods. Usually, significant computational efforts are required to solve these types of problems due to the huge number of complex finite element model evaluations. This paper proposes a practical and efficient approach based for talking this challenge. A multiobjective evolutionary algorithms (MOEAs) is combined with response surface method to obtain efficiently, accurate and uniformly distributed Pareto front. The proposed approach has been implemented into the OpenCossan software. Two examples are presented to show the applicability of the approach: an analytical problem where one of the objectives is the system reliability and the classic 25 bars transmission tower.
1 INTRODUCTION
Design optimisation represents the set of techniques used to obtain the most economical engineering design while satisfying specified constraints. Traditionally, this problem has been formulated as a constrained optimization problem with only one objective: the cost of the structure, and several constraints, called limit states or performance functions. Usually, these constraints are written in terms of stresses or displacements in significate points. Design problems encountered in realistic professional practice involve highly non-linear objective and constraints. For this reason, advanced gradient-based algorithms such as, e.g. sequential quadratic programming usually present convergence problems since they might be trapped into
metaheuristics algorithms have been applied for solving non-linear and complex design problems.
Recently, new design codes are being developed with the goal of providing a more sustainable world for the future generations. These new design codes propose constraints about the environmental and social impact in the designs. Consequently, realistic design problems are formulated as multiobjective optimization problem subject to several constraints. Hence, designers and decision makers have to face the problems of conflicting objectives functions. For example, they want to minimise the cost of the structure, and at the same time the probability of failure of such structural system, as well as reducing the environmental and social impact. Instead of having a predefined weights or preference for those objectives, they rather prefer to identify a set of optimum solutions forming the so called Pareto front. Then, the final design is selected by taking into account the trade-off between objective functions.
In addition, material properties, geometric dimensions and loads are not known exactly and affected by variability. The variability of such quantities needs to be considered in the structural design phase in order to avoid failure. Traditionally, the theory of probability is used to model the parameter uncertainty. Hence, design variables and parameters are random variables and deterministic constraints are transformed in reliability constraints. Then, each reliability constraint stablishes an admissible probability of failure for each limit state or performance function.
The problem where a single objective function is optimized subject to reliability constrains is named Reliability Based Design Optimization (RBDO) problem. The group of techniques to solve multiobjective optimization problems subject to reliability constraints is named Multi-Objective Reliability Based Design Optimization (MORBDO). Multiobjective Optimization Evolutionary Algorithms (MOEAs) have been adapted to solve MORBDO problems. Non-dominated Sorting Genetic Algorithm (NSGA-II) [1] and Multiobjective Particle Swarm Optimization (MOPSO) [2] are the most frequent MOEAs considered in the literature for solving MORBDO problems since these methods can handle constraints efficiently. In this work these MOEAs techniques have been applied in combination with OpenCossan software [3],[4], an open source and general purpose tool for uncertainty quantification. This toolbox contains metamodels capabilities, like Response Surface, Polyharmonic Spline, Kriging, etc. that replace the original mechanical model when the computational effort of the finite element calls is very large.
Most of the applications of MORBDO take place in automotive engineering and structural engineering. Sonha [5] proposed the MORBDO techniques to improve the automotive crashworthiness and occupant safety. In general, the crashworthiness performance improves if the energy absorption released in an impact increases. A reliability-based multiobjective optimization was proposed to reduce the structural weight and front door velocity in a side impact scenario. The NSGAII algorithm was applied for the multiobjective optimisation step and for the Reliability Index Approach in the reliability analysis phase. Nonlinear response surface was used as surrogate model to replace the computational expensive FE model. Optimal Latin Hypercube Sampling was used for generating the sample design points to fit the response surface.
Also, Zou and Mahadevan [6] considered an automotive engineering problem studying the door closing effort and wind noise quality issues. The method for the bi-objective optimization was chosen according to the specific requirements from the decision maker among three
methods: weighted sum, - constraint method and goal programming. Sun and co-workers applied MORBDO in vehicle crashworthiness design, e.g. in tailor rolled blank structures [7] and frontal rail structure [8].
2 FORMULATION OF A MORBDO PROBLEM
The mathematical formulation of MORBDO problems is as follows [DEB et al, IEEE, 2009]:
min , ( , , ), … , ( , , ) . . ( ( , , ) ≤ 0) < ,, = 1, … , ℎ ( ) ≥ 0, = 1,2, … , ≤ ≤ , ≤ ≤ (1)
where , … , represent the objective functions, , = 1, … , the performance functions, , the target probability of failure, ℎ the deterministic constraints, the deterministic design variables, the mean values of random design variables and the probabilistic parameters. In this formulation, component-level probabilistic constraints have been considered. However, the problem can include a system-level reliability constraint.
Often, decision makers want to know how the trade-off between costs and reliability is. They are interested in computing the associated cost for different values of probability of failure or reliability index. In order to answer this question, the same RBDO problem can be repeated several times by changing the value of the target probability of failure. Alternatively, they can formulate a special type of MORBDO where the first objective function represent the cost (as in the original function of the RBDO problem) and a second objective function that represents the probability of failure. Constraints about the probability of failure are added to discard extreme solutions. The mathematical formulation of this problem is:
min , ( , , ), ( , , ) . . ≤ < ℎ ( ) ≥ 0, = 1,2, … , ≤ ≤ , ≤ ≤ (2)
where is the system-level probability of failure, and are the lower and upper limit for the system level probability of failure. This formulation has been considered in this paper and NSGAII and MOPSO have been applied to solve this bi-objective optimization problem.
In order to illustrate the capability of the implemented algorithms, we show the results obtained in two examples. The first example consist of analytical example where the second objective is the probability of system failure. The second example considers a well-known 25 bars truss structure [9]. The computational effort necessary to solve this MORBDO problem is extremely high and to lighten it, metamodels are calibrated and validate to replace the responses of the original model, concretely, the nodal displacement of one of the upper nodes and the volume of steel.
3 NUMERICAL EXAMPLES 3.1 Analytical example
The first numerical example considers only two objectives and two design variables that permits the graphical representation of both: the Pareto front in the objective space and the Pareto set in the space of design variables. This example used a simple analytical expression:
min ( ) = +
min ( , )
. . 0.001 ≤ ≤ 0.1 . . 0 ≤ ≤ 10 ; 0 ≤ ≤ 10
(3)
where is the probability of system failure. It is important to note that the relation between and the reliability index is = Φ 1 − . Random variables, and , are normally distributed. Their mean values are the design variables, and their standard deviation are proportional to the mean values:
~ , = 0.05
~ , = 0.05 (4)
The limit state functions or performance functions included in the series system are:
( ) = ⁄20− 1
( ) = ( + − 5) ⁄30+ ( − − 12) ⁄120− 1
( ) = 80 (⁄ + 8 + 5)− 1
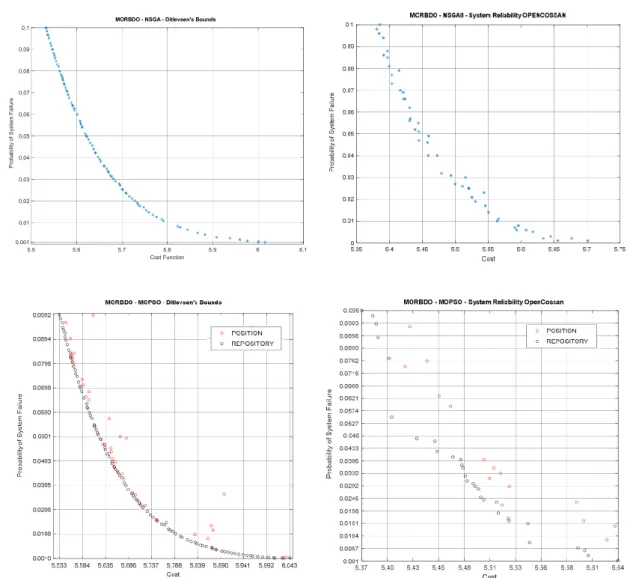
(5) NSGAII and MOPSO are applied to solve the multiobjective optimization phase. The parameters of the MOEA’s are shown in Table 1. Also, two methods are considered to compute the probability of system failure. The first method, based on Ditlevsen’s bounds [10, 11], provides an approximate value of probability of system failure. Ditlevsen´s bounds are computed from probabilities of failure at component-level obtained by FORM. The second method, based on the System Reliability Toolbox of OpenCossan computes the probability of the system failure using crude Monte Carlo simulation with 10000 samples for each vector of design variables.
Therefore, four alternatives methods have been implemented, combining the two MOEAs and the two reliability analysis methods:
a) NSGAII – Ditlevsen’s bounds
b) NSGAII – System Reliability Toolbox c) MOPSO – Ditlevsen’s bounds
d) MOPSO – System Reliability Toolbox
are computed using NSGAII while the plots c) and d) are obtained using MOPSO. Plots a) and c) use Ditlevsen’s bounds to compute the probability of failure of the series system. However, plots b) and d) consider the System Reliability Toolbox from OpenCossan.
Table 1: Parameters of the MOEAs for the analytical example.
NSGA - II MOPSO
Population size = 100 Particles in the swarm = 100
Maximum number of generations = 50 Maximum number of generations = 100 Distribution index for crossover = 20 Repository size = 100
Distribution index for mutation = 20 Inertia weight = 0.4
Mutation probability = 0.5 Individual confidence factor = 2 Crossover probability = 0.9 Swarm confidence factor = 2
Number of grids in each dimension Maximum velocity in percentage = 5 Uniform mutation percentage = 0.5
Pareto fronts obtained using Ditlevsen’s bounds in the reliability analysis phase present very well distribution and no difference exists between the Pareto front computed by NSGAII algorithm and the Pareto front computed by MOPSO algorithm. However, the distribution of Pareto fronts computed using the System Reliability Toolbox is not as well as the previous fronts. We can appreciate that for the same value of probability of system failure the cost is lower when the Pareto fronts are computed based in the System Reliability Toolbox. This reliability assessment methods is more accurate than Ditlevsen’s bounds. In addition, the upper Ditlevsen’s bound was chosen and this produces conservative results.
The Figure 1d) shows the objective values for the swarm and the repository in the last iteration. This last repository is the Pareto front. The number of individuals in the Pareto front is an important result. In case b), the front computed by NSGAII algorithm is more populated than the front in case d) computed by MOPSO, because offspring individuals whose reliability analysis does not converge were replaced by parents individual. However, particles of the swarm without convergence in the reliability assessment step were removed from the swarm in MOPSO.
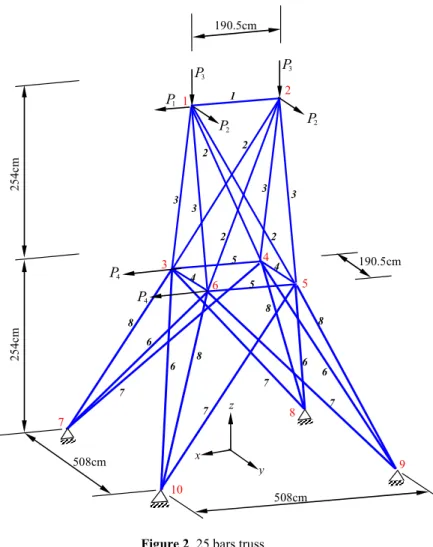
3.2 Space Truss
The second numerical example studies the design optimization of the 25 bars truss in Figure 2. This structure has been frequently used as a transmission tower and has been proposed in the literature to evaluate the performance of different optimization methods [9]. The MORBDO problem consists of optimizing two objectives: The first objective represents the cost of the structure represented by the volume of steel used in the construction of the tower. The second objective consists of minimizing the probability of failure of a component-level probabilistic constraint about the horizontal displacement of node 1. Constraints are imposed to probability if failure to remove extreme designs, extremely safe or extremely unsafe. The 25 bars are grouped in 8 groups. Bars belonging to the same group have the same cross sectional area. Therefore, there are 8 design variables. These design variables are the mean values of the cross section areas and take values in the range [2, 20] cm2. The complete set of random variables are
collected in Table 2. The elastic modulus , has been considered constant (E = 207 GPa). The mathematical formulation of this MORBDO problem is:
min .… ( ) = ∑ ∑ min .… ( , ) . . 0.0001 ≤ ≤ 0.1 . . 2cm ≤ ≤ 20cm ; = 1, . . ,8 (6)
where = ( , ) ≤ 0 , and ( , ) is a constraint in terms of ( , ), the y-axes displacement of node 1:
( , ) = 1 − ( , ) (7)
where is the admissible displacement of node 1 and its value is 0.013 cm.
Table 2: Random variables in the tower truss example Random
Variable Description Dist. Mean CoV
, … , Cross Section Area N Design Variables 0.05 Lateral Load N 60 kN 0.1 Lateral Load N 100 kN 0.1 Vertical Load N 200 kN 0.1 Lateral Load N 60 kN 0.1
The 25 bars truss has been modelled in the open-source finite element software OpenSees. The running time spent computing the Pareto front for this MORBDO problem when the finite element truss model is called directly is extremely high or prohibitive. Here, Quadratic Response Surface with cross terms, Pure Quadratic Response Surface, Polyharmonic Splines – a popular class of Radial Basis Functions and Kriging have been calibrated and validated for the full range of design variables. That is, a global metamodel is considered to approximate the original model in the full range of design variables. After the calibration process, a new sample of points is created to validate the metamodels. Table 3, shows the values of R2 metric obtained for the proposed metamodels. As Quadratic Response Surface with cross terms provides the best value of performance metric for the displacement response (R2 = 0.9243), it has been chosen to approximate the original model. Also, volume response is approximated by this metamodel. OpenCossan allows to communicate with third part finite element software like ANSYS, ABAQUS, Code Aster, OpenSees, and so on.
Here, only Monte Carlo simulation is applied in the reliability assessment. The mean value of volume and the probability of failure of the constraints has been computed using a sample of 10000 elements for each vector of design variables. NSGAII and MOPSO are used in the multiobjective optimization phase.
Figure 1: Pareto Fronts obtained for the analytical example using: a) NSGAII + Ditlevsen’s bounds, b) NSGAII + System Reliability Toolbox with MCS, c) MOPSO + Ditlevsen’s bounds and d) MOPSO + System Reliability Toolbox with MCS.
The Pareto fronts obtained are plotted in Figure 3 and 4. In Figure 4, the Pareto front is composed of black circles. These points represent the values of the objective functions for the repository points of last iteration. The red circles represent the values of the objective functions for particles in the swarm for the last iteration.
Both Pareto fronts are well distributed and very similar. In addition, the trade-off fronts contain a large number of individuals. This large rate of convergence for the reliability analysis is achieved whit the Quadratic Response Surface metamodel. When structural reliability analysis is carried out directly on the original model convergence difficulties appear caused by numerical instability or ill-conditioned stiffness matrix. However, the Quadratic Response Surface is very easy to compute and produces output values for any input value.
The sample sizes for the calibration and validation of metamodels were 300 and 100,
Cost Function 5.5 5.6 5.7 5.8 5.9 6 6.1 P ro b a b ili ty o f S y s te m F a ilu re 0,001 0,01 0,02 0,03 0,04 0,05 0,06 0,07 0,08 0,09 0,1
values of R2 metric were obtained. Global metamodels could be improve adding new sample points by an adaptive process [12]. However, this adaptive global metamodel would increase the computational budget with a very tiny improvement in accuracy.
Figure 2. 25 bars truss
Table 3: R-square metric obtained for the metamodels studied.
Metamodel Process Displac. Volume
Quadratic Response Surface Calibration 0.9580 1.0000
Quadratic Response Surface Validation 0.9243 1.0000
Pure Quadratic Response Surface Calibration 0.8723 1.0000
Pure Quadratic Response Surface Validation 0.8883 1.0000
Polyharmonic Splines Calibration 1.0000 1.0000
Polyharmonic Splines Validation 0.9219 1.0000
Kriging Calibration 1.0000 1.0000 Kriging Validation 0.9184 0.9800 190.5cm 190.5cm 508cm 508cm 254 c m 254 c m 1 2 3 4 5 6 7 8 9 10 1 2 2 2 2 3 3 3 3 4 4 5 5 6 6 6 8 8 8 8 6 7 7 7 7 y z x 1 P 2 P P2 3 P 4 P 4 P 3 P
Figure 3: Pareto front obtained with NSGAII (nº generations =100, population size = 100)
Figure 4: Pareto front obtained with MOPSO (nº generations =100, swarm size = 100)
P ro b a b ili ty o f F a ilu re P ro b a b ili ty o f F a ilu re
Table 4: Parameters of the MOEAs for the 25 bars truss example.
NSGA – II MOPSO
Population size = 100 Particles in the swarm = 100
Maximum number of generations = 100 Maximum number of generations = 100 Distribution index for crossover = 20 Repository size = 100
Distribution index for mutation = 20 Inertia weight = 0.4
Mutation probability = 0.5 Individual confidence factor = 2 Crossover probability = 0.9 Swarm confidence factor = 2
Number of grids in each dimension Maximum velocity in percentage = 5 Uniform mutation percentage = 0.5
4 CONCLUSIONS
In this paper, several methods have been adopted to solve a type of Multi-Objective Reliability Based Design Optimization (MORBDO) problem where the cost and the probability of failure are the conflicting objectives. Two types of algorithms were combined: Multi-Objective Optimization Evolutionary Algorithms (such as NSGAII and MOPSO), in the outer multi-objective step and Reliability Analysis methods in the inner step.
It has been found that NSGAII and MOPSO worked well in the examples shown here and able of providing well distributed Pareto fronts. Several global metamodels were calibrated and validated to replace the original model in order to reduce the computational costs of the analysis. Quadratic Response Surface provided the best performance measure. An additional advantage of using metamodels is that most of convergence issues in the reliability analysis stage are avoided and the Pareto fronts are then more populated compared to those computed with the original method.
Future works will concentrate on developing MORBDO methods able to handle severe uncertainty and incomplete information (for instance when only samples of uncertain quantities are available).
REFERENCES
[1] Deb, K., Pratap, A., Agarwal, S. and Meyarivan T. A Fast and Elitist Multiobjective Genetic Algorithm: NSGA-II. IEEE Transactions on Evolutionary Computation, 6 (2), 182-197 (2002).
[2] Coello, CAC., Pulido, GT. Lechuga, MS. Handling multiple objectives with particle swarm optimization. IEEE Transactions on evolutionary computation (2004) 8 (3), 256-279.
[3] Patelli, E. COSSAN: A multidisciplinary software suite for uncertainty quantification and risk management. Handbook of Uncertainty Quantification, pp. 1909-1977. (2017). DOI: 10.1007/978-3-319-12385-1_59.
[4] Patelli, E.; Tolo, S.; George-Williams, H.; Sadeghi, J.; Rocchetta, R.; Angelis, M. D. & Broggi, M. OpenCossan 2.0: an efficient computational toolbox for risk, reliability and resilience analysis. Proceedings of the joint ICVRAM ISUMA UNCERTAINTIES
conference, 2018
[5] Sinha, K. Reliability-based multiobjective optimization for automotive crashworthiness and occupant safety. Structural and Multidisciplinary Optimization. 33(3), 255–268, (2007).
[6] Zou, T. and Mahadevan, S. Versatile Formulation for Multiobjective Reliability-Based Design Optimization. J. Mech. Des 128(6), 1217-1226 (2005).
[7] Sun, G., Zhang, H., Fang, J., Li, G, and Li, Q. Multi-objective and multi-case reliability-based design optimization for tailor rolled blank (TRB) structures. Structural and Multidisciplinary Optimization 55:1899-1916. (2017). DOI10.1007/s00158-016-1592-1 [8] Gu, X., Sun, G., Li, G., Mao, L. and Li, Q. A comparative study on multiobjective reliable
and robust optimization for crashworthiness design of vehicle structure. Structural and Multidisciplinary Optimization. 48:669–684. (2013). DOI 10.1007/s00158-013-0921-x [9] Schmit, L. A. Jr and Farshi, B. Some approximation concepts for structural synthesis.
AIAA Journal 12, 1974. DOI 10.2514/3.49321
[10] Melchers, R.E. Structural Reliability Analysis and Prediction, 2nd Edition. Wiley (1999). [11] Celorrio L. (2017) Multiobjective Reliability-Based Design Optimization Formulations Solved Combining NSGA-II and First Order Reliability Method. In: Martínez de Pisón F., Urraca R., Quintián H., Corchado E. (eds) Hybrid Artificial Intelligent Systems. HAIS 2017. Lecture Notes in Computer Science, vol 10334. Springer, Cham. (2017).
[12] Pospísilová, A. and Leps, M. Multi-Objective Reliability-Based Design Optimization using Subset Simulation Enhanced by Meta-Models. The 7th International Workshop on Reliable Engineering Computing. REC 2016.
ACKNOWLEDGMENT
This research was carried out during the research stay of the first author in the Institute for Risk and Uncertainty of the University of Liverpool in 2017. This research stay was supported by University of La Rioja and the Government of La Rioja (Spain) as an activity of the V Regional Plan of R+D. The authors acknowledge the effort of these institutions to foment research and development.